
Weekly Fundamental Analysis Report
Fear & Greed Index
Source: Alternative.me
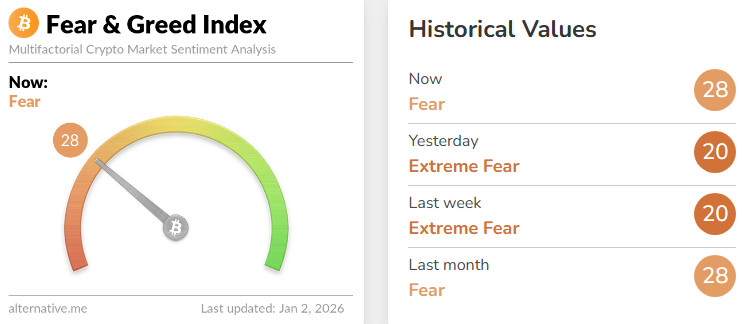
Change in Fear and Greed Value: +8
Last Week’s Level: 20
This Week’s Level: 28
The Fear and Greed Index rose from 20 to 28 this week, signaling a more pronounced recovery from the extreme fear regime. The rise was driven by a weakening of panic sentiment during the year-end period and more controlled price behavior. While the US maintained its holiday week-specific low volume and volatile outlook, the release of the Fed meeting minutes brought policy disagreements back to the forefront. However, the perception that uncertainty was manageable did not cause a sudden deterioration in risk appetite and contributed to sentiment finding a bottom in the extreme fear zone. Furthermore, the fact that initial jobless claims in the US came in at 199,000, below the expected 218,000 and below the previous 214,000, reinforced the perception that there was no sharp deterioration in employment, emerging as a headline that supported risk sentiment. Although position adjustments in the last session of the year and limited trading volume due to the January 1 holiday maintained a cautious tone, the lack of significant volatility in crypto and the market not reverting to a sharp risk-off mode supported a recovery in the index towards the 28 level.
Crypto Fund Flows
Source: Coinshares
Overview:
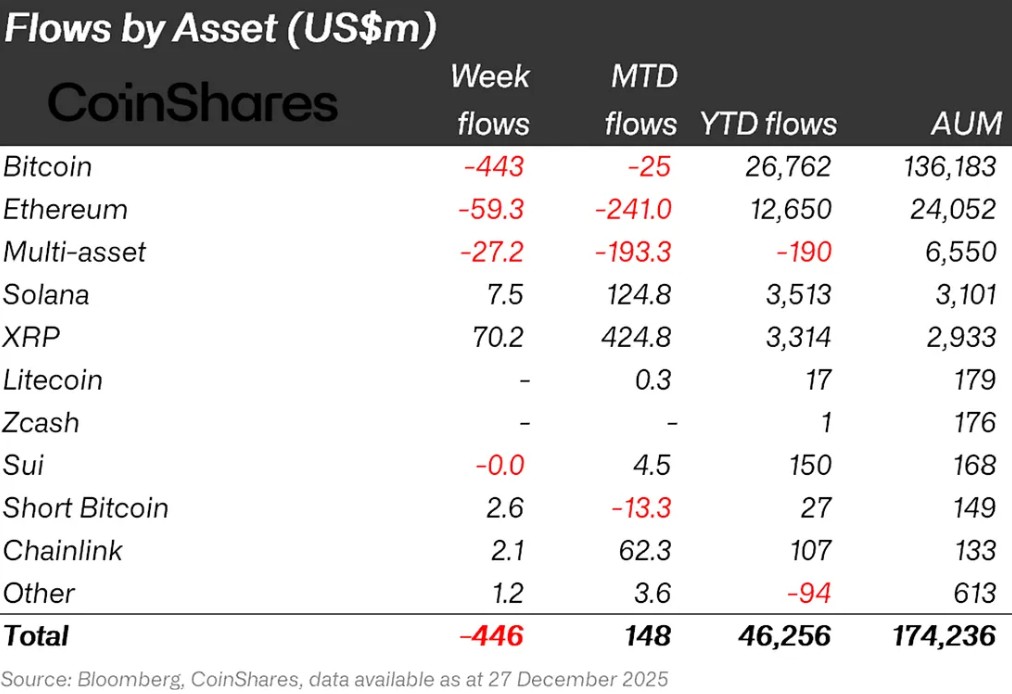
Cryptocurrency markets experienced a week of market closures due to New Year and Christmas events. Bitcoin and altcoins saw limited sideways movement. As a result, Bitcoin gained approximately 1% in value over the week.
- Solana (SOL): Solana saw an inflow of $7.5 million.
- Chainlink (LINK): Chainlink saw an inflow of $2.1 million.
- Litecoin (LTC): Litecoin saw an inflow of $0.3 million.
- Ripple (XRP): XRP saw $70.2 million in fund inflows this week.
- Short Bitcoin: Short Bitcoin saw an inflow of $2.6 million.
- Other: Sector-specific and project-based declines in altcoins, along with the overall market sentiment, brought about a $1.2 million inflow in fund flow data.
Fund Outflows:
- Bitcoin (BTC): Bitcoin continues to experience outflows and losses from investors this week. Bitcoin-focused funds saw an outflow of $443.0 million.
- Ethereum (ETH): Alongside spot ETH inflows, there was a $59.3 million outflow from Ethereum this week.
- SUI: Sui saw an outflow of $0.0 million.
- Multi-asset: Outflows were observed in the multi-asset group.
Total MarketCap
Source: Tradingview
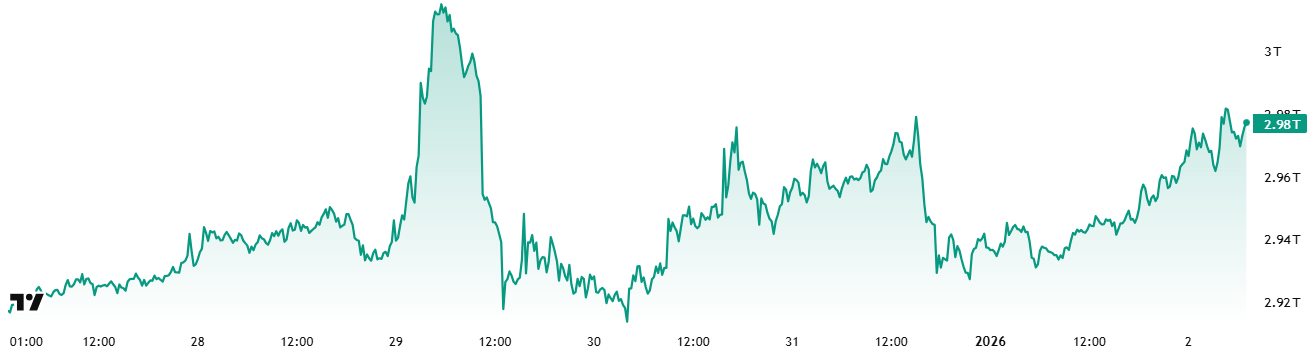
- Last Week’s Market Value: $2.95 Trillion
- This Week’s Market Value: $2.98 Trillion
This week, the cryptocurrency market recorded a growth of approximately $30 billion, showing a 1.02% increase, and the total market value rose to $2.98 trillion. The week’s peak was $3.02 trillion, and the lowest level was $2.91 trillion. Thus, the market was seen moving within a $114 billion band, indicating a time-based volatility of 3.95%. It is noteworthy that volatility narrowed compared to last week’s 4.89% range. The fact that we are beginning to see weeks where the weekly average candle size falls below the scale in the crypto market can be interpreted as a strong signal that we may be on the verge of a larger price movement.
Total 2
Starting the week with a market value of $1.19 trillion, the Total 2 index rose 1.16% during the week, gaining approximately $13.6 billion in value and closing the period at around $1.21 trillion. The weekly high was recorded at $1.22 trillion, while the low was $1.18 trillion. The index fluctuated within a band of $43 billion, corresponding to a volatility of approximately 3.7% for the period. With this outlook, Total 2 continues to trade approximately $560 billion below its all-time high. The required rate of increase from current levels to reach its previous peak is calculated to be approximately 46.5%.
Total 3
Starting the week with a total market value of $0.835 trillion, the Total 3 index grew by approximately $5.5 billion during the week, rising by 0.66% and closing the period at $0.841 trillion. Volatility between the week’s highest and lowest values was 3.61%. With this performance, Total 3 successfully maintained its position as the most stable index this week by preserving its relatively low volatility structure.
The index-volatility ranking of Total > Total 2 > Total 3 indicates that volatile price movements were primarily concentrated on the Bitcoin side. Additionally, it is noteworthy that Ethereum experienced a slight recovery in its total market share during this period.
Altcoin Season Index
Source: Coinmarketcap
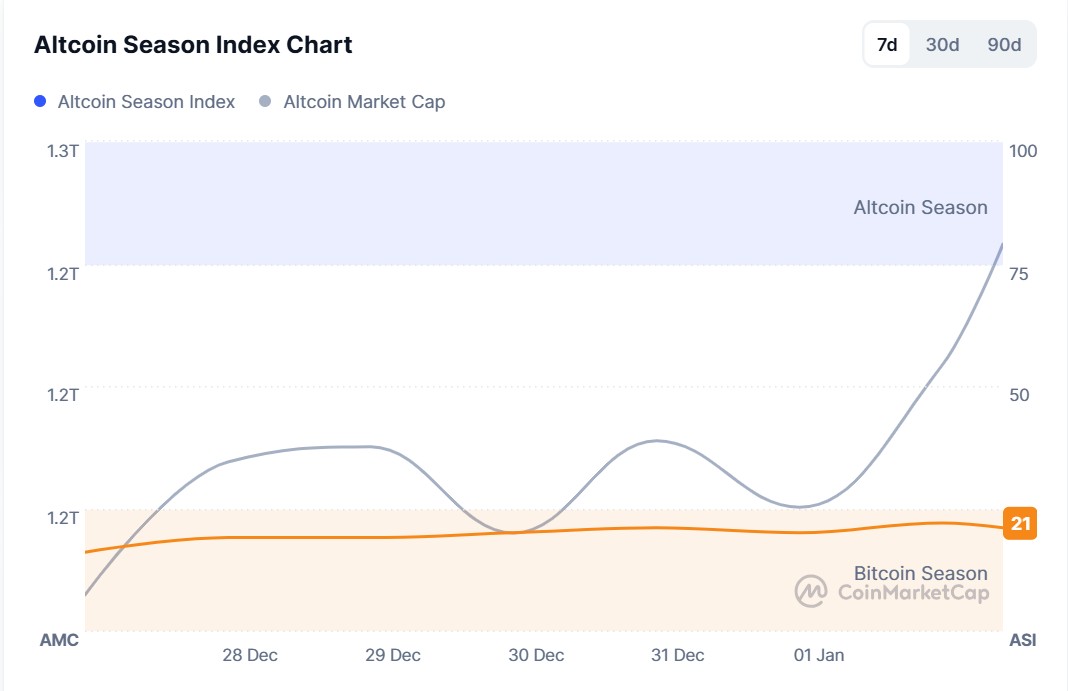
- Last Week’s Index Value: 16/100
- This Week’s Index Value: 22/100
Between December 25 and January 2, 2025, after a slight increase in the correlation between altcoin market dominance (Altcoin Market Cap) and the Altcoin Season Index, a decline occurred again. The graph shows that this week, on December 22 , the index rose to 22, indicating that the Altcoin Market Cap reached 1.25T. When the index rose this week, the top 5 coins leading the rise were ZEC, Pippin, H, Dash, and XMR. The Altcoin Index indicates the potential for a decline in the altcoin season this week.
Bitcoin Dominance
Source: Tradingview
Weekly Change
- Last Week’s Level:98%
- This Week’s Level:54%
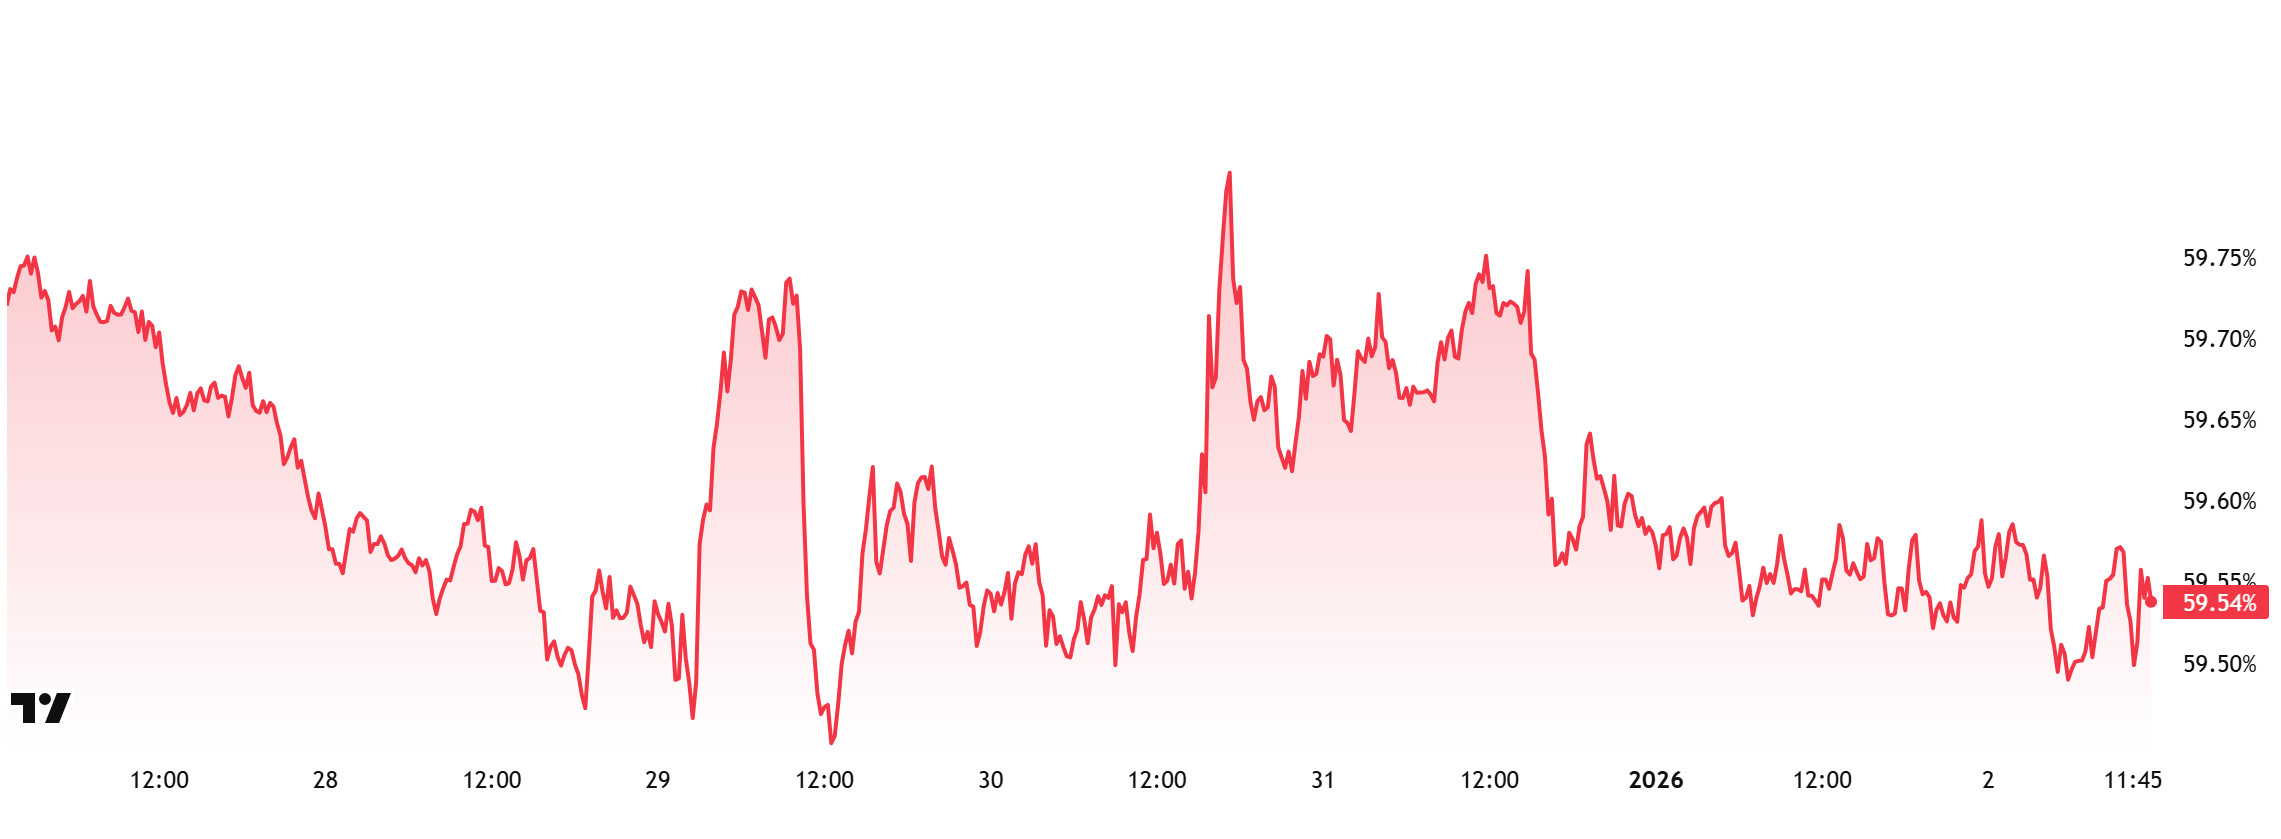
Bitcoin dominance, which started the week at 59.55%, rose to 59.72% during the week but then retreated slightly and is currently at 59.54%.
This week, Strategy purchased 1,229 Bitcoin and Metaplanet purchased 4,279 Bitcoin. Additionally, data on Bitcoin spot ETFs shows a net outflow of $12.4 million to date.
Weekly data indicates a clear recovery in institutional buying, with both Strategy and Metaplanet resuming Bitcoin purchases this week. The cautious stance seen in previous weeks appears to be giving way to renewed institutional interest. On the retail investor front, trading through ETFs, the decrease in net outflows compared to last week indicates that pressure on short-term demand is easing. Although there is not yet a strong picture on the inflow side, the slowdown in the rate of outflows shows that retail investors’ risk aversion is beginning to weaken. With the onset of the holiday season, trading volumes in the markets continue to remain low. This situation limits capital inflows into crypto assets and weakens expectations of strong price movements in the short term. Under current conditions, demand for Bitcoin remains steady, but Bitcoin continues to maintain its relatively strong position compared to Ethereum and other major altcoins. If the low-volume market structure persists, BTC dominance is expected to continue its horizontal trend in the 59%–61% range.
Ethereum Dominance
Source: Tradingview
Weekly Change:
- Last Week’s Level: 12.07%
- This Week’s Level: 1 2.25%
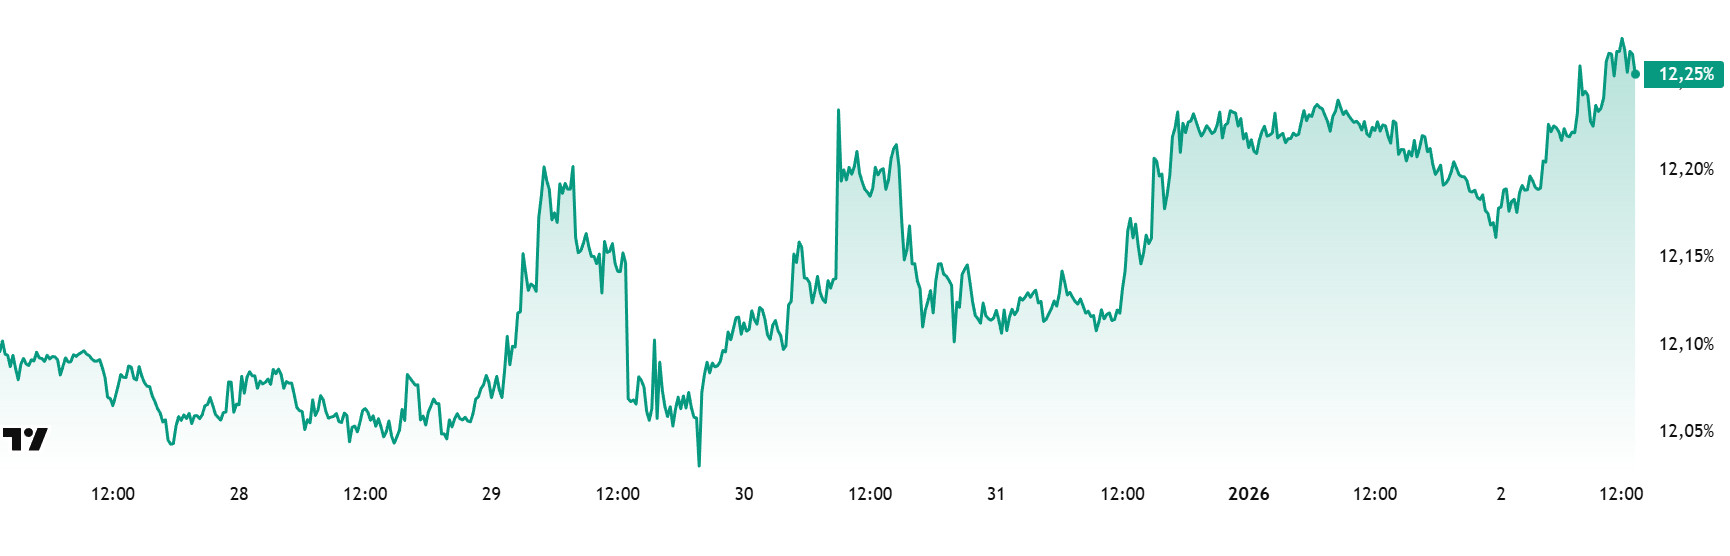
Ethereum dominance, which rose to 15% levels in mid-August, lost momentum in the following period and entered a downward trend. Although this negative outlook was partially offset by a limited positive correction until the first week of December, it has reversed direction again in the last two weeks, recording a pullback. However, as of this week, it has regained positive momentum.
In this context, Ethereum dominance closed last week at 12.07% and is currently trading at around 12.25%. During the same period, Bitcoin dominance has also followed a positive trend alongside Ethereum dominance.
The key developments affecting Ethereum dominance are as follows:
SharpLink announced that it earned a total of 518 ETH last week thanks to staking rewards. It was noted that this return corresponds to a value of over $1.5 million at current Ethereum prices. The company has purchased a total of 10,219 ETH since opening its Ethereum treasury on June 2. It was stated that SharpLink continues to evaluate the majority of its ETH assets through staking. This strategy stands out as part of the goal of generating long-term passive income.
Bitcoin Spot ETF
Source: Darkex Research Department
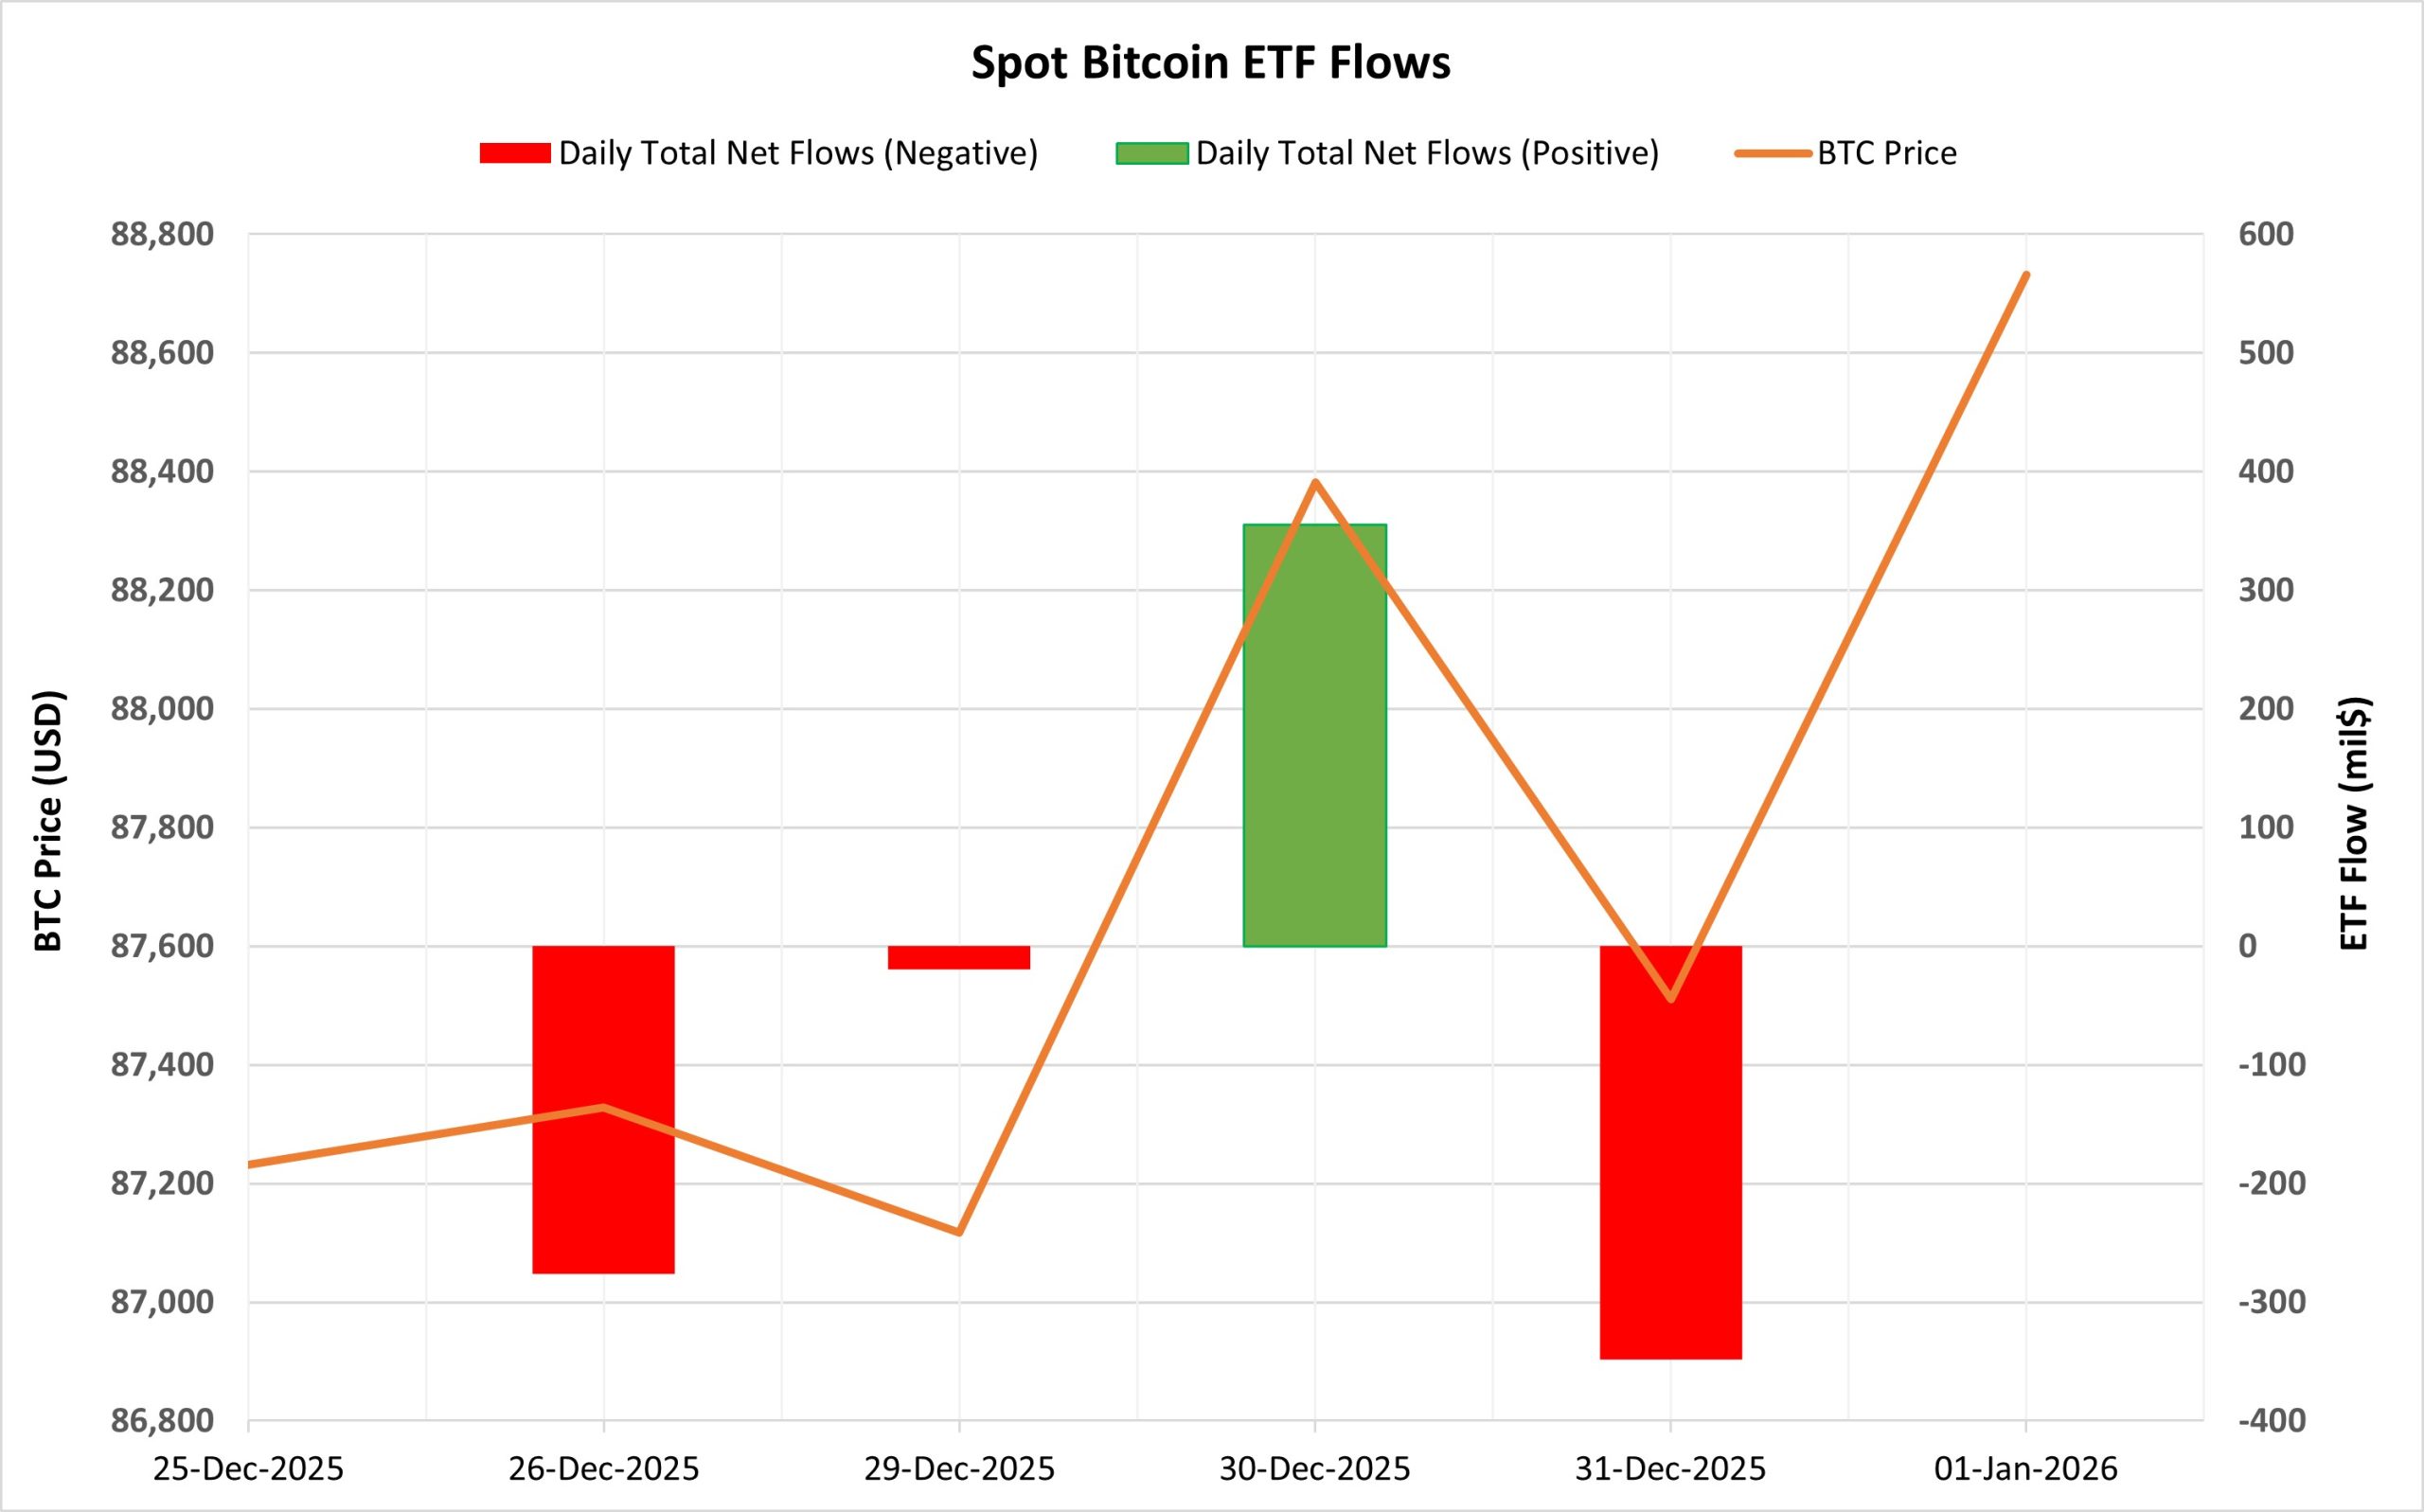
Netflow Status: Between December 26, 2025, and January 1, 2026, a total of $288.2 million in net outflows occurred from Spot Bitcoin ETFs. During this period, the 7-day series of negative net flows ended on December 30 with a net inflow of $355.1 million. While the sharp outflows seen on December 26 and December 31 pushed the overall picture into negative territory, strong inflows on December 30, particularly from BlackRock IBIT, Fidelity FBTC, and Ark ARKB, provided a short-term balance. However, this recovery did not turn into a sustained flow series.
Bitcoin Price: Bitcoin opened at $87,232 on December 26 and closed at $88,731 on January 1, 2026. During this period, the BTC price rose by 1.72%. ETF-driven selling pressure limited the price from gaining stronger momentum during this period.
Cumulative Net Inflow: At the end of the 493rd trading day, the cumulative total net inflow of Spot Bitcoin ETFs fell to $56.594 billion.
As in recent weeks, the negative trend in Spot Bitcoin ETFs came to the fore in the last week of 2025. The inflows seen on December 30 provided short-term relief. However, the lack of follow-through on these inflows revealed that institutional investors remained cautious ahead of the new year. The limited correlation between price and ETF flows showed that the uptrend was fragile. In the coming period, if there are sustained and stable inflows on the ETF side, a more solid uptrend structure could form for the Bitcoin price. Otherwise, renewed selling pressure from ETFs could continue to limit upward attempts on the price side.
| DATE | COIN | Open | Close | Change % | ETF Flow (mil$) |
|---|---|---|---|---|---|
| December 26, 2025, | BTC | 87,232 | 87,328 | 0.11% | -275.9 |
| December 29, 2025 | BTC | 87,879 | 87,117 | -0.87% | -19.3 |
| December 30, 2025 | BTC | 87,117 | 88,382 | 1.45% | 355.1 |
| December 31, 2025 | BTC | 88,382 | 87,511 | -0.99% | -348.1 |
| January 1, 2026 | BTC | 87,511 | 88,731 | 1.39% | 0 |
| Total for Dec 26, 2025 – Jan 1, 2026 | 1.72% | -288.2 |
Ethereum spot ETF
Source: Darkex Research Department
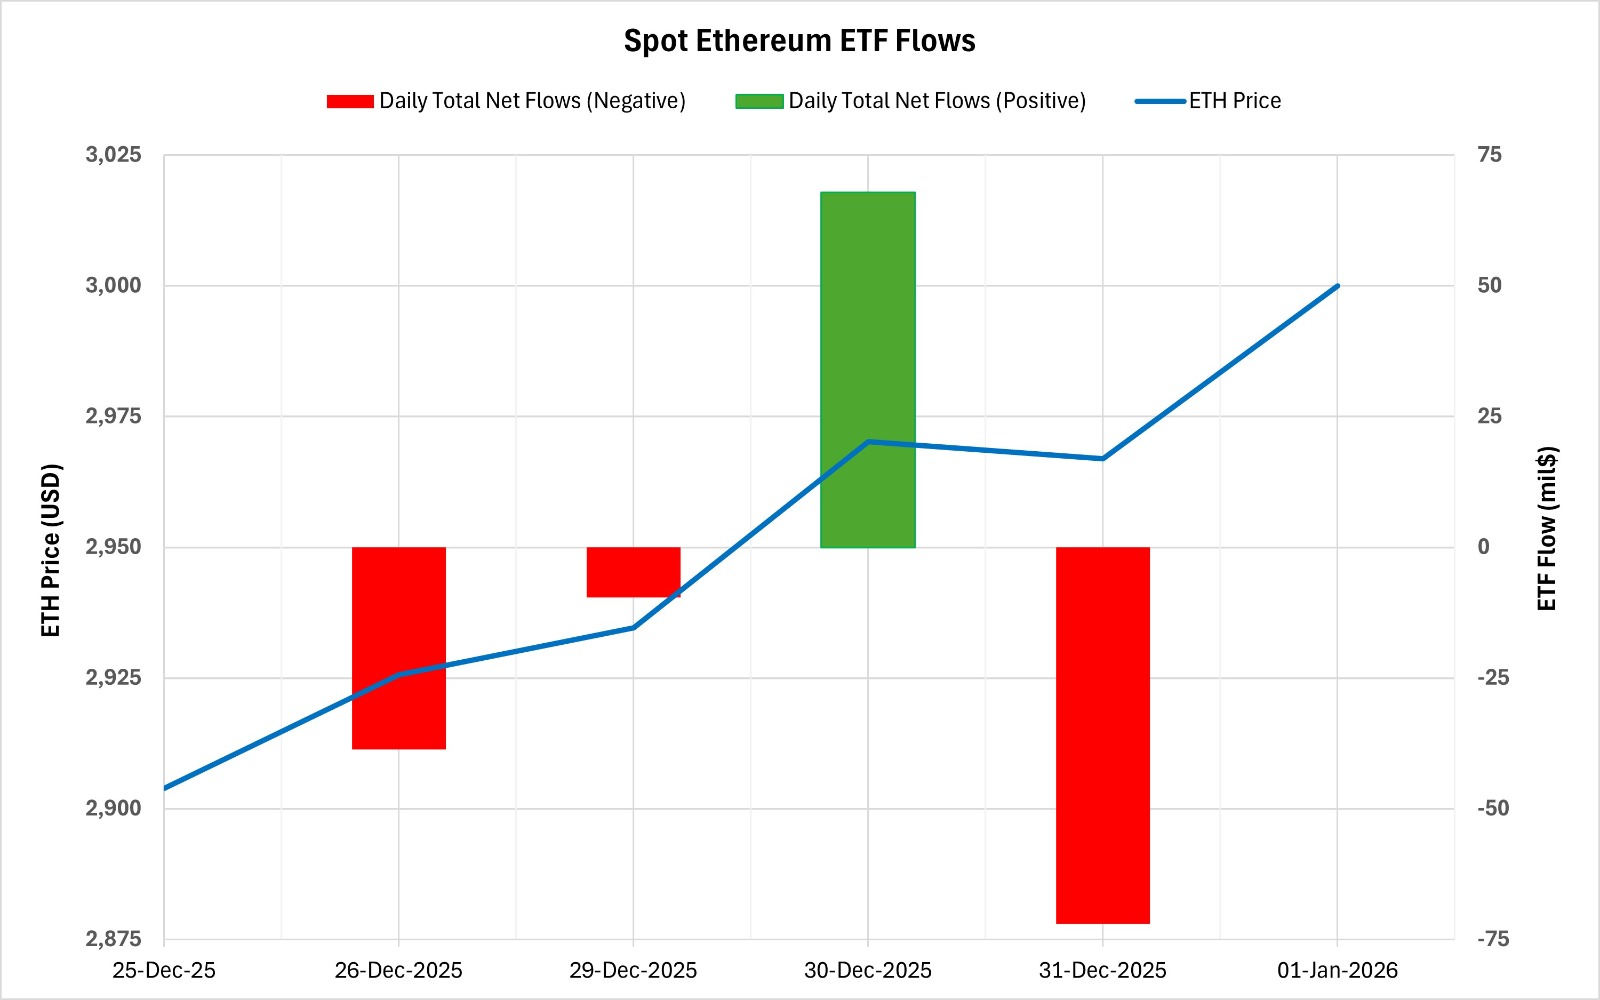
Between December 26, 2025, and January 1, 2026, Spot Ethereum ETFs saw a total net outflow of $52.4 million. While ETF flows were generally weak and volatile during this period, the four-day series of negative net flows ended on December 30 with a net inflow of $67.9 million. Outflows were primarily driven by BlackRock ETHA. As of the 363rd trading day, the cumulative total net inflow for Spot Ethereum ETFs declined to $12.347 billion.
| DATE | COIN | Open | Close | Change % | ETF Flow (mil$) |
|---|---|---|---|---|---|
| December 26, 2025 | ETH | 2,904 | 2,926 | 0.75% | -38.7 |
| December 29, 2025 | ETH | 2,949 | 2,935 | -0.48% | -9.6 |
| December 30, 2025 | ETH | 2,935 | 2,970 | 1.21% | 67.9 |
| December 31, 2025 | ETH | 2,970 | 2,967 | -0.11% | -72 |
| January 1, 2026 | ETH | 2,967 | 3,000 | 1.12% | 0 |
| Total for Dec 26, 2025 – Jan 1, 2026 | 3.31% | -52.4 |
Ethereum opened at $2,904 on December 26 and closed at $3,000 on January 1, 2026. During this period, the ETH price rose by 3.31%. Despite the recovery in price, ETF flows remained negative, indicating that the rise was primarily driven by the spot market. Although the simultaneous positive movement of both price and ETF flows on December 30 produced a short-term equilibrium signal, the weakening flows on the last trading day of the year signaled continued caution on the institutional side. If inflows continue on the ETF side in the coming days, the upward movement in the ETH price could gain a more solid footing. However, if flows remain negative , upward attempts on the price side may be limited, and volatility could increase.
Bitcoin Options Distribution
Source: Laevitas
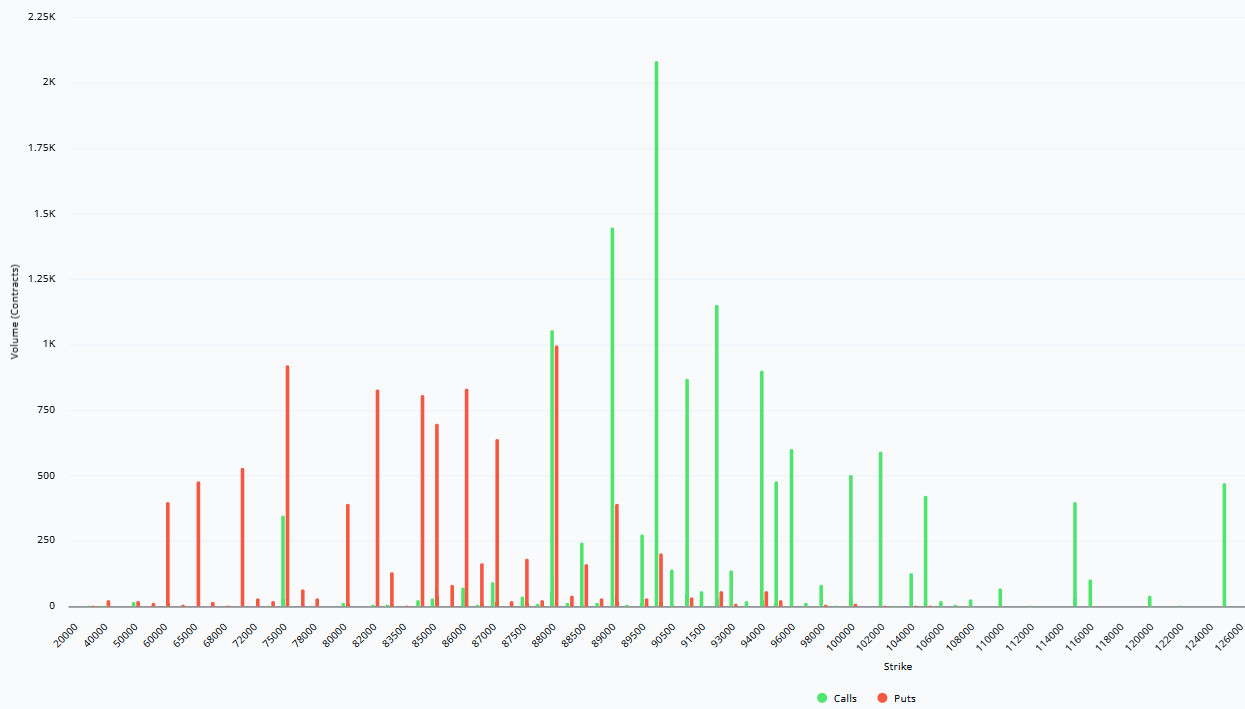
BTC: Notional: $1.86B | Put/Call: 0.61 | Max Pain: $88K
Deribit Data: Deribit data shows that BTC option contracts with a notional value of approximately $1.86 billion expire today. At the same time, looking at the risk transformation over the next week based on the last 24 hours’ data, put options are dominating over call options in terms of risk hedging. However, an increase in call options is seen in the coming days. When examining expected volatility (IV), it is above realized volatility (RV). On the other hand, the positive spread metric indicates increased risk appetite in the market and shows us that call options are expensive. Skew values are also rising today and next week.
Laevitas Data: Examining the chart, we see that put options are concentrated in a wide band between $75,000 and $88,000. Call options, on the other hand, are spread across a broad base between the $88,000 and $105,000 levels. At the same time, the $90,000 level appears to be resistance, while the $88,000 level appears to be support. On the other hand, there are 994 put options at the $85,000 level, peaking here, with put volume decreasing after this level. Meanwhile, 2.01K call option contracts peak at the $90,000 level. Looking at the options market, we see that call contracts are slightly dominant on a daily and weekly basis.
Option Maturity:
Put/Call Ratio and Maximum Pain Point: Looking at the options in the latest 7-day data from Laevitas, the number of call options increased by approximately 30% compared to last week, reaching 72.52K. In contrast, the number of put options increased by 3% compared to last week, reaching 54.51K. The put/call ratio for options is set at 0.61. This indicates that investors are showing more demand for call options th . Bitcoin’s maximum pain point is seen at $88,000. BTC is currently priced at $89,000, and if it does not break below the pain point of $88,000, further increases can be anticipated.
Ethereum Options Distribution
Source: Laevitas
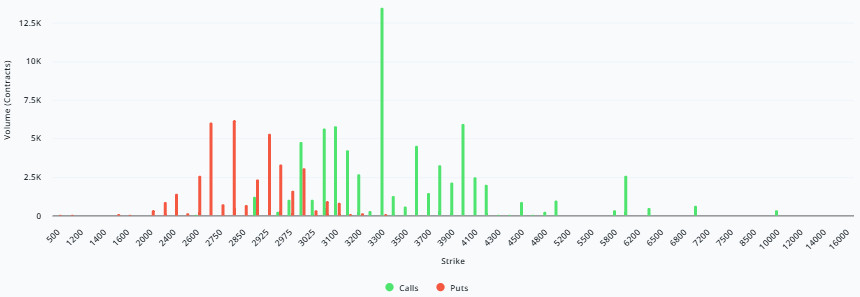
ETH: $0.4 B notional | Put/Call: 0.58 | Max Pain: $2,950
Laevitas Data: Looking at the data in the chart, we see that put options are concentrated in a fairly wide band, particularly between the $2,700 and $3,000 price levels. The highest put volume is at the $2,800 level, with approximately 7K contracts. On the other hand, in call options, there is a noticeable concentration between the $3,000 and $3,300 levels. The highest call volume appears to be approximately 14K at the $3,300 level.
Deribit Data: First of all, ATM volatility is still above 50, meaning the potential for sharp price movements remains quite high. To get an idea of the weight of this volatility, when we look at the risk reversal and skew, we see that there is no dominant downward stress. The negative RR, which measures downward panic sentiment, has not yet formed here. When we evaluate the increase in both call and put volumes together, we see that this volume in the market is more a result of hedging and balancing reflexes on the put side, rather than directional fear, while on the call side, the market’s upward expectations are quite high. To summarize, while there is no definitive signal of an upward trend, we can say that option players have strong upward price expectations.
Option Maturity:
Ethereum options with a nominal value of $0.4 billion expired on January 2. The Max Pain level was calculated at $2,950, while the put/call ratio stood at 0.58.
Legal Notice
The investment information, comments, and recommendations contained in this document do not constitute investment advisory services. Investment advisory services are provided by authorized institutions on a personal basis, taking into account the risk and return preferences of individuals. The comments and recommendations contained in this document are of a general nature. These recommendations may not be suitable for your financial situation and risk and return preferences. Therefore, making an investment decision based solely on the information contained in this document may not result in outcomes that align with your expectations.
