
Weekly Fundamental Analysis Report
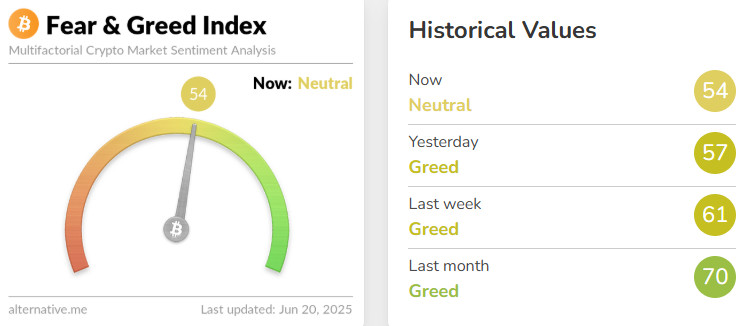
Fear & Greed Index
Source:Alternative
Change en Fear and Greed Value: -7
Last Week Level: 61
This Week’s Level: 54
The Fear and Greed Index fell from 61 to 54 this week, indicating a marked cooling en market sentiment. While the Fed kept the interest rate unchanged, it lowered its 2025 growth forecast to 1.4% and raised its inflation expectation to 3%, while May PCE inflation came en at 2.3% y/y and core inflation at 2.6%, which increased investor indecision. In the Eurozone, annual inflation declined to 1.9% from 2.2% previously, en line with expectations. Although this decline eased the global liquidity perception to some extent, its impact was limited. In institutional buying, Metaplanet bought 1,112 BTC, bringing its reserve to 10,000 BTC, and Strategy acquired another 10,100 BTC at an average of $104,080, confirming that demand is still brisk. Although the passage of the GENIUS Act bill en the Senate clarified regulatory uncertainty, the Fed’s increase en the probability of a rate cut en September to 71% caused investors to remain en a wait-and-see mode. In the light of these developments, the index could not sustain the strong rise of the previous week and fell from 61 to 54, indicating that the cautious mood en the market continued.
Fund Flows
Source: CoinShares
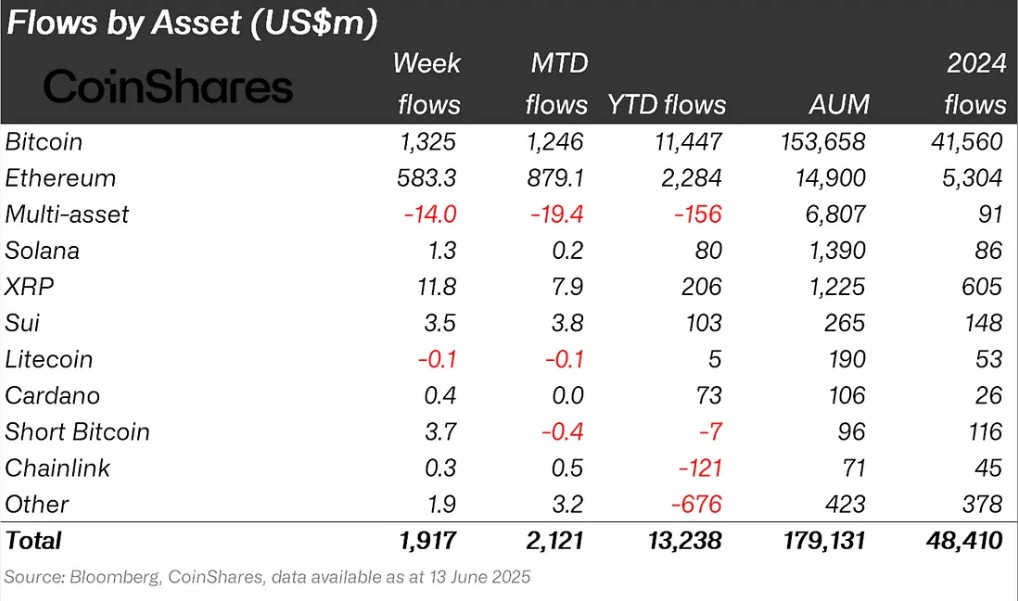
Overview While the crypto market had an up and down week amid macroeconomic uncertainties and regulatory news, the ongoing IRAN-ISRAEL stalemate en the Middle East and the US involvement en the war created a lot of volatility en Bitcoin. The gain en Bitcoin reached 2%.
Fund Inputs:
Bitcoin (BTC): Macroeconomic uncertainties and the constant news of war en the Middle East led to a decline en Bitcoin after it approached the ATH point, which led to fund outflows. Bitcoin fund inflows reached $1.3 billion this week.
Ethereum (ETH): Spot ETH has performed strongly el the back of institutional interest. This week, $583.3 million flowed into Ethereum.
Short Bitcoin: Inflows into short bitcoin positions totaled $3.7 million. ATH expectation continues.
Ripple (XRP): In the most anticipated development en the market, the judge postponed the status report el the case between Ripple and the SEC. This report could affect the course of the case and the course of a possible settlement. Fund inflow en Xrp this week was $11.8 million.
Solana (SOL): One of the key hot topics is the growing anticipation for Solana ETFs. 8 major companies have applied for spot Solana ETFs and there is talk that these ETFs could potentially be approved en 2025, significantly increasing the likelihood of approval, while Solana saw an inflow of $1.3 million.
Cardano (ADA): Cardano continues to work el the Voltaire upgrade, which aims to implement full el-chain governance. This upgrade will allow ADA holders to vote el network offerings. This is an important step towards making Cardano a more decentralized and community-driven platform. This week saw $0.4 million inflows into Cardano.
SUI: Sui’s BTC TVL (total value locked) has exceeded $200 million. In addition, the significant presence of Sui assets en digital asset funds shows that institutional investors continue to be interested en the network. Sui saw $3.5 million en inflows this week.
Chainlink (LINK): Chainlink has partnered with major financial institutions such as UBS Asset Management and Swift for tokenized fund deals, taking important steps en its goal to gain a share of this huge market. Upon the announcement of this collaboration, Link saw an inflow of $0.3 million this week.
Other: Altcoins saw sectoral and project-based rallies. These attacks brought an inflow of 1.9 million dollars en fund flow data.
Fund Outflows:
Multi-asset: The volatility en the market also led to outflows en the multi-asset group despite the ETF data.
Litecoin (LTC): Its long-term prospects remain buoyant with a potential spot ETF approval and the adoption of technological innovations such as MWEB. Ltc saw a fund outflow of -0.1 million dolae this week.
Total MarketCap
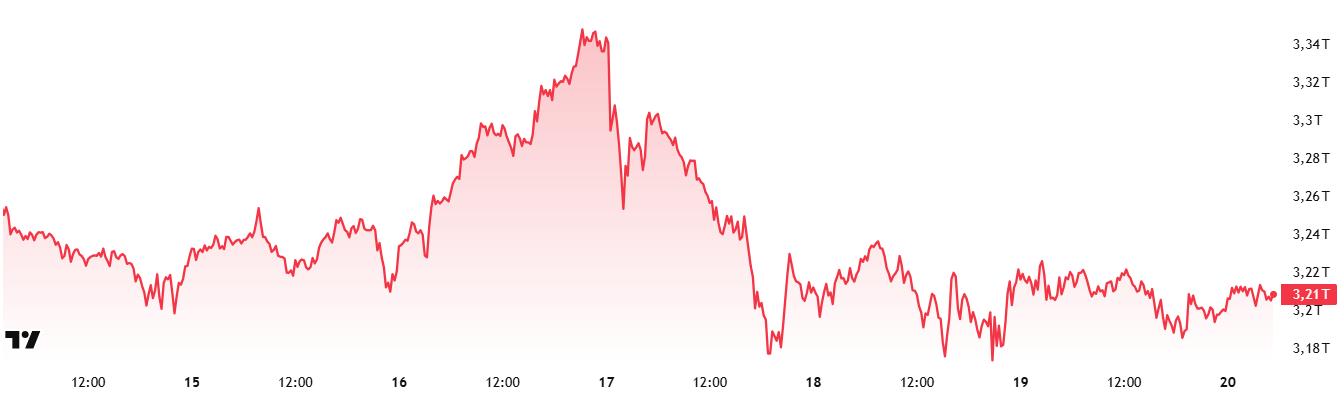
Source : Tradingview
- Last Week Market Capitalization : 25 Trillion Dollars
- Market Capitalization This Week: 21 Trillion Dollars
The cryptocurrency market lost 1.13% this week with a meltdown of $36.83 billion. Thus, the total market capitalization fell to $3.21 trillion. This made it four consecutive weeks of declines. Although this move may seem like a technical correction, the tension of the global agenda will continue to be one of the most critical factors that will continue to influence the market en the coming period.
Total 2
Total 2 started the new week with a market capitalization of $1.15 trillion, down 1.66% to $18.98 billion. With this movement, it fell to $ 1.13 trillion. Total 2, which declined at a higher rate compared to the overall decline rate of the Total Market, shows that the retreat en altcoins is more severe compared to Bitcoin. In short, the withdrawal en altcoins seems to be more than bitcoin.
Total 3
Total 3, which started the week at $838.43 billion, retreated por 1.83% to $823.06 billion with a loss of $15.37 billion el a weekly basis. According to these calculations, the total outflow el Ethereum accounts for 16% of the total outflow en the altcoin market, but since it accounts for an average of 28% of the altcoin market, it can be said that it is more robust than the altcoin average.
While the rate of decline has been lower en margin coins, it seems to have been higher en coins with low market capitalization. This gives clues that the market has not yet signaled a divergence en altcoins.
Bitcoin Dominance
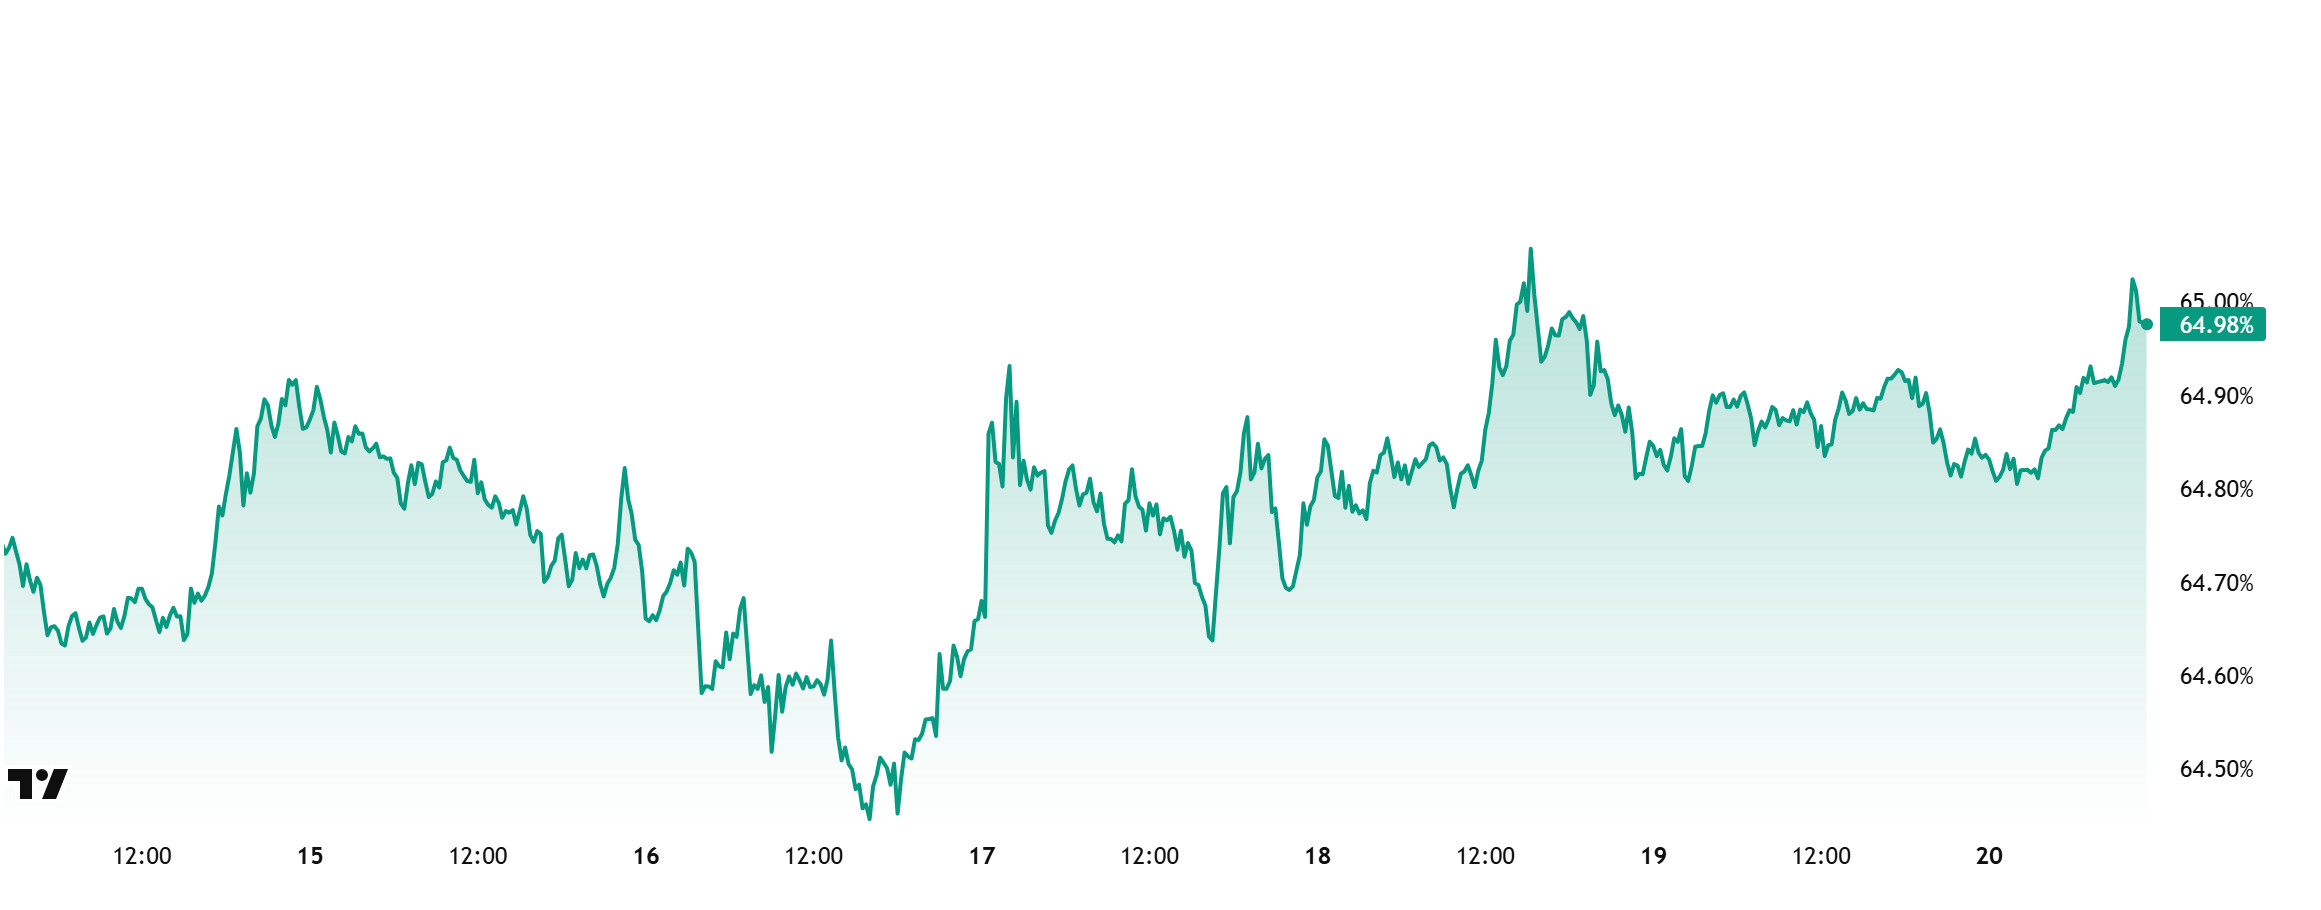
Bitcoin Dominance
Bitcoin dominance, which started the week at 64.65%, rose as high as 65.04% during the week. After this increase, dominance retreated slightly and is currently at 64.98%.
10,100 units of Bitcoin were bought por Strategy and 1,112 units of Bitcoin were bought por Metaplanet this week.
Data el Bitcoin spot ETFs show a total net inflow of $1.02 billion to date.
Geopolitical risks remain due to the tensions between Israel and Iran, which have persisted throughout the week, and this situation increases the selling pressure el risky assets from time to time.
Tensions en the Middle East have led to selling pressure across the market. While this pressure affects altcoins more, Bitcoin, which is seen as a relatively safer haven, experiences a more limited depreciation en this process. This situation brings an increase en Bitcoin dominance.
Continued institutional buying, strong net inflows into spot Bitcoin ETFs, and the strengthening risk aversion due to heightened geopolitical uncertainties have led capital flows to shift back towards Bitcoin. Accordingly, en the current environment, where market participants maintain cautious positioning and risk appetite remains weak, Bitcoin dominance is expected to consolidate en the range of 63.5%-65.5% next week.
Ethereum Dominance
Source: Tradingview
Weekly Change:
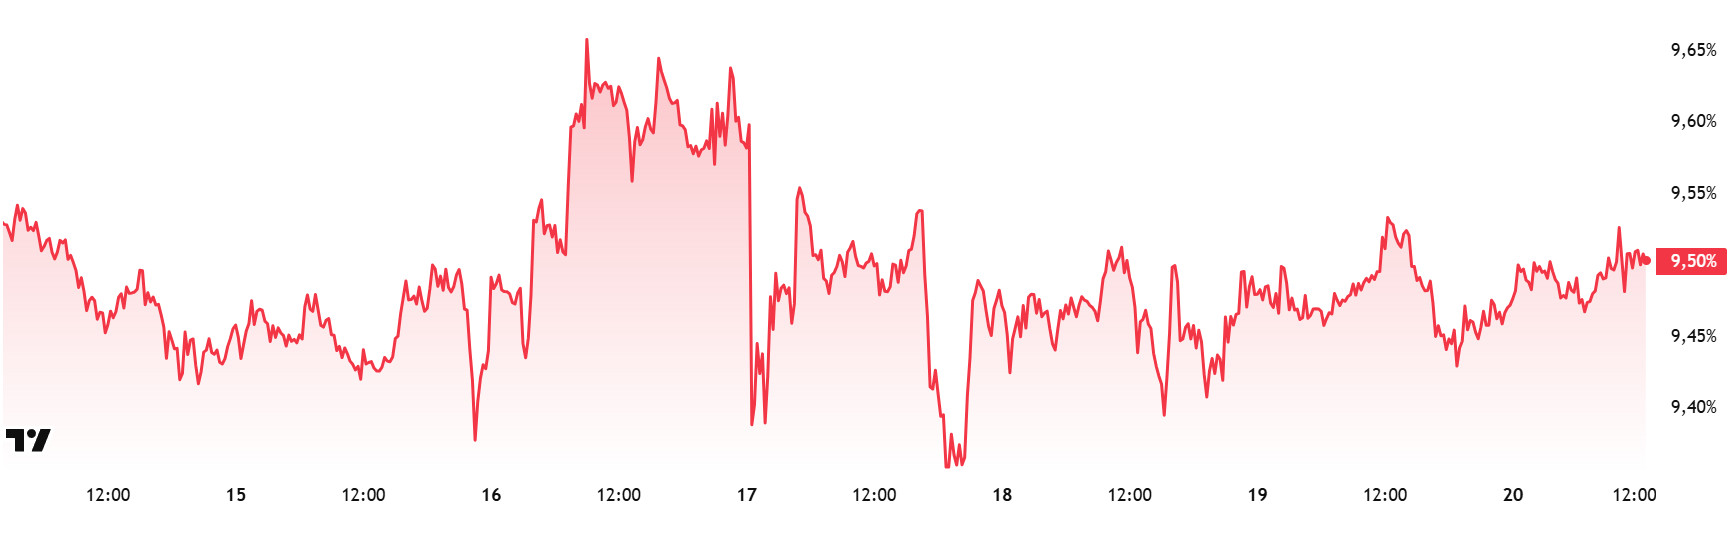
- Last Week’s Level: 9.48%
- This Week’s Level: 9.50%
Ethereum dominance continued its upward trend, which started at around 7% as of April, and reached up to 10% as of last week. However, the dominance, which could not exceed these levels, has generally followed a horizontal course en the last six weeks. In the current week, positive movements were recorded.
In this context, Ethereum dominance ended last week at 9.48% and is currently trading at 9.50%.
In the same period, Bitcoin dominance, similar to Ethereum, displayed a positive outlook and showed an upward trend.
Bitcoin Spot ETF
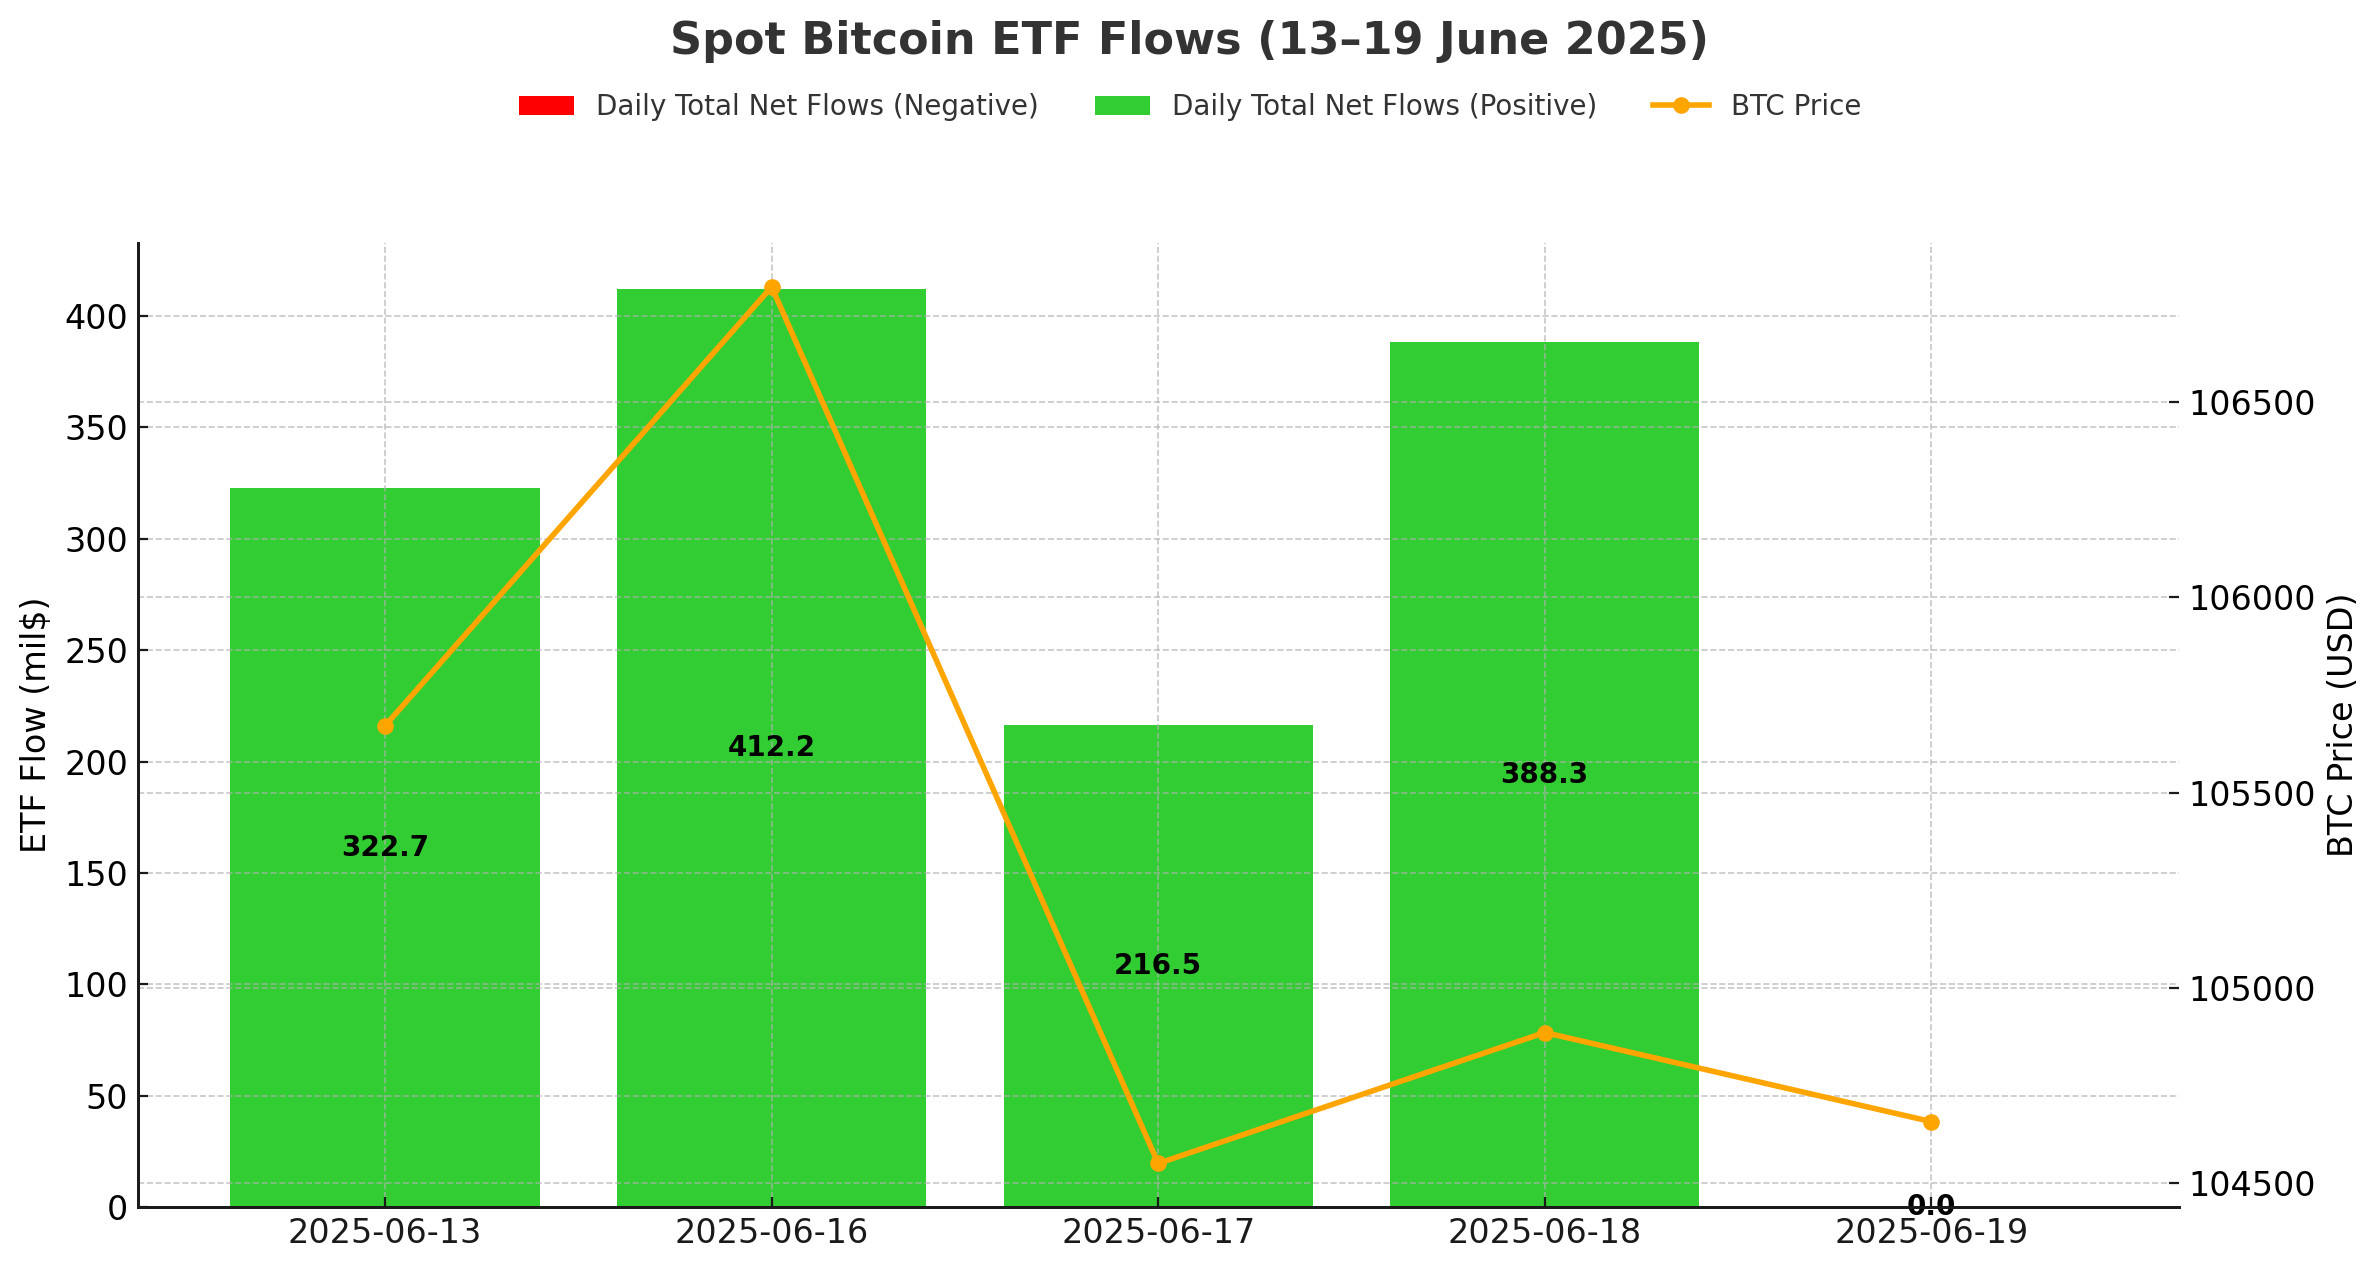
Netflow Status: Between June 13-19, 2025, Spot Bitcoin ETFs saw net inflows totaling $1.34 billion. On June 17, heavy inflows into BlackRock’s IBIT ETF stood out with $639.2 million, while outflows of $208.5 million from the Fidelity FBTC ETF and $191.4 million from the Ark ARKB ETF stood out el the same day. On the other days of the week, steady purchases from IBIT confirmed that institutional interest en the ETF market continued.
Bitcoin Price: Bitcoin, which opened at $105,671 el June 13, closed at $104,658 el June 19, losing 0.96% of its value en the process. While a fluctuating course was observed el a weekly basis, especially the 2.10% drop en Bitcoin price el June 17 caused a cautious stance among investors.
Cumulative Net Inflows: The total cumulative net inflows of spot Bitcoin ETFs reached $46.63 billion as of the end of the 360th trading day.
| DATE | COIN | PRICE | ETF Flow (mil$) | ||
| Open | Close | Change % | |||
| 13-Jun-25 | BTC | 105,671 | 106,066 | 0.37% | 322.7 |
| 16-Jun-25 | 105,594 | 106,794 | 1.14% | 412.2 | |
| 17-Jun-25 | 106,794 | 104,551 | -2.10% | 216.5 | |
| 18-Jun-25 | 104,551 | 104,886 | 0.32% | 388.3 | |
| 19-Jun-25 | 104,886 | 104,658 | -0.22% | 0 | |
| Total for 13 – 19 Jun 25 | -0.96% | 1339.7 | |||
The series of positive net flows en the Spot Bitcoin ETF market between June 13-19, 2025 has reached the eighth day. The continuation of ETF inflows despite the decline en Bitcoin price during this period indicates that investors are maintaining their positions en the long-term perspective. Despite the rising geopolitical tensions, especially en the Middle East, and the uncertainty en global markets, institutional interest remains strong, indicating the persistence of the impact of Spot Bitcoin ETFs el the market. The current data reveals that investors have not lost confidence en Bitcoin.
Ethereum spot ETF
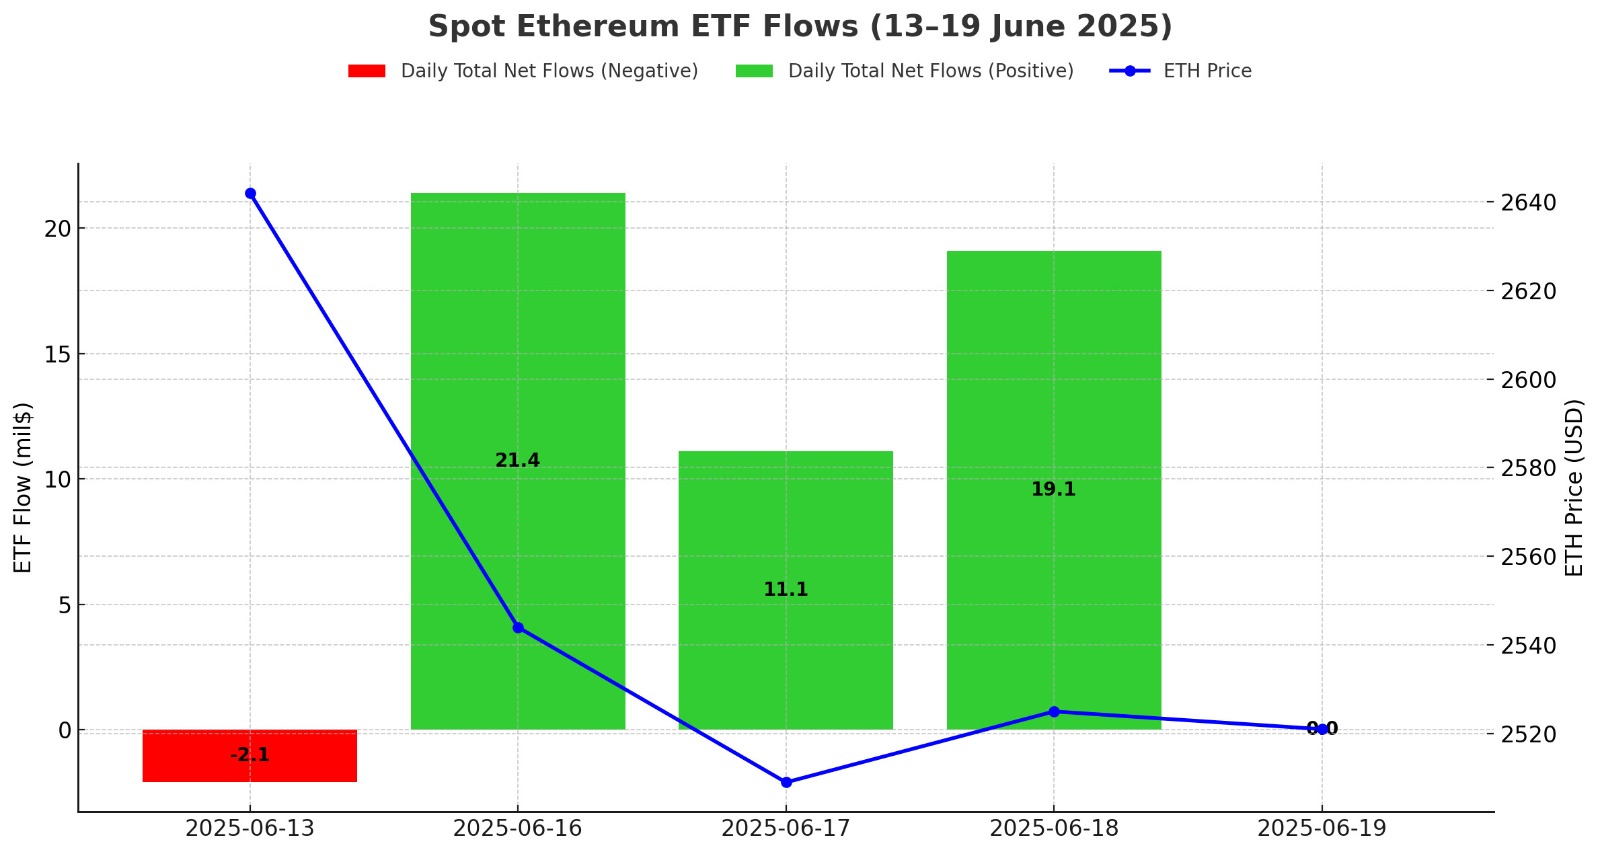
Between June 13-19, 2025, Spot Ethereum ETFs saw a total net inflow of $49.5 million. The strongest inflow of the week was recorded el June 16 with $21.4 million. During this period, inflows of $ 67.9 million into BlackRock’s ETHA ETF stood out, while outflows of $ 23.7 million from Fidelity’s FETH ETF attracted attention. The total cumulative net inflows of Spot Ethereum ETFs at the end of the 228th trading day rose to $3.924 billion. The 13-day positive net flow series ended with a limited outflow of $ 2.1 million el June 13, 2025.
| DATE | COIN | PRICE | ETF Flow (mil$) | ||
| Open | Close | Change % | |||
| 13-Jun-25 | ETH | 2,642 | 2,579 | -2.38% | -2.1 |
| 16-Jun-25 | 2,547 | 2,544 | -0.12% | 21.4 | |
| 17-Jun-25 | 2,544 | 2,509 | -1.38% | 11.1 | |
| 18-Jun-25 | 2,509 | 2,525 | 0.64% | 19.1 | |
| 19-Jun-25 | 2,525 | 2,521 | -0.16% | 0 | |
| Total for 13 – 19 Jun 25 | -4.58% | 49.5 | |||
Between June 13-19, 2025, the price of Ethereum fell por 4.58%, while the Spot Ethereum ETF market witnessed a period en which institutional interest did not weaken but inflow volumes slowed down noticeably. What was noteworthy during this period was the return of positive net flows en Spot Ethereum ETFs, despite increased geopolitical tensions. Between June 16-18, ETFs saw a total net inflow of $51.6 million. This points to the tendency of institutional investors to use short-term price declines as an opportunity. If geopolitical uncertainties diminish or prices flatten en the coming days, it is possible to see strong buying en Spot Ethereum ETFs again.
Bitcoin Options Distribution
Source: Laevitas
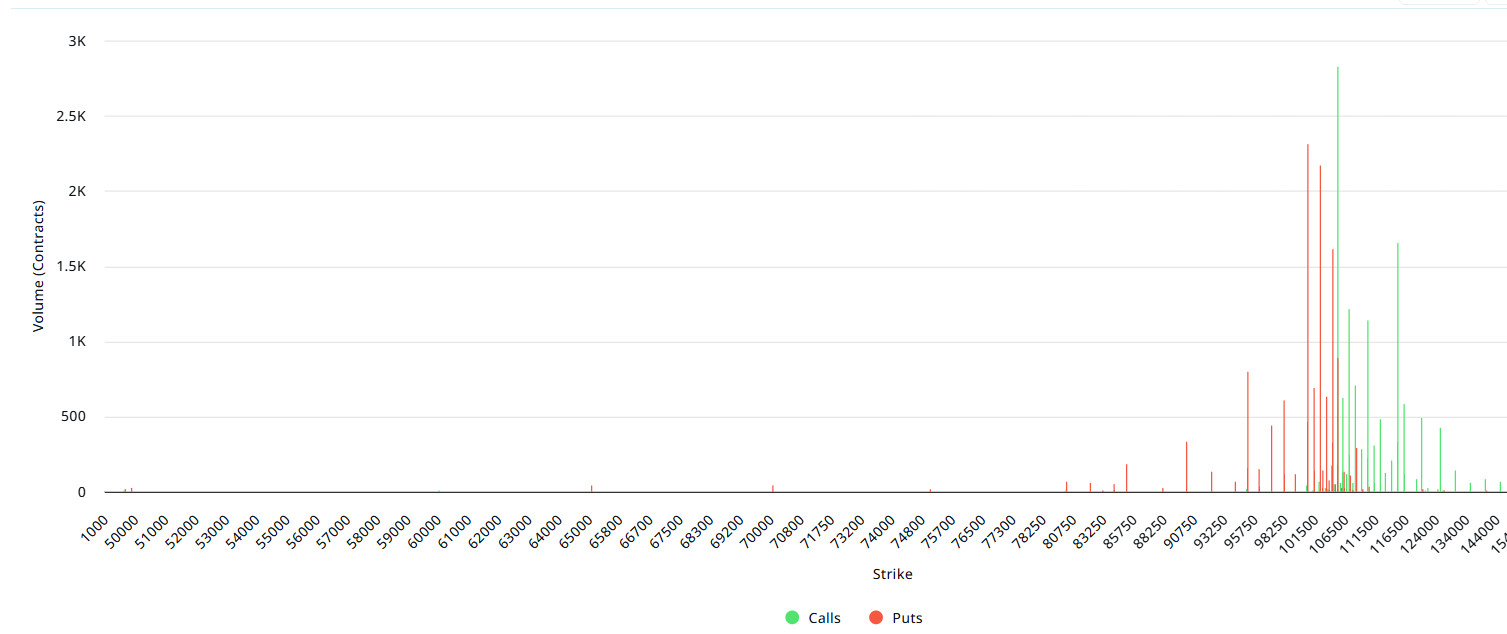
BTC: Notional: $3.3B | Put/Call: 1.16 | Max Pain: $106K
Deribit Data: Deribit data shows that BTC options contracts with a notional value of approximately $3.3 billion expired today. At the same time, according to the data en the last 24 horas, if we look at the risk conversion en the next 1-week period, put options are the dominant side en hedging more than call options. This indicates that the expectation of a decline is increasing. When we look at the expected volatility, it is above the realized volatility. This indicates that call option fees are expensive. On the other hand, the positive spread value shows that investors are acting appetite. Skew values suggest that there is selling pressure today and next week.
Laevitas Data: When we examine the chart, it is seen that put options are concentrated en the band of 95,000 – 105,000 dollars. Call options are concentrated between $103,000 and $125,000 and the concentration decreases towards the upper levels. At the same time, the $ 100,000 level is seen as support and the $ 115,000 level as resistance. On the other hand, there are 2.42K put options at the $ 100,000 level, where there is a peak and there is a decrease en put volume after this level. However, it is seen that 2.82K call option contracts peaked at $ 105,000. When we look at the options market, we see that call and put contracts are en balance el a daily and weekly basis.
Option Expiration:
Put/Call Ratio and Maximum Pain Point: In the last 7 days of data from Laevitas, the number of call options increased por about 15% compared to last week to 77.88K. In contrast, the number of put options increased por 41% compared to last week to 91.52K. The put/call ratio for options was set at 1.16. This indicates that call options are less en demand among investors than put options. Bitcoin’s maximum pain point is seen at $106,000. It can be predicted that BTC is priced at $106,400 and if it does not break the pain point of $106,000 downwards, the rises will continue. In the coming period, there are 1.23K call and 1.36K put options at the time of writing.
Ethereum Options Distribution
Source: Laevitas
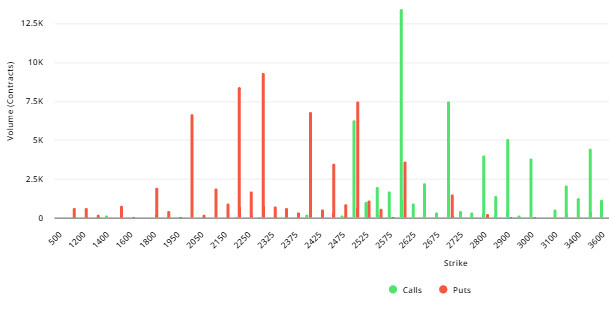
ETH: 546M notional | Put/Call: 0.68 | Max Pain: $2,600
Laevitas Data: Looking at the chart, put options are concentrated between $2,050 and $2,500. The highest volume of put contracts is around 9K at the $2,300 level. This indicates that option market participants see the $2,300 level as a strong support. On the other hand, there is heavy call option volume at the $2,500 and $2,700 levels. Especially $2,600 stands out as a possible resistance zone due to the high volume (13.5K).
Deribit Data: At-the-Money (ATM) volatility rates were 39.14% el June 20, 52.20% el June 21 and 50.01% el June 22. These ratios point to increased short-term price volatility and heightened uncertainty, especially en June 21-22 maturities. Likewise, the negative values and downward trend en the 25 Delta Risk Reversal (RR) data indicate that the market places a higher premium el put options, i.e. it prices downside risks more On the other hand, put volume increased por 37.7% en the June 20 expiry while call volume declined por 34%. Similarly, there is a sharp decline of 53.01% en June 21 call option volume. This suggests that investors are losing faith en the recovery scenario, especially en the short term, while increasing their hedging positions.
Option Expiration:
Ethereum options with a notional value of $546 million expire el June 20. The Max Pain level is calculated at $ 2,600, while the put/call ratio is at 0.68.
LEGAL NOTICE
The investment information, comments and recommendations contained en this document do not constitute investment advisory services. Investment advisory services are provided por authorized institutions el a personal basis, taking into account the risk and return preferences of individuals. The comments and recommendations contained en this document are of a general type. These recommendations may not be suitable for your financial situation and risk and return preferences. Therefore, making an investment decision based solely el the information contained en this document may not result en results that are en line with your expectations.
