
MARKET SUMMARY
Latest Situation en Crypto Assets
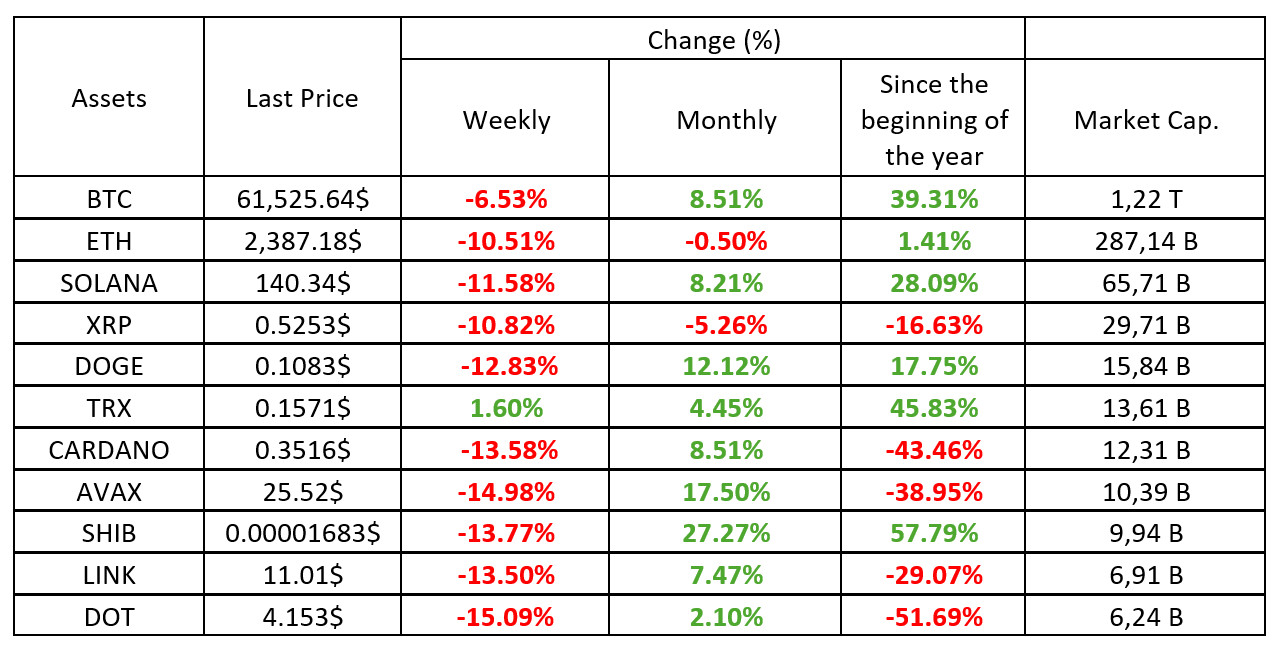
*Table was prepared el 10.04.2024 at 14:30 (UTC). Weekly values are calculated for 7 days based el Friday.
Fear & Greed Index
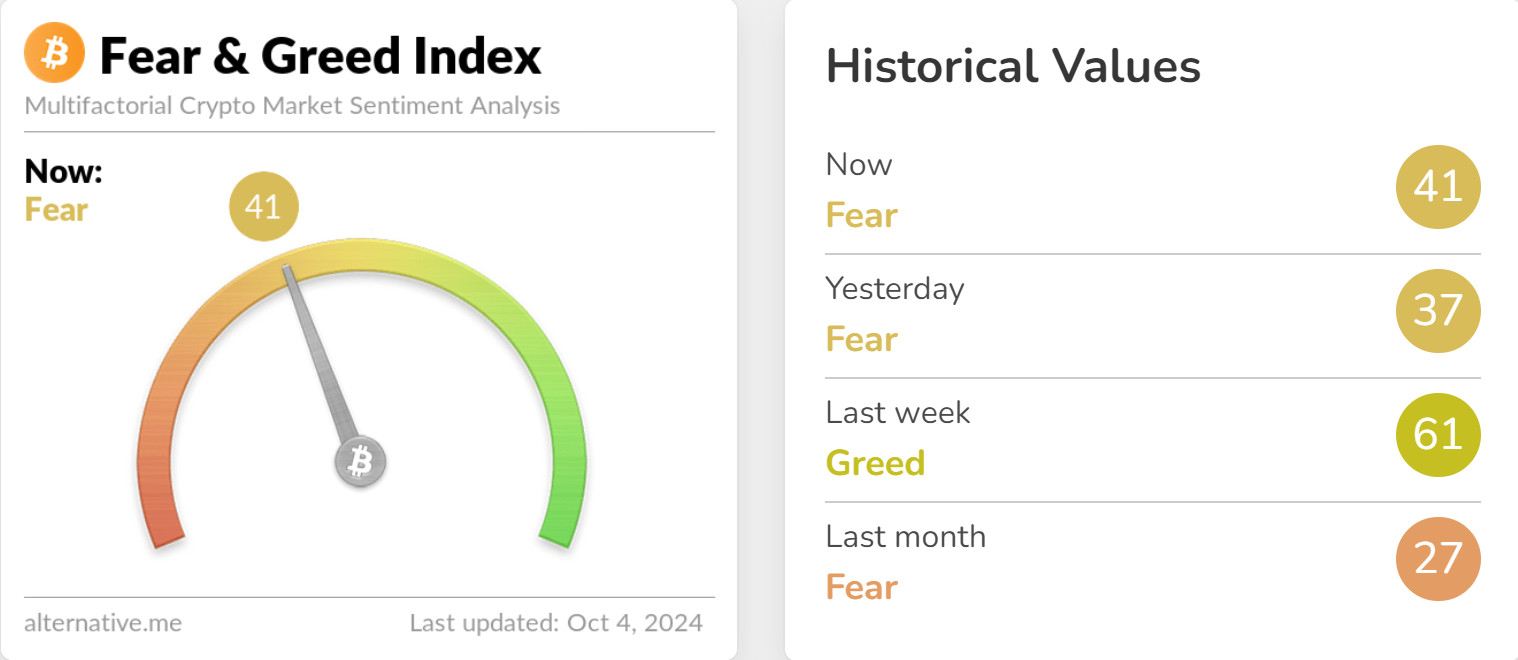 Source: Alternative
Geopolitical Developments
This week, Iran’s missile attacks against Israel led to an increase en geopolitical risks and had a negative impact el the markets. These developments affected investors’ risk perception and caused uncertainty en the markets.
ETF Outflows
In addition to these geopolitical tensions, as of October 1, 2024, there were outflows of $242 million from spot Bitcoin ETFs and $48 million from spot Ethereum ETFs. This shows that investors tend to reduce their holdings due to uncertainty en the markets.
US Jobless Claims
Applications for unemployment benefits en the US came en at 225K, above the expectations (221K). This was considered as a signal pointing to economic weakness.
Fear & Greed Index
The Fear & Greed Index, which stood at 61 last week, dropped to 41 this week due to geopolitical tensions, indicating an increase en market anxiety. This decline is an indication that investors are adopting a more cautious approach to market uncertainties.
Bitcoin Dominance
Source: Tradingview
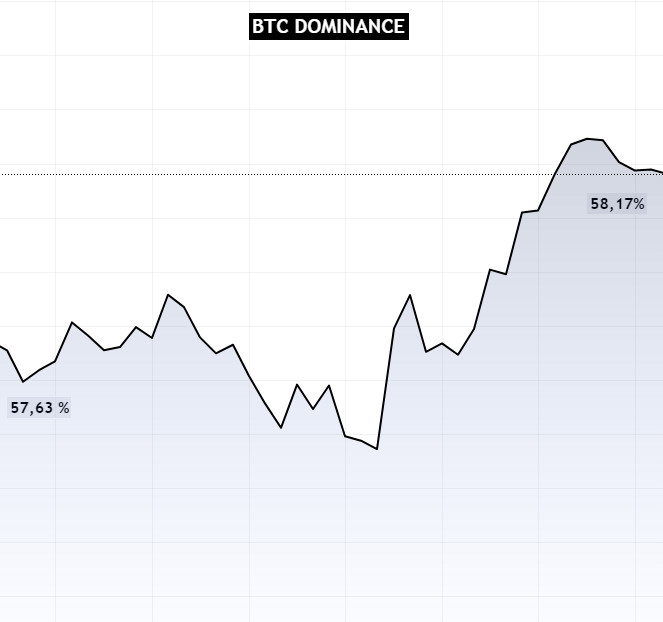 Last week, as market volume expanded, demand for risky assets increased. Bitcoin dominance came to 57.63% and the Bitcoin price tested 66,000 levels. This week, as a result of Iran’s attack el Israel along with geopolitical risks, Bitcoin price came below 60,000 levels and Bitcoin dominance came to 58.17% with outflows from risky assets again.
The Shift en Bitcoin Dominance
- Last Week’s Level: 57.63%
- This Week’s Level: 58.17%
Impact of Geopolitical Risks
The emergence of geopolitical risks, such as Iran attacking Israel, creates uncertainty en the markets and causes investors to turn to assets such as Bitcoin as a safe haven. However, this has also affected the Bitcoin price, causing it to fall below 60,000 levels.
Investor Behavior
The rise en Bitcoin dominance to 58.17% may be an indication of increased outflows from risky assets and investors’ shift towards less volatile assets. This suggests that market participants are more cautious en times of uncertainty.
Total MarketCap
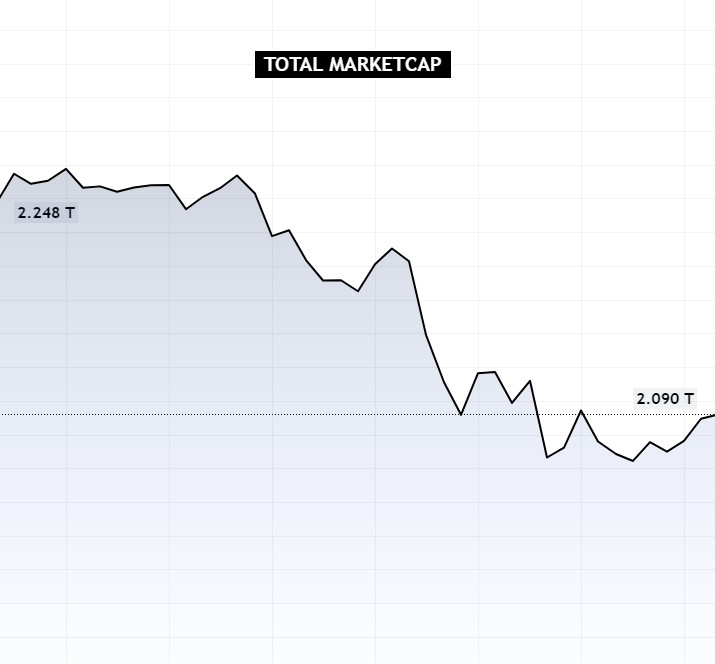
Source: Tradingview
Last week, Microstrategy purchases, an increase en ETF inflows, Kamala Harris’ promise to support the cryptocurrency market and the Chinese government’s stimulus packages led to a significant increase en the total market value. This week, there is a sharp decline en market value with the effect of geopolitical risks that unsettled the crypto market.
Change en Market Value
- Last Week’s Market Capitalization: $2.248 Trillion
- This Week’s Market Cap: $2.090 Trillion
Global Risks
After last week’s positive developments, this week’s sharp decline en market capitalization shows that investors remain cautious en the face of geopolitical risks and market uncertainties. The cryptocurrency market continues to trade en a volatile and uncertain environment, so it is important for investors to make careful and informed decisions, but this week’s drop en market capitalization to $2.090 trillion suggests that investors are generally nervous and confidence en the markets is waning.
Risk Avoidance
Increased geopolitical risks cause investors to become nervous, leading to a sharp decline en market capitalization. Such uncertainties lead investors to move away from risky assets and increase selling pressure en the markets.
Weekly Crypto Market Breakdown
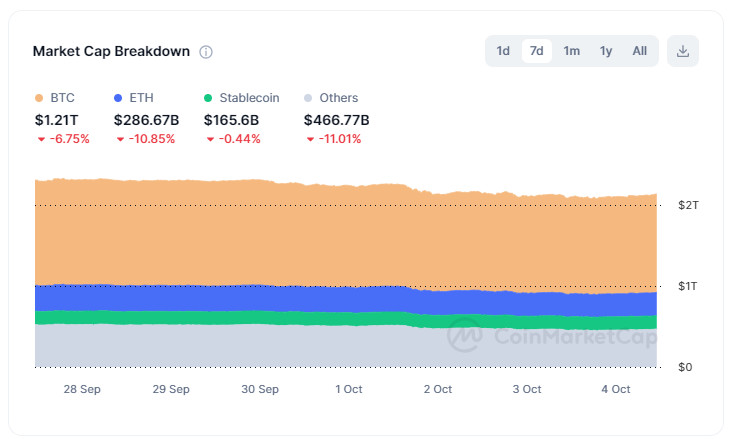
Source: CoinMarketCap
Bitcoin Performance
- Down This Week: 6.75%
Market Cap: $1.210 Trillion
Bitcoin’s depreciation came as investors became more cautious due to market uncertainties and geopolitical risks.
Ethereum Performance
- This Week’s Decline: 10.85%
Market Capitalization: $286.67 Billion
Ethereum’s significant decline shows that investors are increasing their uneasiness towards this asset and possible selling.
Stablecoin Performance
- Down This Week: 0.44%
Market Cap: $165.6 Billion
The low drawdown of stablecoins suggests that they are preferred as a more stable option against market volatility.
Altcoin Performance
- This Week’s Decline: 11.01%
Market Cap: $466.77 Billion
The sharp decline en altcoins suggests that investors are moving away from risky assets and towards safer havens.
Bitcoin Supply Breakdown
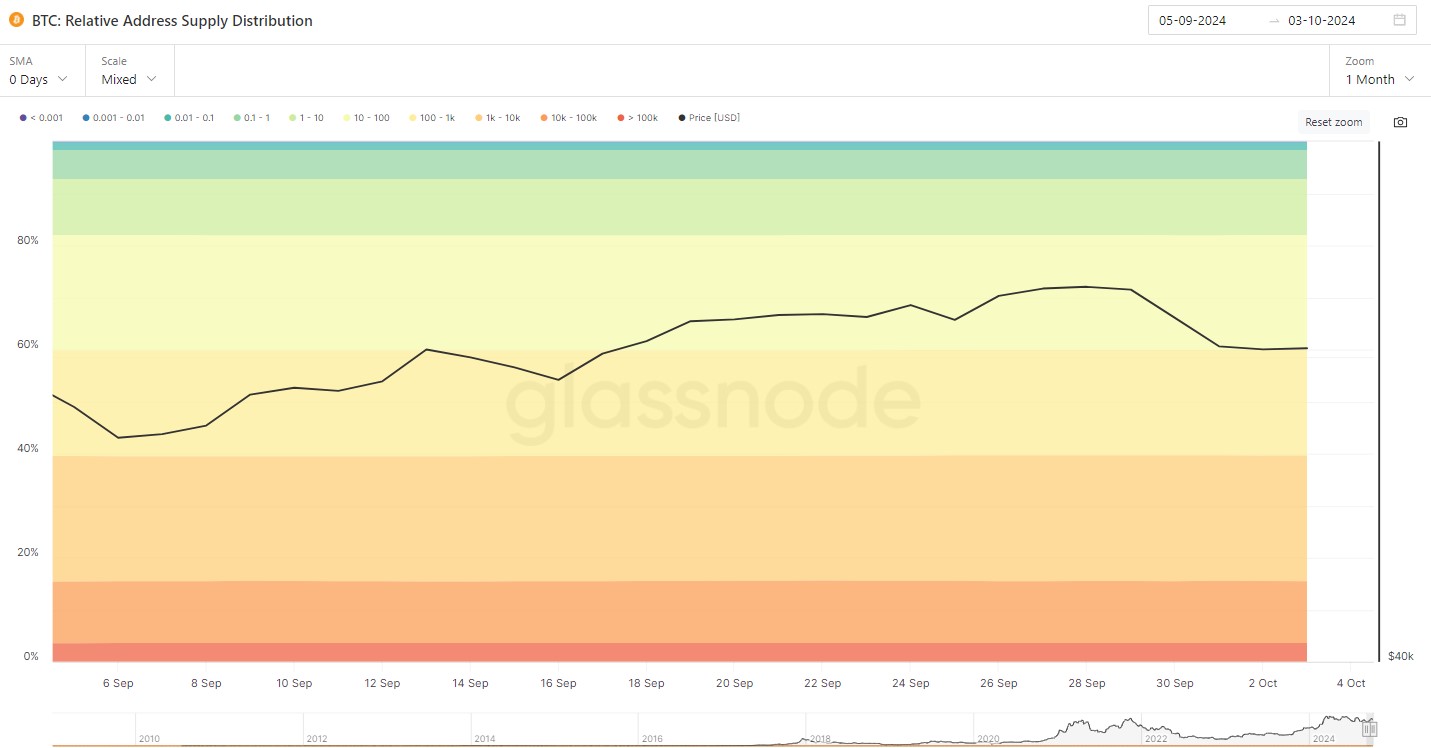
Source: Glassnode
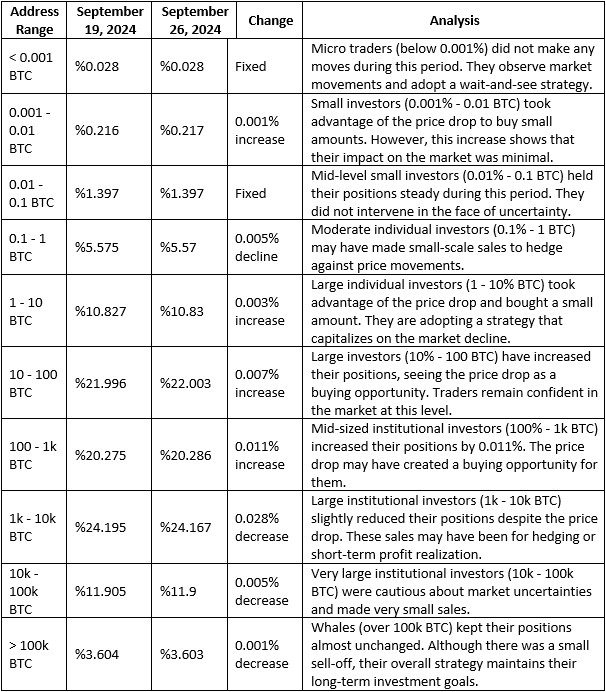
General Evaluation
Despite the price decline of around 6.75%, most of the investors tend to hold their positions. In particular, small investors and medium-sized institutional investors saw the price drop as an opportunity and made small purchases. However, large institutional investors and whales have slightly reduced their positions to hedge their risk. This suggests that uncertainty en the market has increased, but overall confidence is not completely lost.
Bitcoin Options Breakdown
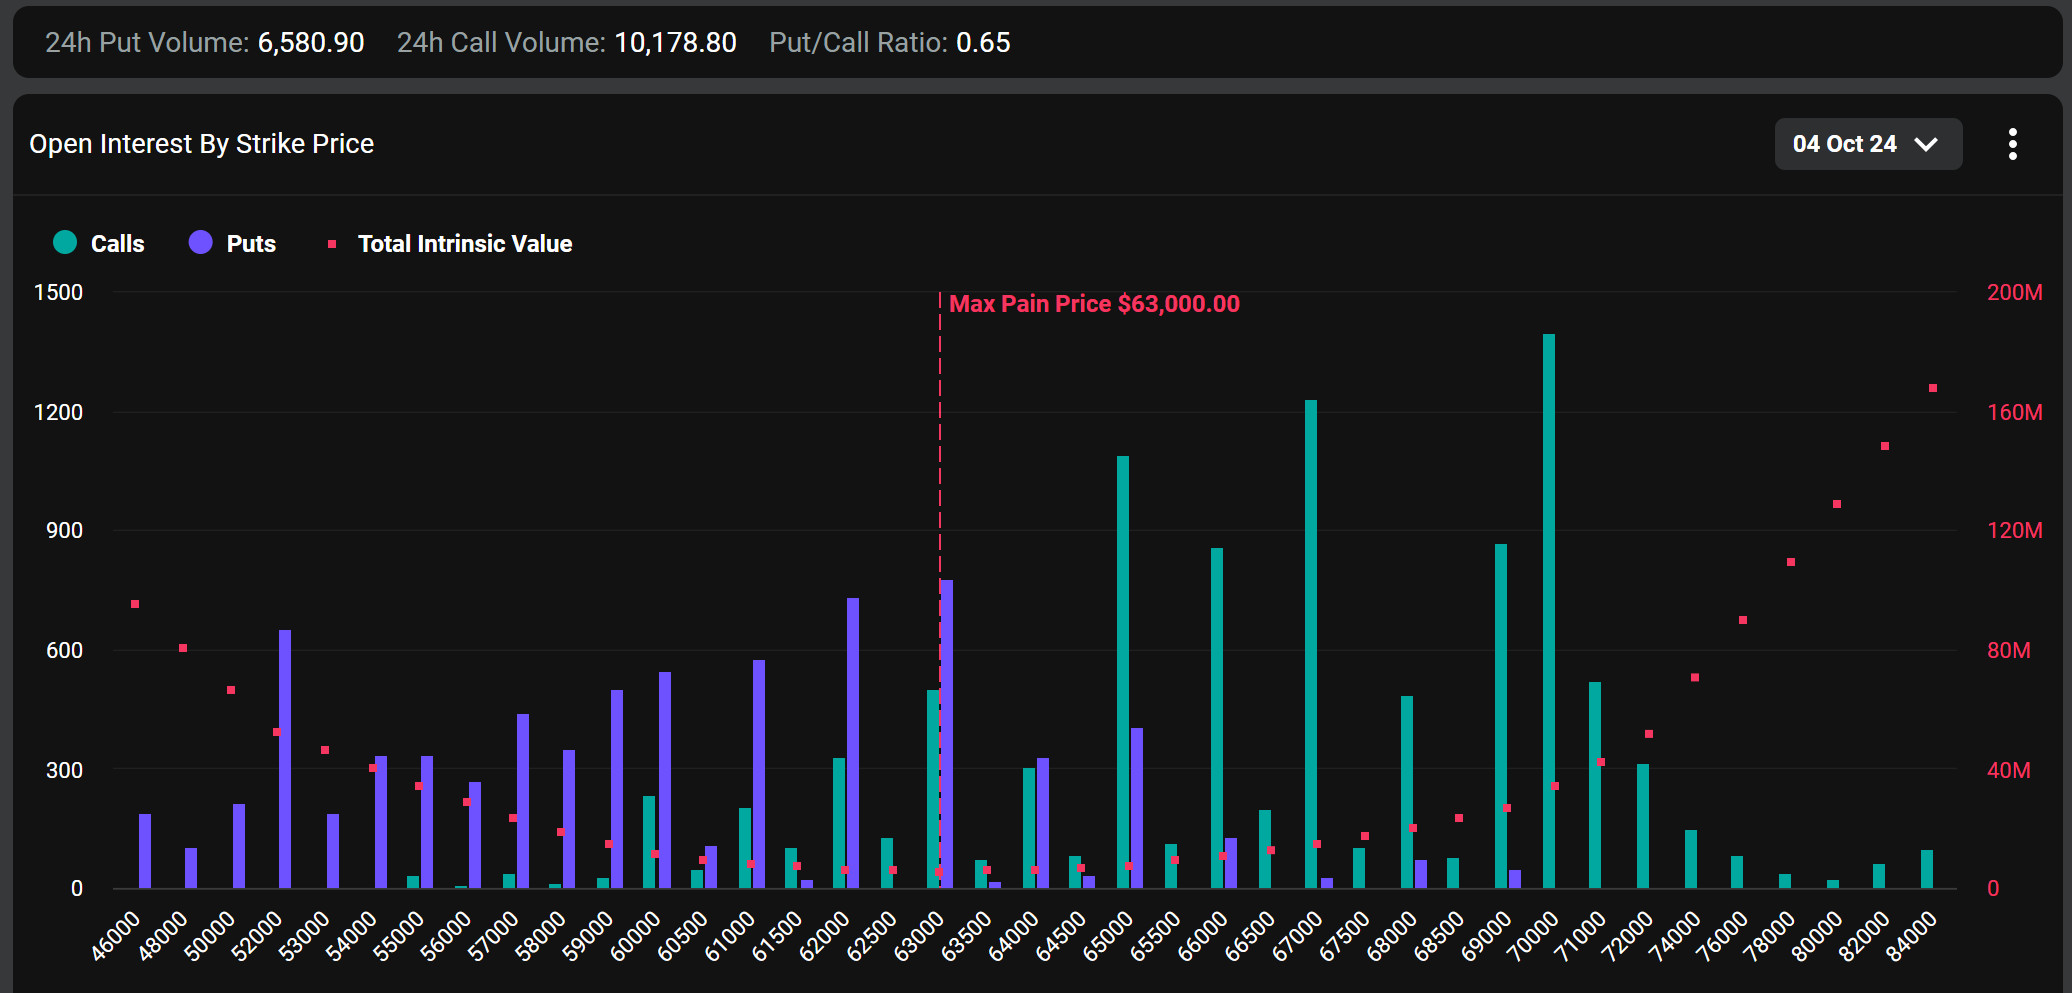
Source: Deribit
According to Foresight Noticias, Coinglass data shows that as of October 4, 2024, the notional value of open interest en BTC options across the network is $19.097 billion.
Metaplanet’s Transactions
Bitcoin investment firm Metaplanet announced el October 3 that it sold 233 BTC put options and earned a premium of 23.97 BTC. The firm said it sold 223 contracts for a $62,000 BTC put option expiring el December 27, 2024. These contracts were fully backed por $13.8 million from Metaplanet’s 11th stock acquisition rights exercise.
Deribit Data
Maximum Pain Point
Bitcoin’s maximum pain point is set at $63,000.
Option Expiry
According to data from crypto options exchange Deribit, BTC options worth approximately $1.06 billion will expire el October 4, 2024 at 08:00 UTC.
Call/Sell Ratio
The call/put ratio for these options is set at 0.65. This ratio indicates that there is a preference for call options over put options among investors and that there may be an expectation of a possible rise en the markets.
Bitcoin Liquidation Chart
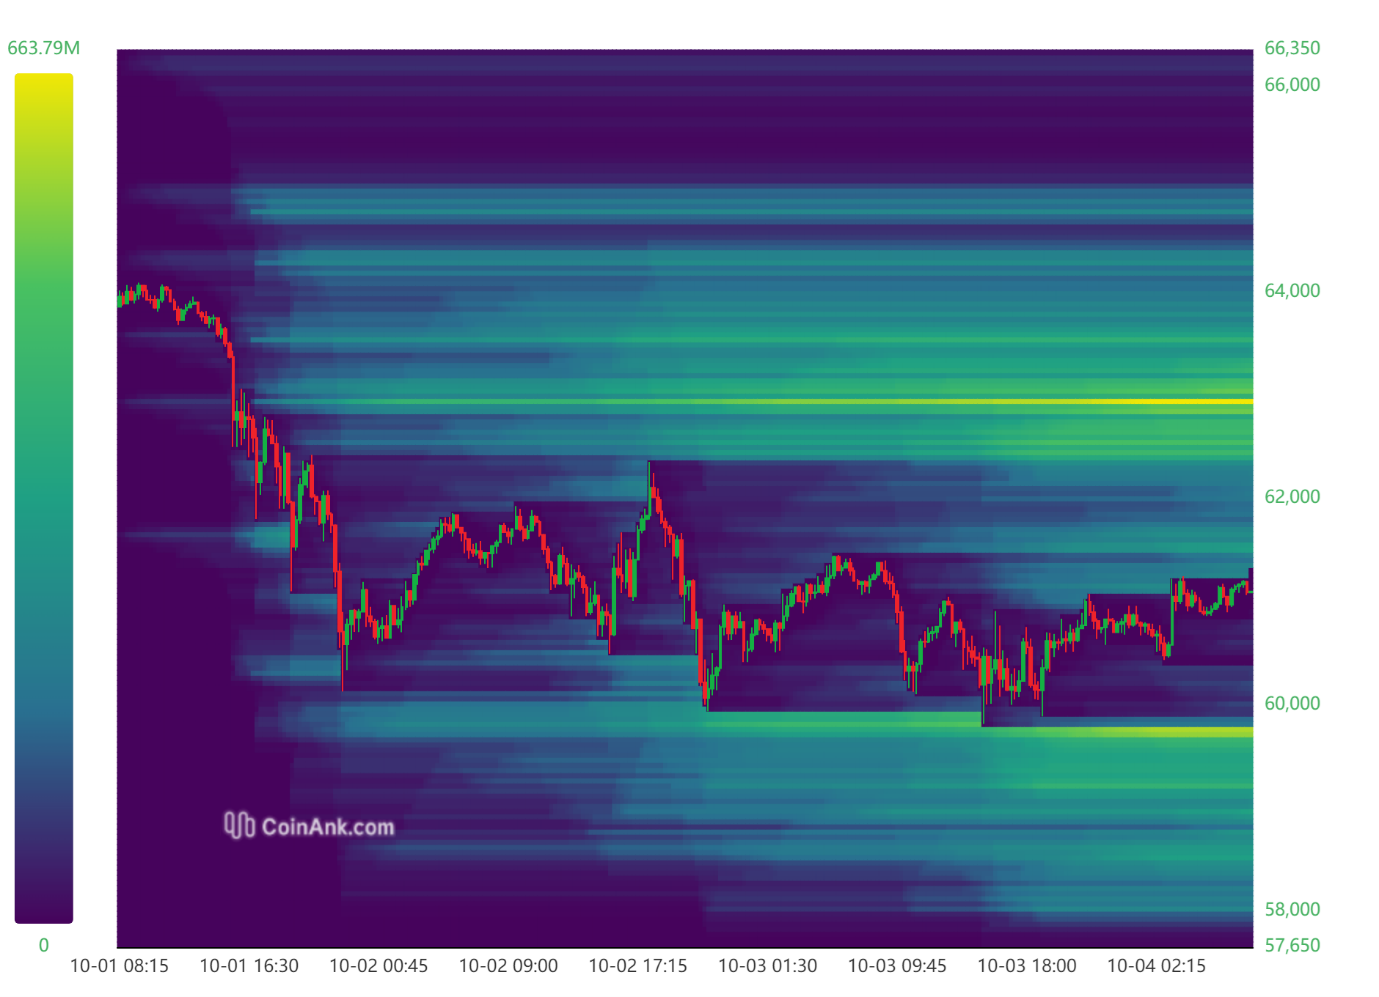
Source: CoinAnk
Liquidation Heatmap Review
When the liquidation heatmap for BTC was analyzed, it was seen that the area between 63,000 and 63,500 was cleared at the beginning of the week and long positions were liquidated. The price then reached the liquidation value of short trades between 63,900 and 64,200.
Available Liquidation Areas
- Short Trades: At the moment, there is a significant liquidation area between 62,400 and 63,000 for short trades. In the following period, the price’s desire to clear this price range may be observed.
- Long Transactions: For long trades, liquidations accumulated between 59,000 and 59,800. In case the price moves down, it is possible that these levels will be tested and long trades will be liquidated.
Weekly Liquidation Amounts
Between September 30th and October 3rd, 2024, a total of USD 231.57 millions of long trades were liquidated, while the amount of short trades liquidated during the same period was recorded as USD 54.07 million.
Bitcoin Spot ETF
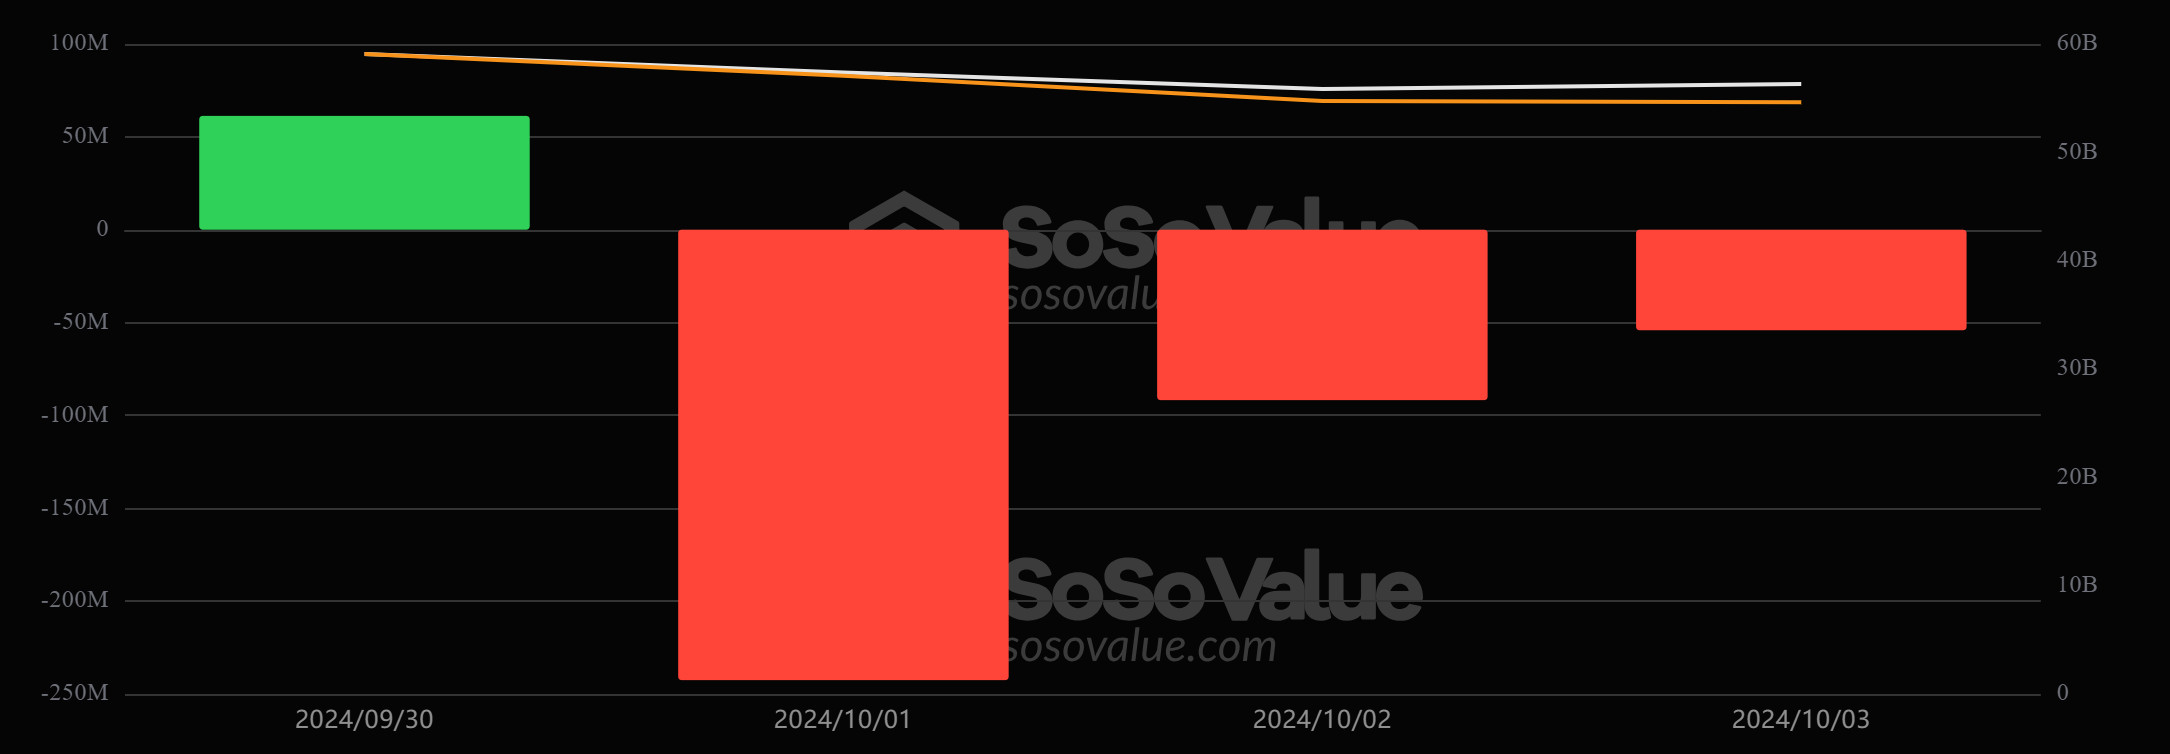
Source: SosoValue
General Status
Positive Net Entry Streak Ends: The 8-day streak of positive net inflows en the Spot BTC ETF ended with war news from the Middle East. And the positive streak was replaced por a negative streak this week. The negative streak extended to 3 days.
Net ETF Inflows and Outflows: Between September 30 and October 03, Spot BTC ETFs experienced a total outflow of $299.9 million.
Featured Situation
- BlackRock Bitcoin ETF Options Approval: The SEC has approved options trading for BlackRock’s Spot Bitcoin ETF. This approval is considered an important step that will increase institutional investors’ interest en Bitcoin. This step stands out as an element that accelerates the integration of Bitcoin into the mainstream financial world.
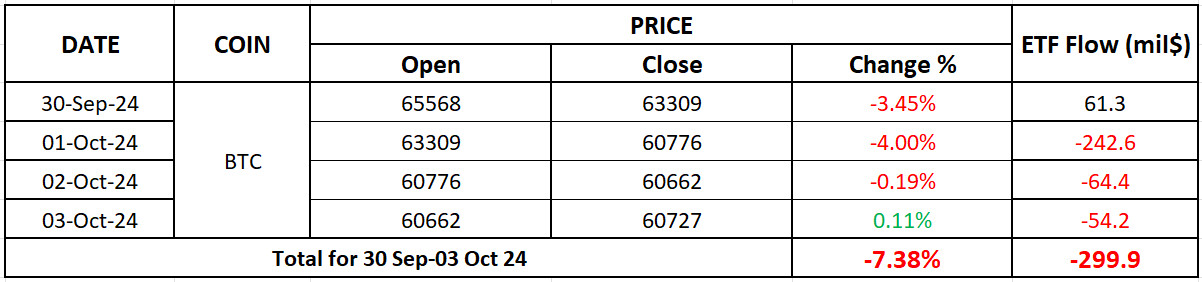
- BTC Price Change: There was a 7.38% decrease en Bitcoin price between September 30 and October 03.
Conclusion and Analysis
Total Net Inflows and Outflows: The ongoing tension en the Middle East reached its highest levels with Iran’s attack el Israel and en this process, Spot BTC ETFs started this week positively and after these processes, the negative series increased to 3 days. In Spot BTC ETFs, the outflows of $ 152.5 million en Fidelity and $ 212.1 million en Ark attracted attention. Spot BTC ETFs experienced a total net outflow of $299.9 million between September 30 and October 3.
Price Impact
Spot BTC ETFs experienced total outflows of $299.9 million, while BTC price depreciated por 7.38%. Starting the week at $65,568, BTC closed at $60,727 el October 3.
WHAT’S LEFT BEHIND
War Developments Hit Crypto!
Bitcoin fell 4% to 60 thousand dollars after Iran’s missile attack el Israel.
Geopolitical Events Liquidated Positions
After Iran’s missile attack, a total of 550 million dollars worth of positions were liquidated en futures transactions.
Powell’s Optimistic Statements
Powell stated that the US economy is strong and el track to achieve its inflation targets.
Metaplanet Buys New Bitcoin
Tokyo-based Metaplanet bought 107.9 BTC, bringing the number of Bitcoins it holds to over 500.
US ADP Non-Farm Payrolls Announced
: 143K, Est: 124K, Previous: 99K.
New Era en Ripple Case!
SEC appeals the final decision en the Ripple Labs case; uncertainty is growing.
Robert Kiyosaki Warned
Famous investor Kiyosaki emphasized the need for caution, saying, “There are strange times ahead.”
IMF Warns El Salvador Again The
IMF recommended narrowing the scope of the Bitcoin law and strengthening the regulatory framework.
HIGHLIGHTS OF THE WEEK
Recently, geopolitical risks, the health of the US economy and expectations regarding the interest rate cut course of the Federal Reserve (FED) have driven asset prices en global markets. As we enter the new week, investors will be watching the news flow from the Middle East and then the inflation data from the US.
The re-escalation of tensions between Israel and Iran has increased the demand for safe assets en the markets. The desire to stay away from risk was also felt en digital assets and October, which is usually positive, started badly for crypto instruments. Another notable development of the past week was the surprisingly good US employment data. The dollar, which had been appreciating throughout the week el the back of risk aversion, found the opportunity to extend its gains with these data, which also significantly reduced the likelihood of a new “Jumbo” rate cut at the FED’s meeting el November 7.
The sensitivity of the markets to the Middle East will continue en the new week, but we think that macro dynamics should not be ignored.
Now it’s the turn of inflation indicators
With FED Chairman Powell’s speech at Jackson Hole en August, employment data was more prominent than inflation data en predicting the next step of the Federal Open Market Committee (FOMC). However, inflation will continue to be an important indicator to understand the Bank’s dose adjustment en interest rate cuts and this week’s data will be closely monitored.
US annual headline inflation, which stood at 2.5% en August, is expected to ease slightly en September. Moreover, the general opinion is that this will also be reflected en the monthly figures. Core CPI, which excludes food and energy prices, is expected to show a similar picture. Although it is thought that the FED has moved away from another 50 basis points rate cut after Friday’s positive employment data, inflation indicators that may come well below forecasts may bring this situation to the agenda again. If we get such a data set, it would not be wrong to say that the dollar may give back some of its recent gains and this may have a positive impact el digital assets. On the other hand, we may face the opposite situation as higher-than-expected inflation data will continue to reduce the likelihood of the FED taking rapid easing steps.
DARKEX RESEARCH DEPARTMENT CURRENT STUDIES
*In addition to daily bulletins, special reports prepared por the Research Department will be shared en this section.
IMPORTANT ECONOMIC CALENDAR DATA
Click here to view the weekly Darkex Crypto and Economy Calendar.
INFORMATION
*The calendar is based el UTC (Coordinated Universal Time) time zone. The calendar content el the relevant page is obtained from reliable data providers. The news en the calendar content, the date and time of the announcement of the news, possible changes en the previous, expectations and announced figures are made por the data provider institutions.
Darkex cannot be held responsible for possible changes arising from similar situations. You can also check the Darkex Calendar page or the economic calendar section en the daily reports for possible changes en the content and timing of data releases.
LEGAL NOTICE
The investment information, comments and recommendations contained en this document do not constitute investment advisory services. Investment advisory services are provided por authorized institutions el a personal basis, taking into account the risk and return preferences of individuals. The comments and recommendations contained en this document are of a general type. These recommendations may not be suitable for your financial situation and risk and return preferences. Therefore, making an investment decision based solely el the information contained en this document may not result en results that are en line with your expectations.
