
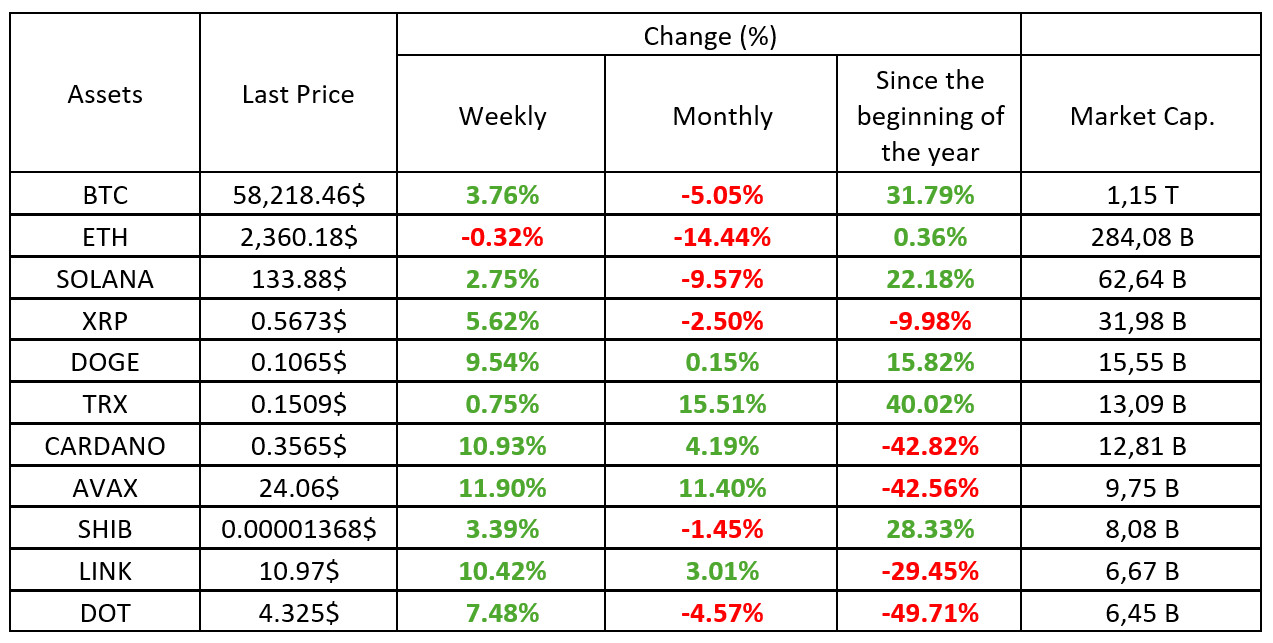
MARKET SUMMARY
Latest Situation en Crypto Assets
MARKET SUMMARY
Latest Situation en Crypto Assets
*Table was prepared el 13.09.2024 at 14:30 (UTC). Weekly values are calculated for 7 days based el Friday.
Fear & Greed Index
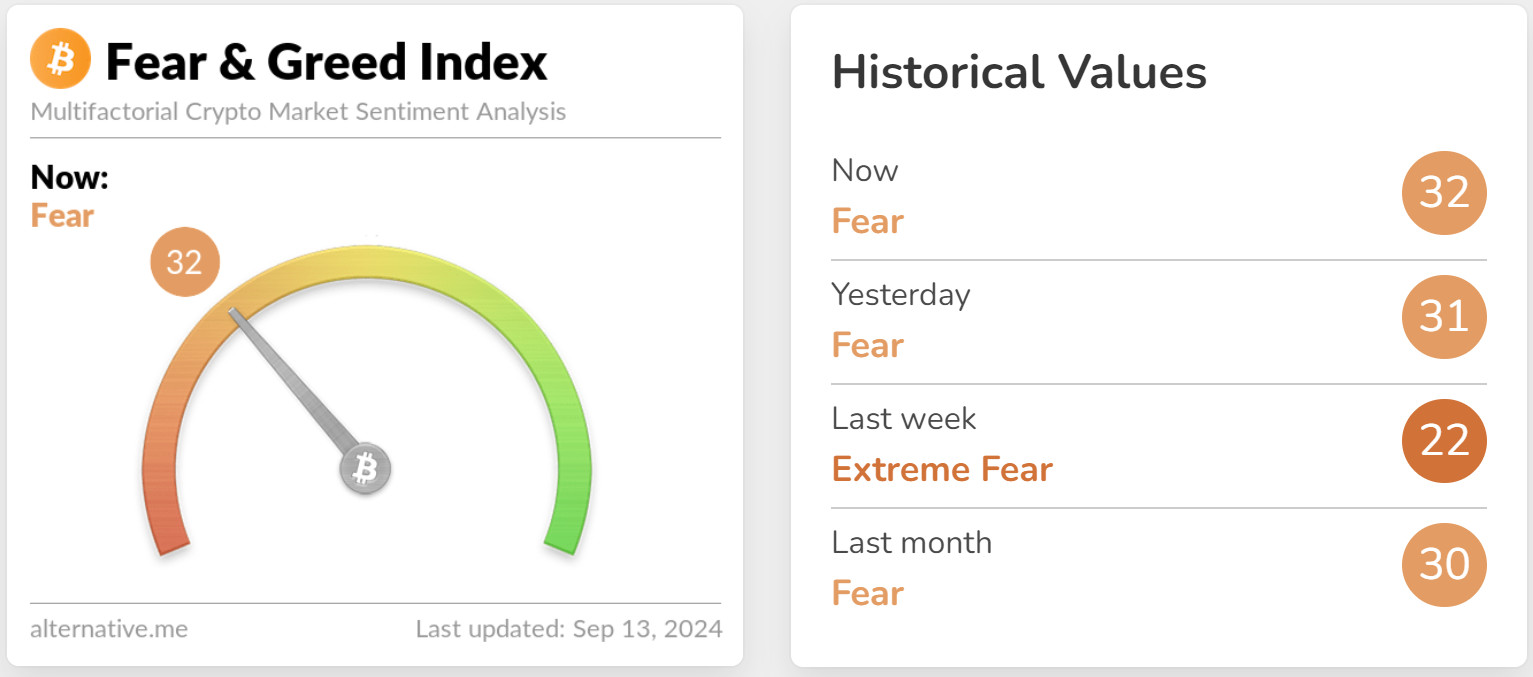 Source: Alternative
The confidence index, which was 22 last week, rose to 32 this week. We can say that this increase shows that the markets are en a more positive mood. The release of the Consumer Price Index (CPI) at 2.5% year-el-year, which is lower than the previous 2.9%, may indicate that inflation is easing, which may have had a positive impact el the markets. In addition, positive Bitcoin Spot ETFs this week, the UK’s bill recognizing cryptocurrencies as personal property and rising expectations for a rate cut por the FED may have supported the increase en the confidence index.
Bitcoin Dominance
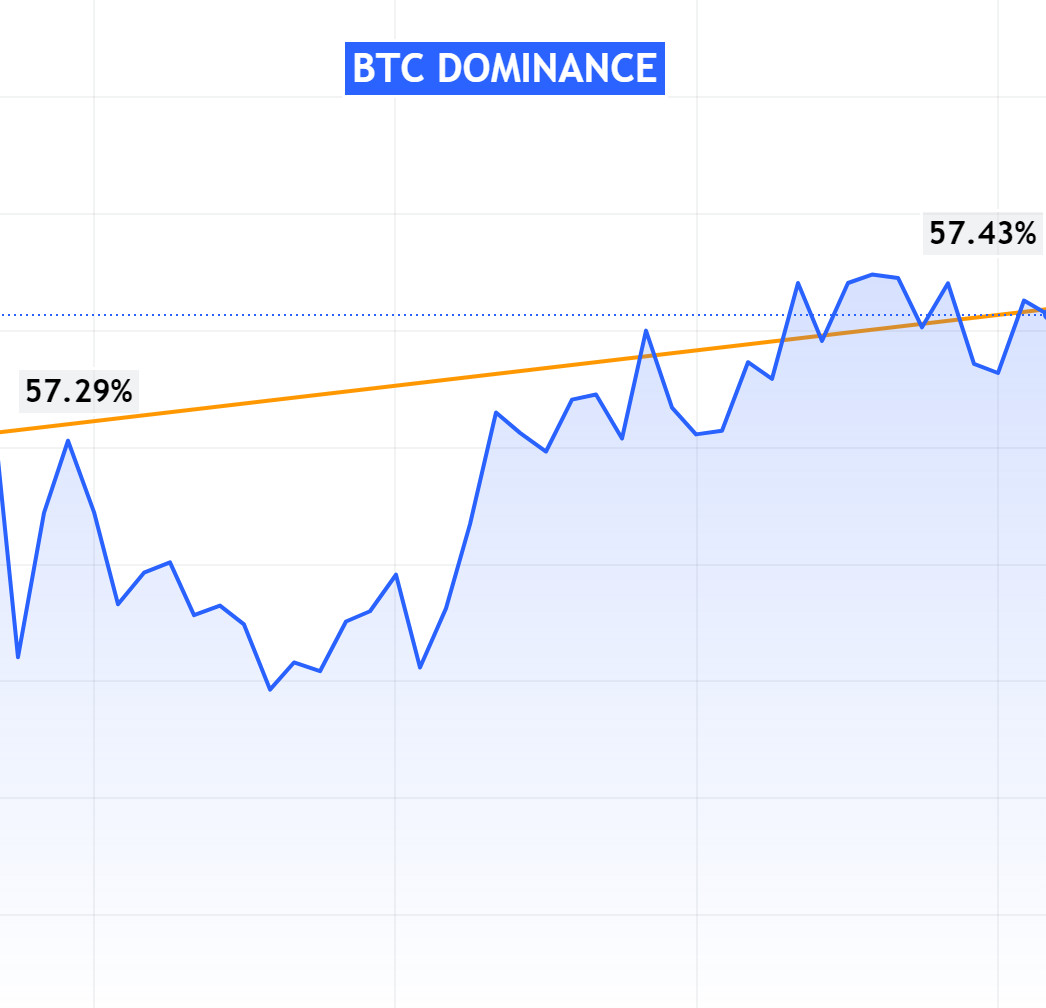
Source: Tradingview
Bitcoin Dominance Report: US Economic Data and Market Impact
While a horizontal band movement was observed en Bitcoin dominance last week, there was a slight increase en Bitcoin dominance this week as inflation and unemployment data released en the US came within expectations. Let’s examine these developments en detail.
The Shift en Bitcoin Dominance
- Last Week’s Level: 57.29
- This Week’s Level: 57.43
This data shows a limited increase en Bitcoin’s dominance over the overall crypto market. But this small rise is important for understanding market dynamics.
US Economic Data and Market Impact
- Inflation and Unemployment Data
US inflation and unemployment rates were within expectations, which had a predictable impact el the market. This means that the monetary policies of the US Federal Reserve (Fed) are pointing to an interest rate cut cycle.
- Shift to Crypto
Economic data within expectations may increase the appetite for risky assets. In this context, Bitcoin continues to stand out as a safe haven for investors. Therefore, this slight rise en the dominance shows the interest of investors en the market en Bitcoin.
The slight rise en Bitcoin dominance could be interpreted as a sign of confidence en the broader market. US economic data coming en line with expectations may have driven investors to more stable and safe-haven assets such as Bitcoin. This small change en dominance suggests that interest en Bitcoin rather than altcoins may continue for some time.
Total MarketCap
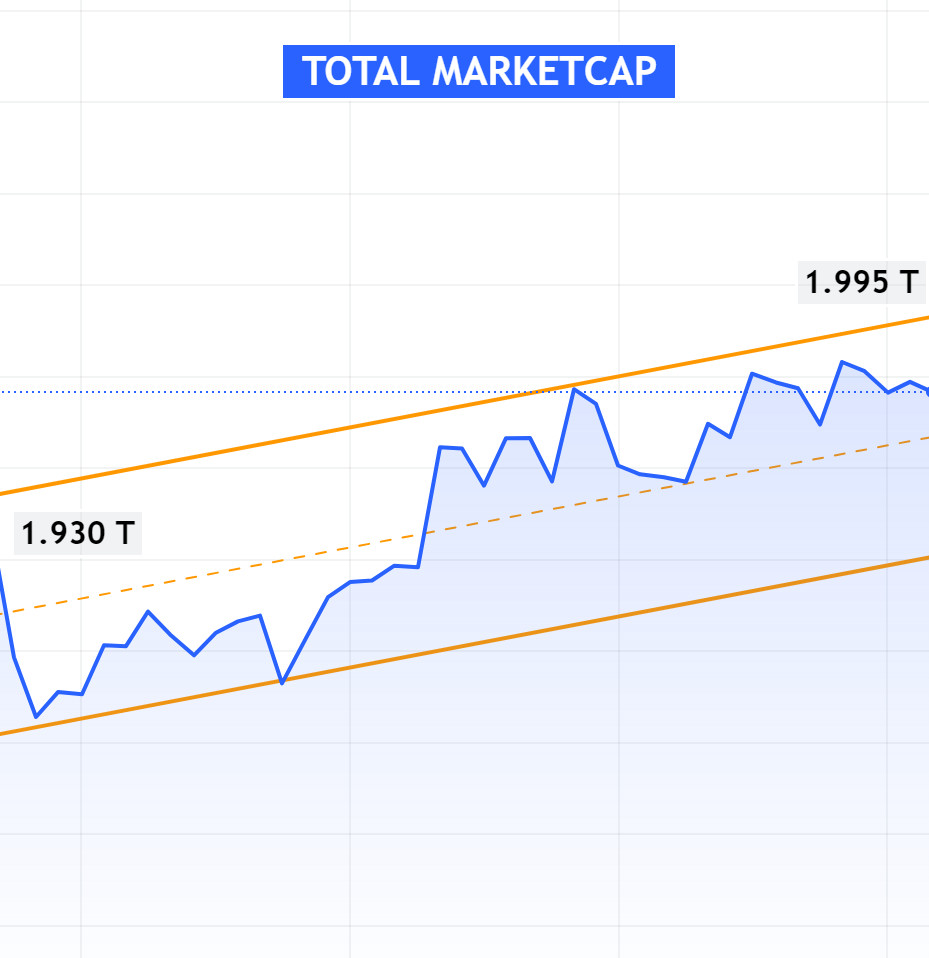
Source: Tradingview
The significant fluctuations observed en the cryptocurrency market last week and the decline en market capitalization attracted the attention of investors. This week, with macroeconomic data en line with expectations, the market recovered and increased en value. Let’s make a detailed evaluation.
Change en Market Value
- Market Capitalization en the Past Week: $1.930 Trillion
- Market Capitalization This Week: $1.995 Trillion
Impact of Macroeconomic Data
Last Week’s Decline
- Market Capitalization: Declined from $2.039 Trillion to $1.930 Trillion
Last week, the cryptocurrency market experienced significant volatility. The market capitalization fell from $2.039 trillion to $1.930 trillion, a decrease of nearly 5%. This sharp drop had a negative impact el the market and created uncertainty among investors.
This Week’s Recovery
Market Capitalization: $1.995 Trillion
This week, macroeconomic data came en line with expectations, leading to some improvement en the market. Total market capitalization rose to $1.995 trillion, recovering from the previous week’s lows. This recovery suggests that investor confidence has partially returned and the market is starting to move en a more stable environment.
Weekly Crypto Market Breakdown
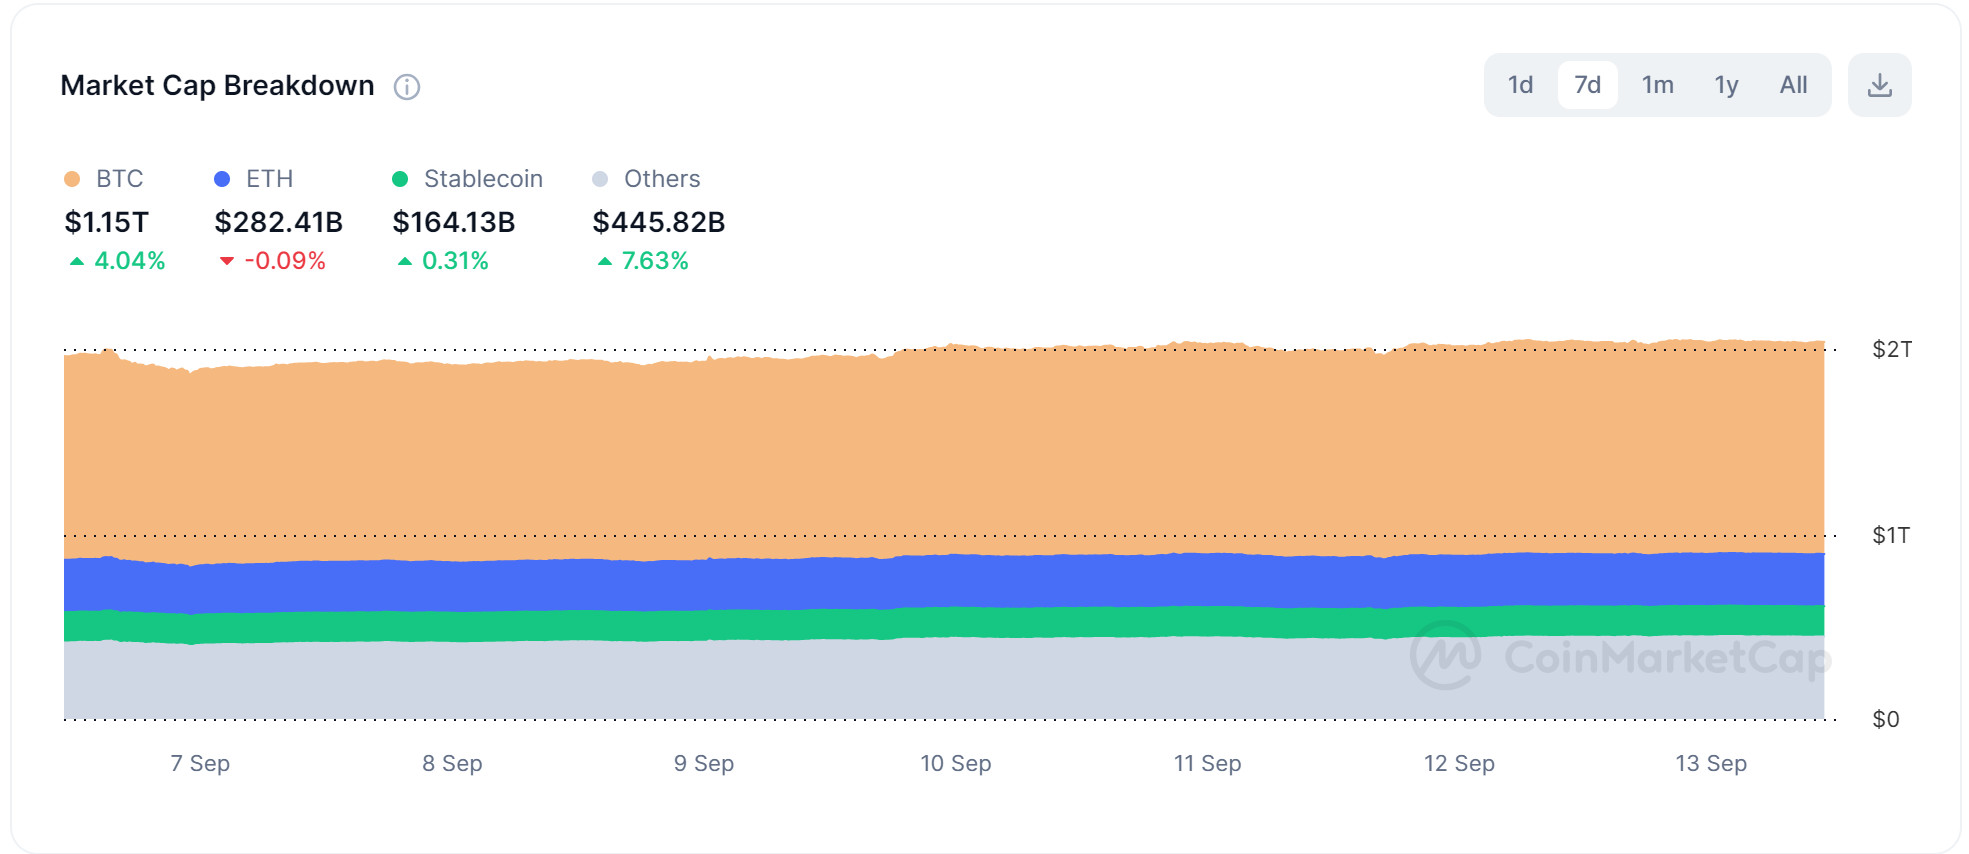
Source: CoinMarketCap
Bitcoin Performance
- Increase This Week: 4.04
- Market Cap: $1.150 Trillion
This week, Bitcoin’s market capitalization increased por 4.04% to $1.150 trillion. Bitcoin’s strong performance contributed significantly to the overall market recovery and demonstrated growing investor confidence.
Ethereum Performance
- Depreciation This Week: 0.09
- Market Cap: $282.41 Billion
Ethereum lost 0.09% el the week, bringing its market capitalization to $282.41 billion. Ethereum’s small depreciation was relatively limited compared to the performance of other assets.
Stablecoin Performance
- Increase This Week: 0.31
- Market Capitalization: $164.13 Billion
Stablecoins have gained 0.31% this week. This indicates that stablecoins continue to remain almost stable and are showing resilience to market fluctuations.
Altcoin Performance
- Increase this Week: 7.63
- Market Capitalization: $445.82 Billion
Altcoins experienced a weekly gain of 7.63%, bringing the total market capitalization to $445.82 billion. This high performance of altcoins shows that diversification en the crypto market is increasing and investors are turning to different assets.
Bitcoin Supply Distribution
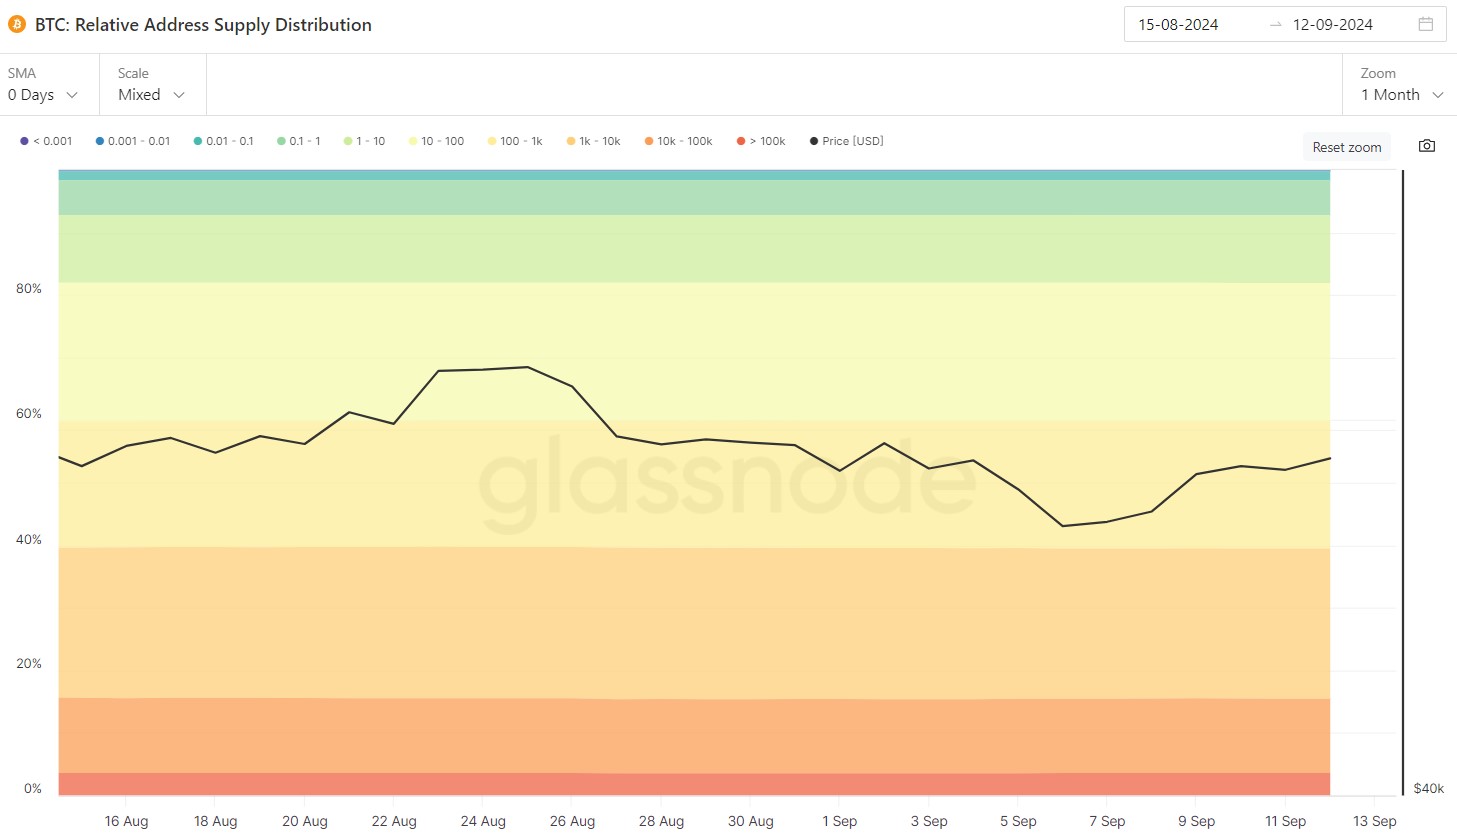
Source: Glassnode
Table with changes and analysis of address groups
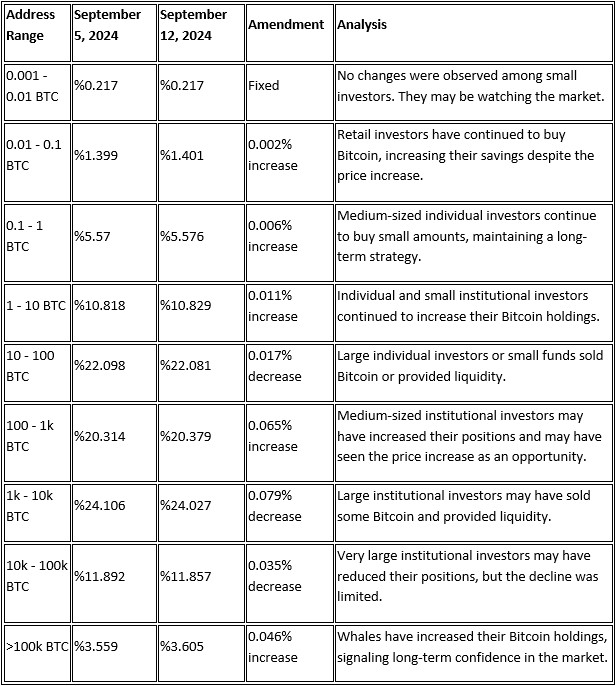
Conclusion/Evaluation
There was an increase en Bitcoin accumulation among small and medium-sized investors, while there was partial selling among large investors, especially en the 1k – 10k BTC range. Whales continued to increase their Bitcoin holdings, suggesting that their impact el the market could be significant. The price increase has prompted small investors to accumulate more, while profit realization or liquidity movements have been observed among large investors.
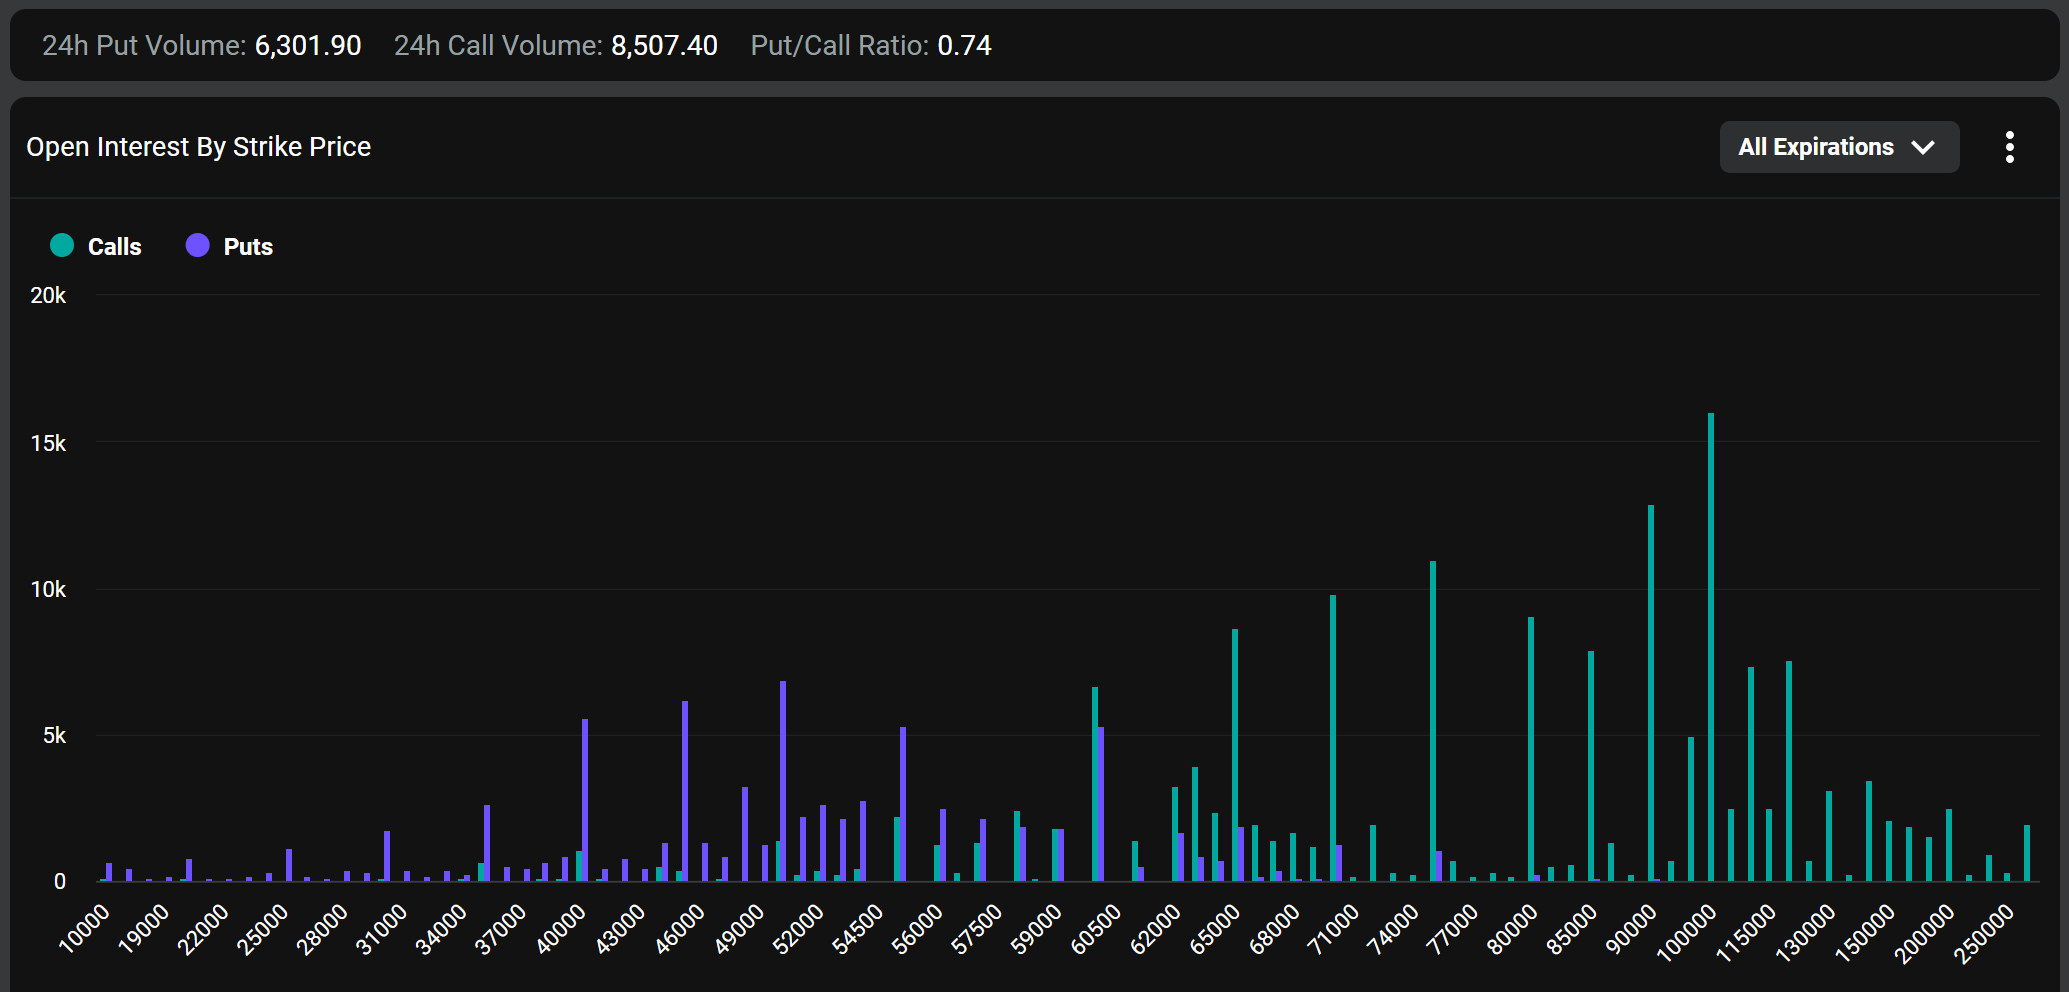
Bitcoin Options Breakdown
Deribit Data
Maximum Pain Point: According to data from Deribit, Bitcoin’s maximum pain point is set at $57,500. Although these levels may attract the market, price movements may deviate depending el general market conditions.
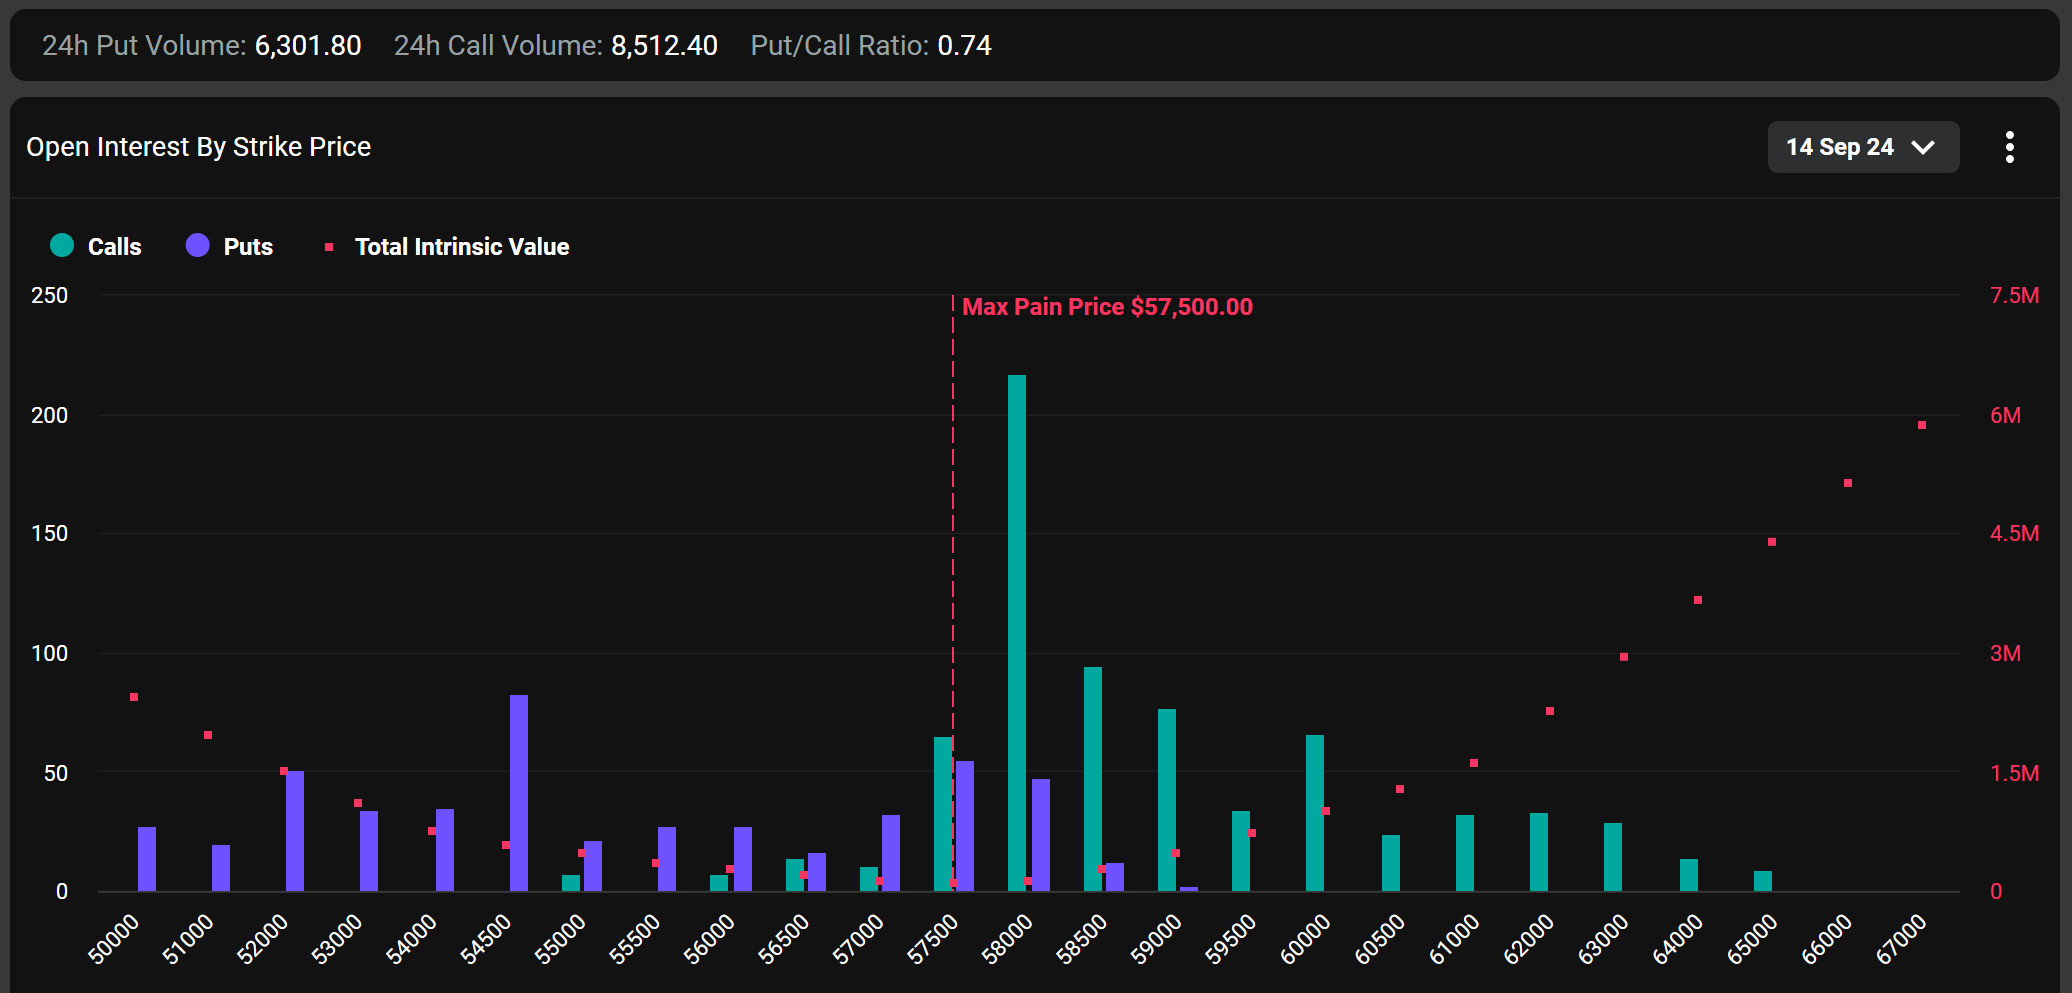
Source: Coinglass
Option Expiry: About 23,000 Bitcoin options contracts worth $1.34 billion expired el Deribit today. This slightly increased volatility at the expiry event. Today’s options expiry was nearly double the size of last week’s expiry event.
Call/Sell Ratio: The call/put ratio for these options is set at 0.74. A call/put ratio of 0.74 indicates that there is a preference for call options over put options among investors and a possible rise en the markets.
Source: Deribit
Bitcoin Liquidation Chart
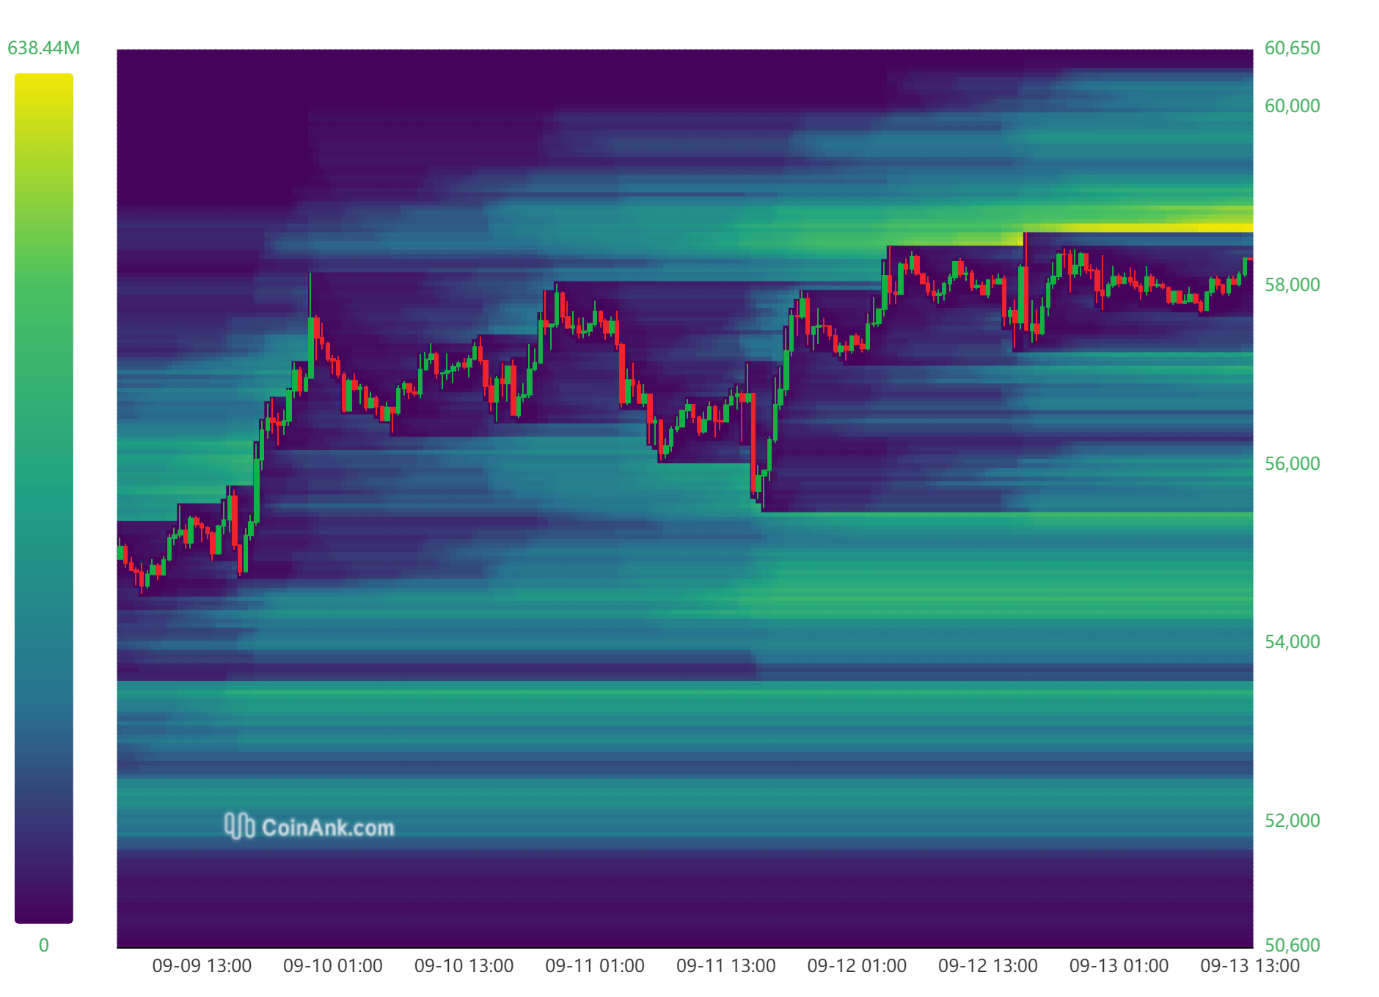
Source: CoinAnk
When BTC’s liquidation heat map was analysed at the beginning of the week, it was seen that short positions were liquidated por moving between 55,400 and 57,400 levels. This area was cleared and shorts were mostly closed. However, the subsequent downward movement of the price caused longs between 55,400 and 56,000 to reach liquidation levels. This led to serious losses en long positions.
Current Liquidation Risk Areas
- Short Trades: There is a significant short liquidation zone between 58,600 and 58,900. BTC may rally towards these price levels to clear this area.
- Long Trades: Between 54,300 and 55,500, there is a significant accumulation of long liquidation. When BTC’s downward movement reaches these levels, the risk of liquidation of long trades increases.
Weekly Liquidation Amounts (September 9-12)
- Long Liquidation Amount: $55.08 million
A total of $55.08 million worth of long positions were liquidated due to price movements. This was particularly evident during the downward movement of BTC’s price. - Short Liquidation Amount: $89.95 million
In the same period, a total of $89.95 million was liquidated from short trades. With BTC’s upward movement, short positions were closed quickly.
Bitcoin Spot ETF
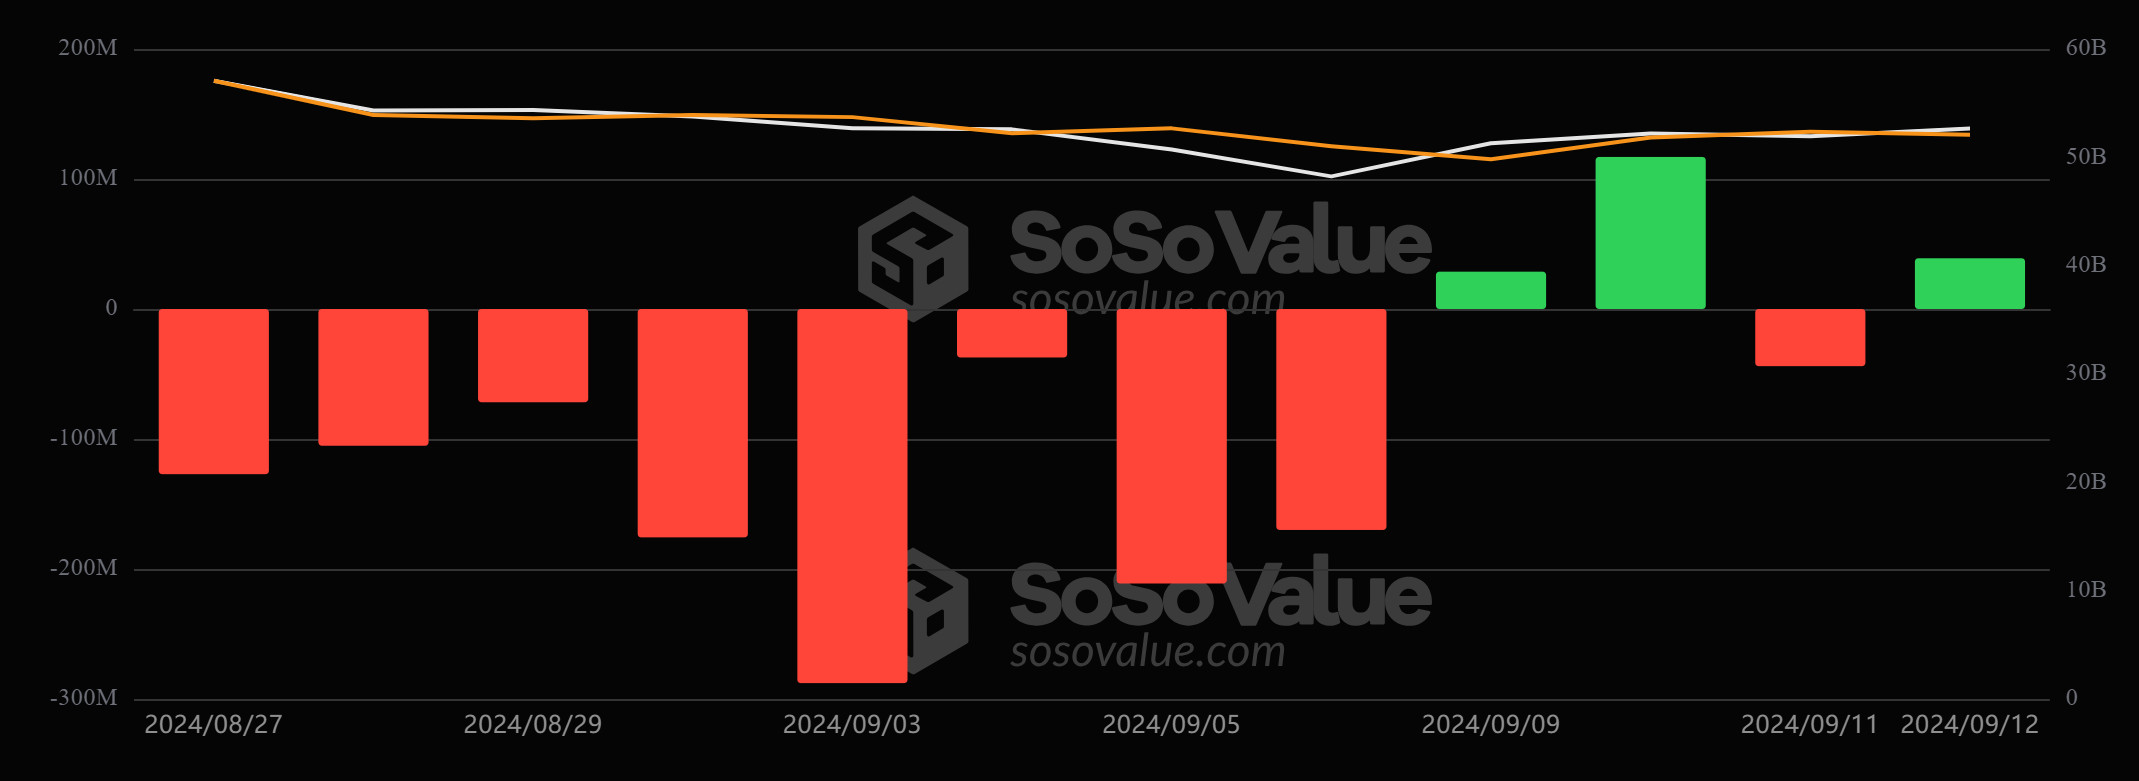 Source: SosoValue
General Status:
Negative Net Entry Streak Ends: The 8-day negative streak el the Spot BTC ETF since August 27 ended el September 9.
Featured Situation
- Blackrock IBIT ETF: The Blackrock IBIT ETF, which contributed to the positive net inflows en spot BTC ETFs, saw a net outflow of $9.1 million el September 9, following a net outflow of $13.5 million el August 29.
Final Performance
- Total Net Inflows: Spot BTC ETFs saw a total net inflow of $140.7 million between September 09-12.
- BTC Price: There was a 5.94% increase en the Bitcoin price during the time period en question.
Conclusion and Analysis
Total Net Inflows: Spot BTC ETFs saw positive inflows after an 8-day negative streak. In general, net inflows after the negative streak were below average. This shows that investors are also cautious about net inflows after a negative streak.
Price Impact: The end of the negative streak en spot BTC ETFs and the positive net inflows el September 9-12 also led to a rise en BTC price. The rise en BTC price may have psychologically driven investors to invest en ETFs.
WHAT’S LEFT BEHIND
Bitcoin Price Rises Above $58K el Market Optimism
Bitcoin’s price rallies el favorable market conditions, surpassing the $58,000 level.
Goldman Sachs: Fed Más Likely to Cut Rate por 25 Basis Points
The expectation of a Fed rate cut is becoming an important factor en determining the direction of the markets.
Donald Trump Promises to Make America the World Center of Cryptocurrency and Bitcoin
Trump’s promise to make the US a crypto hub holds great potential for the markets and signals that the regulatory environment could change.
Russian President Putin Speaks About Bitcoin (BTC) Mining
Putin’s statements emphasize Russia’s leadership en Bitcoin mining while seeking a balance between concerns over energy use and economic impacts.
Bitcoin’s Fate Depends el Trump: Bernstein Analysts
Analysts predict that Trump’s election victory could significantly impact Bitcoin prices, creating a great deal of uncertainty en the markets.
Bitcoin and Ethereum ETFs See Net Outflows
Net outflows from ETFs signal uncertainty among investors and put negative pressure el the market.
CryptoQuant: Bitcoin Signals Bullish Signals Amid Dwindling Reserves
Dwindling reserves el Bitcoin exchanges point to a potential price increase and offer the possibility of opportunity for investors.
Tether and Tron Partner Against Crypto Crime
Tether and Tron’s partnership to fight crypto crime stands out as a step against security concerns en the industry.
The Ethereum Foundation is Selling ETH en the New Week
The Ethereum Foundation’s continued sale of ETH is causing unease en the ecosystem and among investors.
Critical Bitcoin and Ethereum Expiry! September 13 for $1.61 Billion
The big expiry event el Deribit has the potential to create volatility en crypto markets.
Harris to Debate Trump, Again Doesn’t Include Crypto
The absence of cryptocurrencies en the Trump-Harris debate calls into question the place of digital assets en political debates.
Japanese Company Metaplanet Buys Another 38.46 Bitcoin
Bitcoin purchases por Japan-based company Metaplanet show that companies continue to show interest en crypto.
HIGHLIGHTS OF THE WEEK
All Eyes el the Fed
The week that global markets have been eagerly waiting for has finally arrived. There is only one question el the minds of all investors; “How many basis points will the FED cut interest rates?” The answer to this question became uncertain again el the last day of the past week. The fact that Dudley, one of the former FED officials, underlined the possibility of a 50 basis points rate cut at a conference he attended, caused investors to stay between 25 and 50 basis points rate cuts. However, after the latest inflation data, the belief en a 25 basis point cut had increased.
The Federal Open Market Committee (FOMC) meeting, which has the potential to be the most important development of recent times, will be completed el September 18. After the Jackson Hole meeting, where Chairman Powell stated that interest rate cuts should start, the markets were convinced that the FED would start an interest rate cut cycle. However, we can say that the markets could not reach a consensus el the dosage. The FOMC decisions will put an end to this open issue.
According to CME FedWatch, at the time of writing, markets had a 47% chance of a 50 basis point rate cut and a 53% chance of a 25 basis point cut. For an FOMC meeting to take place so soon, these odds are indeed indicative of uncertainty. Therefore, when the decision is announced el Wednesday evening, we will probably see a sharp increase en volatility en all markets.
Markets will first focus el the interest rate decision el Wednesday evening. The only thing we can comfortably say is that a rate cut of more than 50 basis points could have a positive impact el digital assets. However, it is difficult to give a clear direction en these two scenarios, as we are likely to witness the volatility created por indecisive markets en the 50 and 25 basis point cuts. Nevertheless, under the assumption that there are those who are pricing en a 50 basis point cut, we can state that if a 25 basis point cut comes, it may cause a rise en the dollar and a decline en crypto assets.
In addition to the interest rate decision, markets will be watching the FOMC’s economic projections and the “dot plot” chart where members share their expectations el the level of interest rates en the coming period. Then the press conference of FED Chairman Powell will be followed. Here, too, markets will try to get information about the dose of the next rate cuts.
It will be a critical turning point for digital assets en the short term. FOMC decisions, interest rate expectations and Powell’s sentences will be extremely important. The critical issue will be the rate at which interest rates will be cut and the messages to be received el the pace of interest rate cuts en the next meetings.
TECHNICAL ANALYSIS
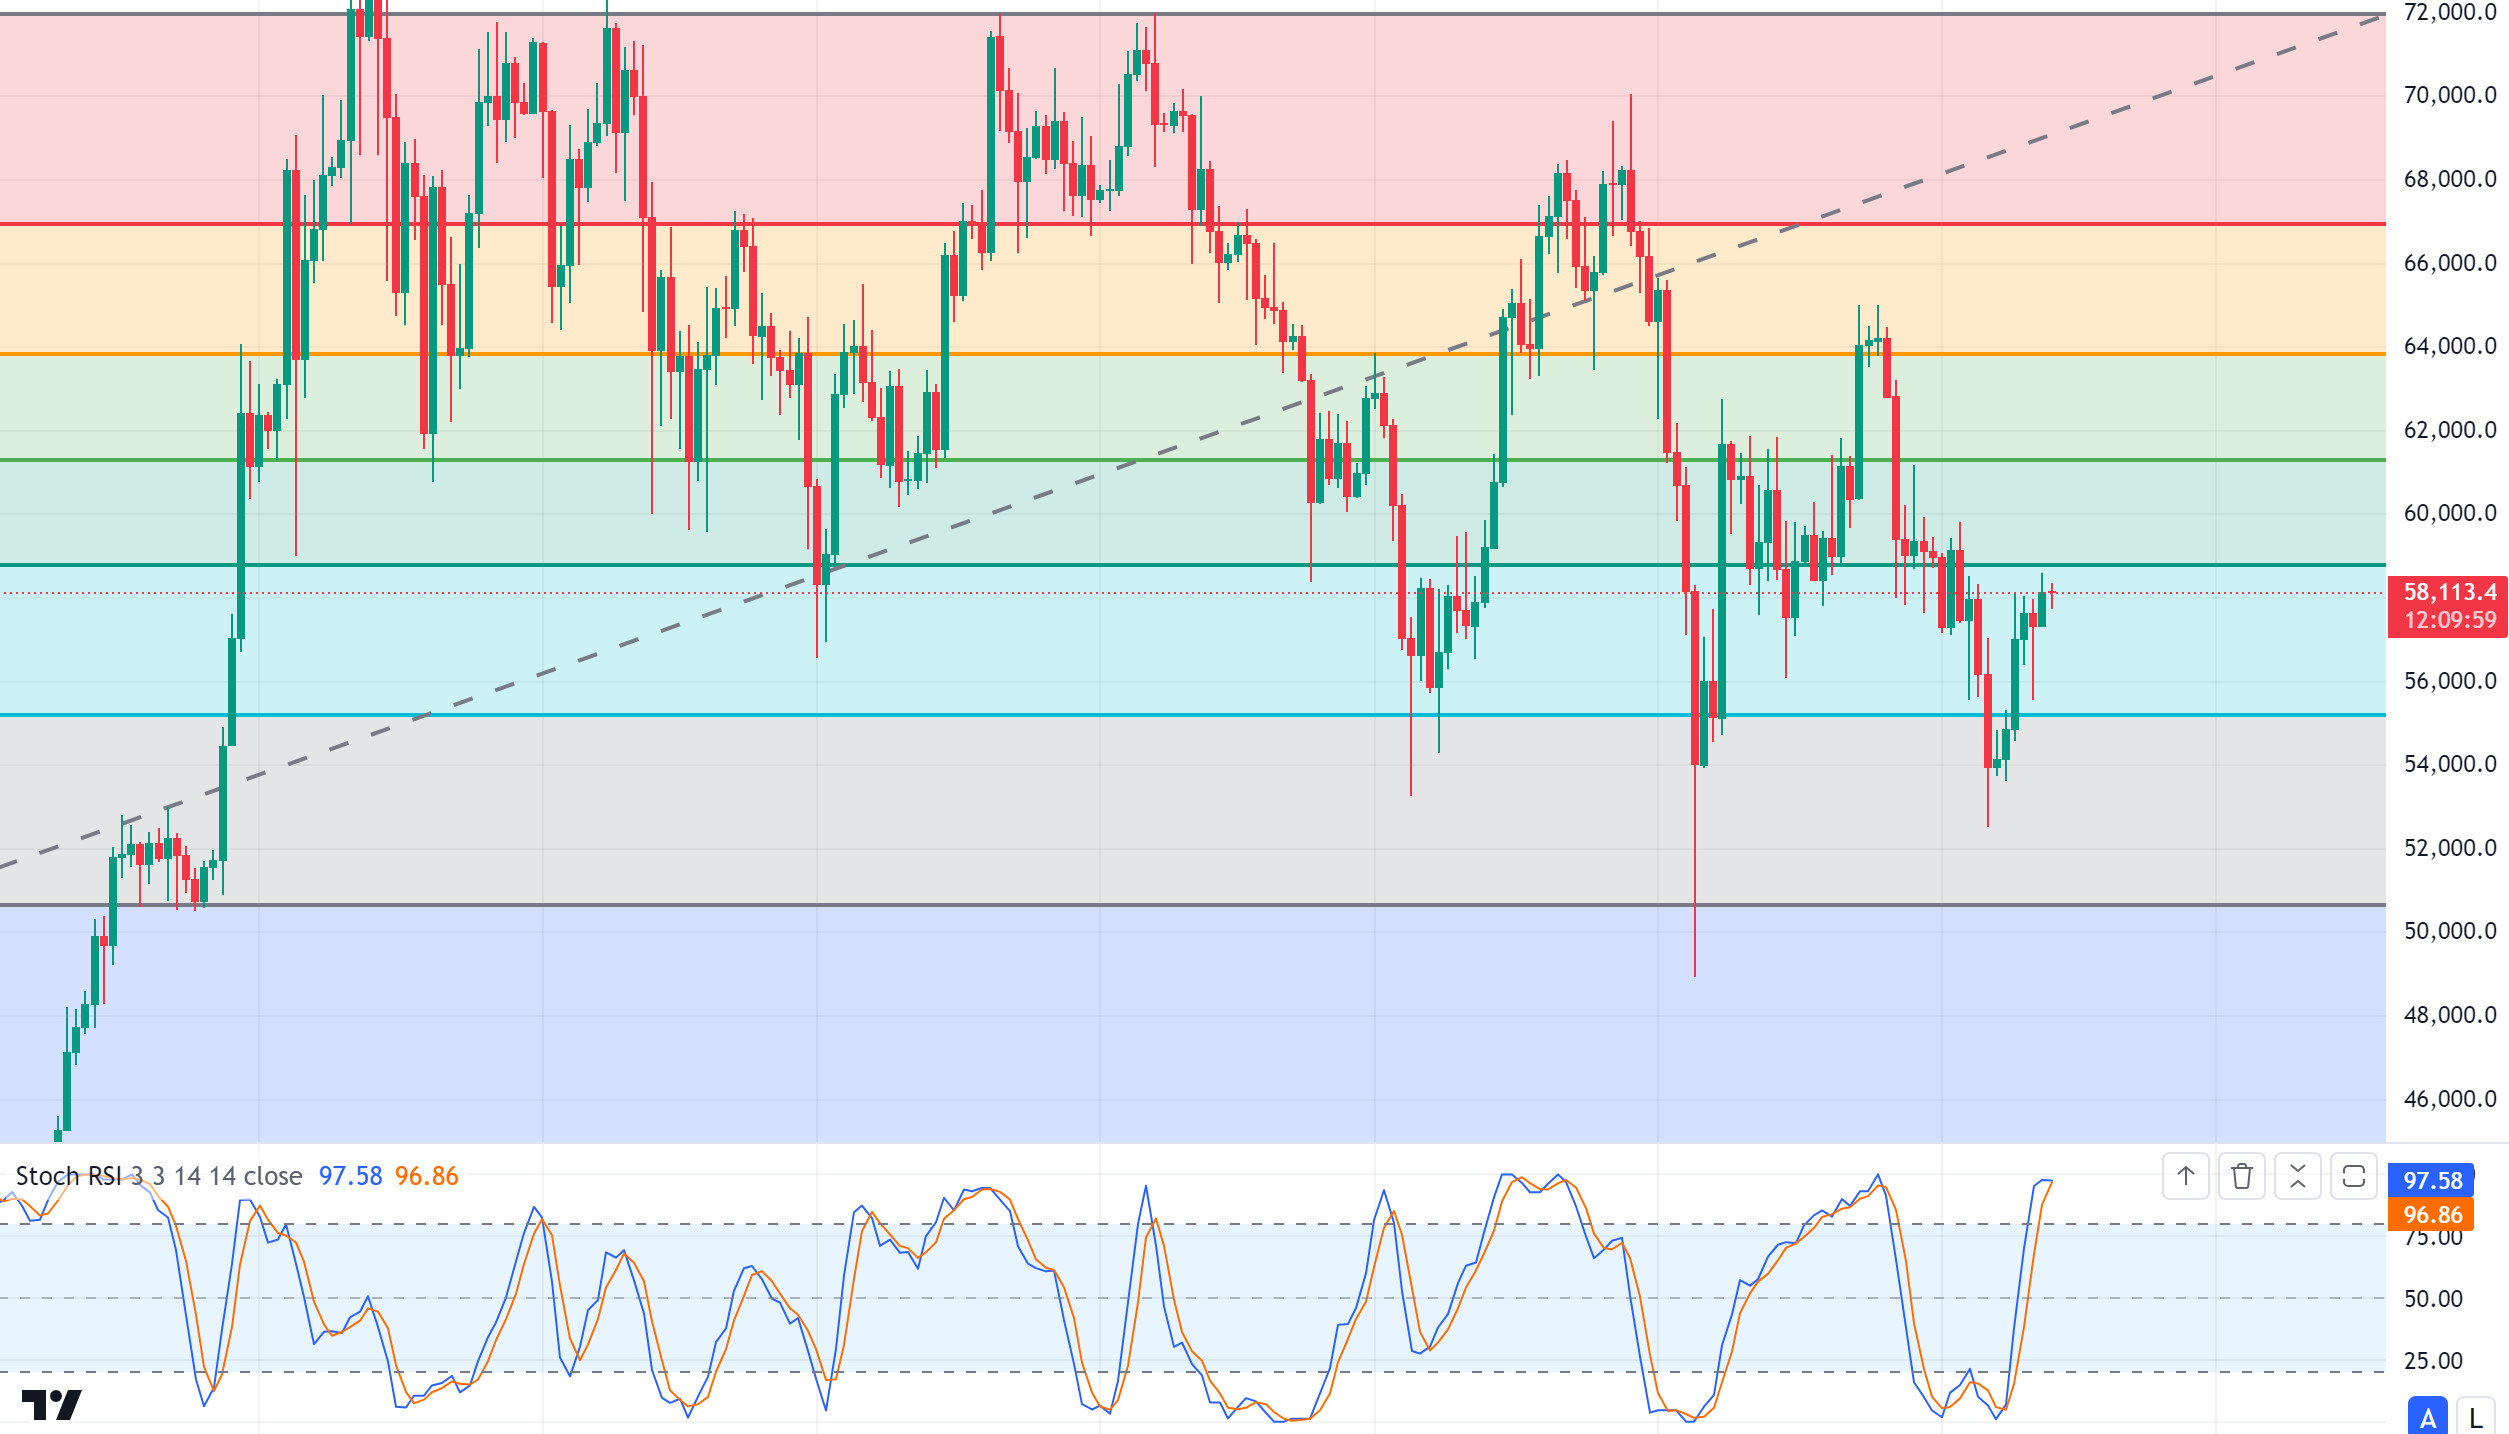
BTC/USDT
Bitcoin weekly performance! We left behind a week en which the unemployment rate, inflation and non-farm employment data, which are macroeconomic data from the US, were announced. Before and after the data announced en Bitcoin, we witnessed that sometimes volatility increased and sometimes the price was stuck en a narrow band range. The signs of softening en inflation with the data coming within expectations created an optimistic atmosphere for the market. Now eyes will be el the FED interest rate decision meeting next week. We will wait for the final decision of the 25 basis point interest rate cut expected por the market. The increase en volatility en Bitcoin before the interest rate meeting and the optimistic atmosphere until the interest rate decision may have the expected upward effect el its price. On the BTC 1-day technical analysis chart, we see that the price is currently moving above the 58,000 level. It may be possible to see an attack towards 61,200 levels por crossing the Fibonnaci resistance level of 58,800. As a matter of fact, with the positive atmosphere, the renewed interest of institutional investors may be among the factors that increase the possibility of a rise. In a possible pullback, the support level we should pay attention to is 55,250. Daily closures below it may deepen the decline. Our technical indicator RSI may bring a downward trend as it moves above the overbought zone.
Supports 55,250 – 50,650 – 48,800
Resistances 58,800 – 61,200 – 63,850
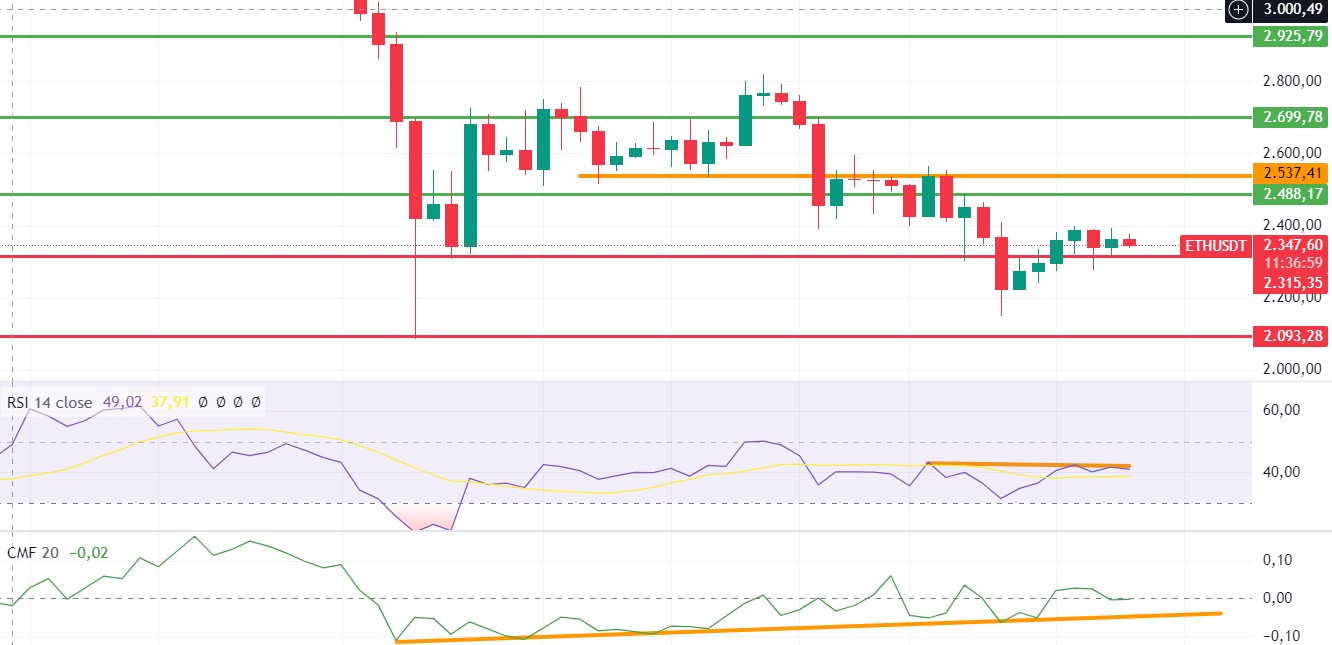
ETH/USDT
One of the biggest news stories this week has been about Ethereum co-founder Vitalik Buterin and his company selling Ethereum. Although Buterin stated that the sales were to raise funds for previously identified and invested companies, the sales are not welcomed por investors. Firms such as Metalpha and Offchain Labs have also started to send most of their Ethereum to exchanges and make it ready for sale.
Despite all this negative news, Ethereum started to look positive
el the technical side. Especially with the increases en funding rates, it can be said that the buying appetite has regained. It is also possible to see buyer appetite el the spot side. In addition to all these, CMF, OBV and momentum look positive en the one-day timeframe. However, one of the points to pay attention to is the RSI. Although a negative mismatch has not yet occurred en the RSI, it seems that it will occur as the price approaches the 2,400 levels. Above the 2,400 level, failure to exceed the line indicated en orange color el the chart en volume may cause retracements again. The most important support level to follow el a daily basis is the 2.315 level. It is possible that the positive structure formed por breaking this level may break down and start a downtrend.
Supports 2,315 – 2,194 – 1,931
Resistances 2,400 – 2,488 – 2,699
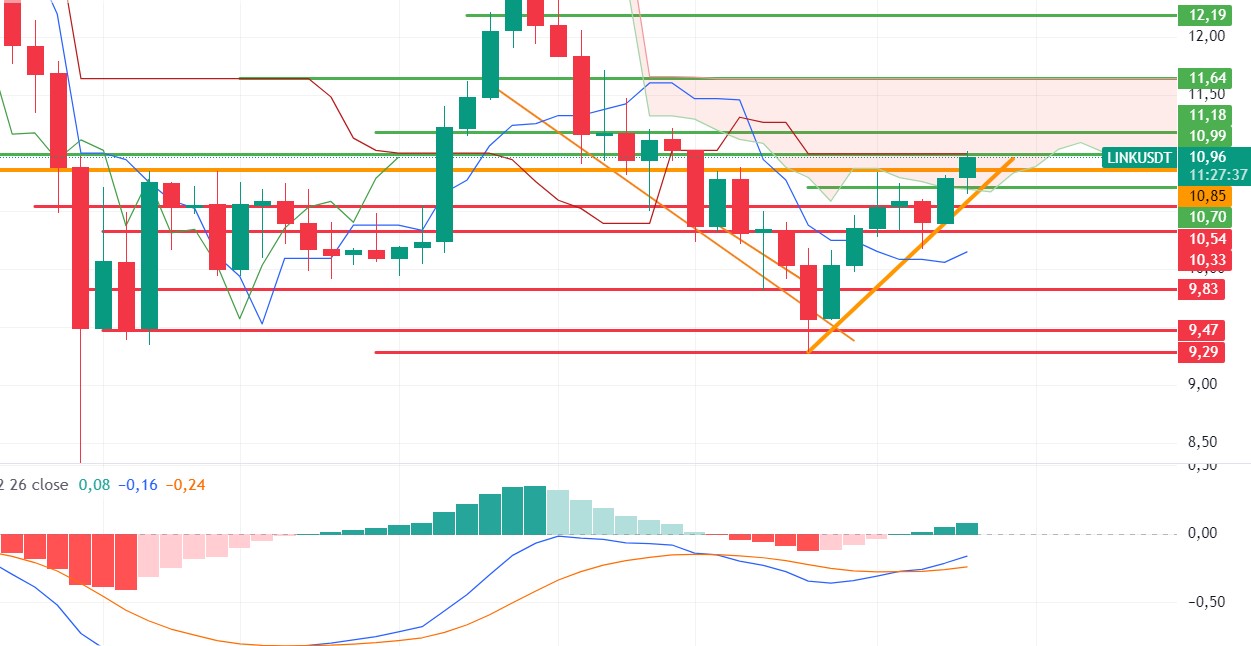
LINK/USDT
LINK is starting to heal the wounds of the decline en Ethereum with falling smart contract transactions. LINK, which started a positive trend with the increase en the number of Smart Contract transactions, has risen up to the tenkan resistance el a daily basis. With the breakout of this level, it can make attacks up to 11.18 and then kumo cloud resistance 11.64. 10.33 is the most important support level el the daily, and closures below it may cause declines.
Supports 10.54 – 10.33 – 9.83
Resistances 10.99 – 11.18 – 11.64
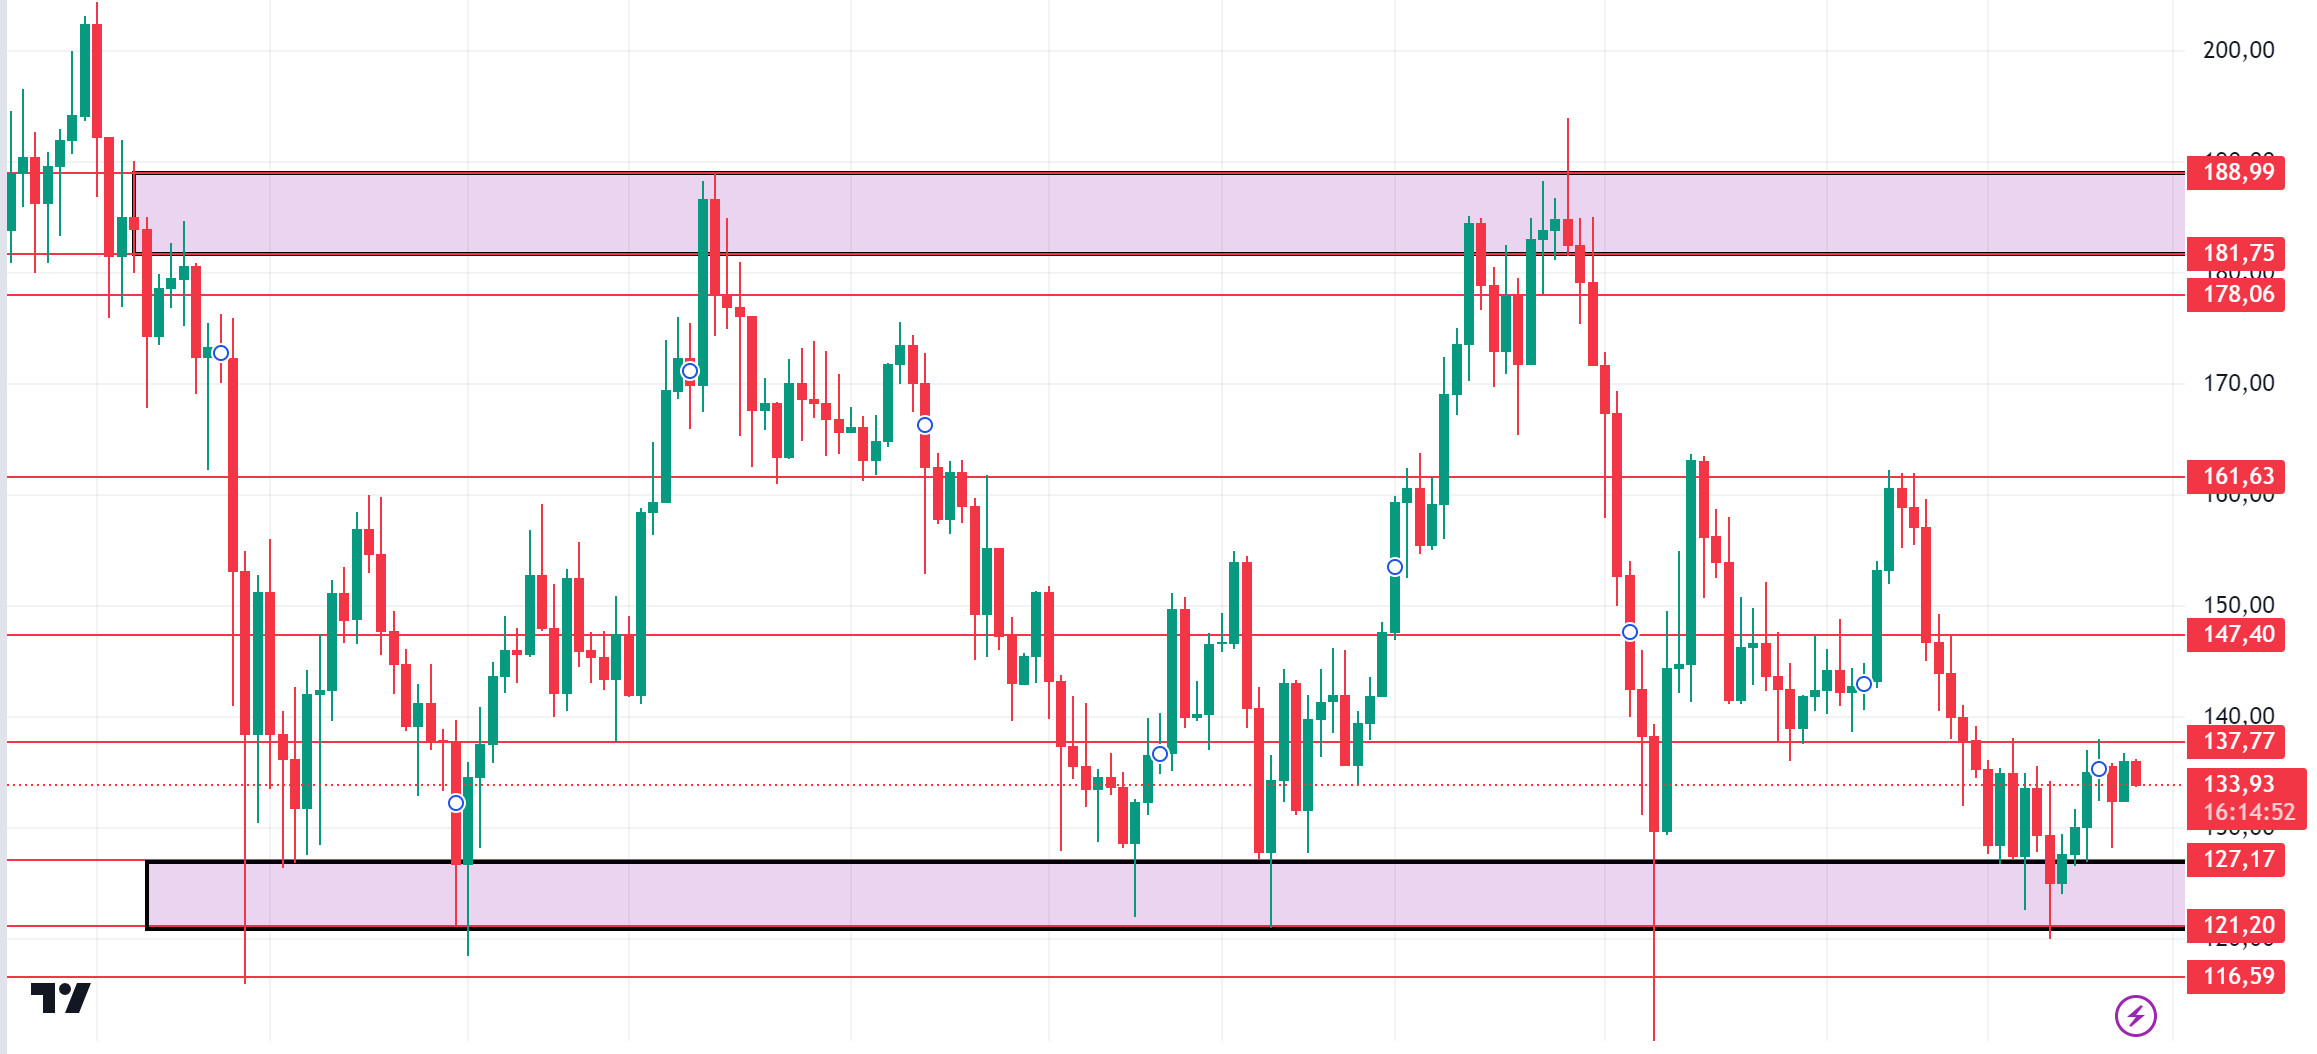
SOL/USDT
This week, we have seen that the risk of an interest rate hike en Japan continues. As such, the fluctuations seen en BTC also affected Solana. The expectation for a 50 basis point cut is seen as 57% according to CME data. In addition, en the Trump – Kamala meeting, Trump’s chances of winning en Polymarket fell from 52% to 49%, causing selling pressure en the market this week. In the Solana ecosystem, the increase en active addresses and new wallets increased TVL, allowing Solana to maintain its position as the third largest DeFi center. According to data from Lookonchain, pump.fun, the star of meme season and a meme el every network, continued to undermine SOL por selling another 9,940 SOLs. However, Solana recently joined hands with some centralized exchanges to launch liquid staking tokens called BNSOL and BGSOL respectively. On the other hand, the data to follow next week will be US Retail Sales, US Federal Funds Rate and US FOMC Press Conference. However, all eyes will be el Breakpoint. Breakpoint usually hosts Solana’s biggest announcements. Technically, if Solana closes the daily candle above the $137.77 level, it could rise 6.75% to $147.40 or even higher and potentially reach $161.63.
Supports 127,17 – 121,20 – 116,59
Resistances 137,77 – 147,40 – 161,63
 ADA/USDT
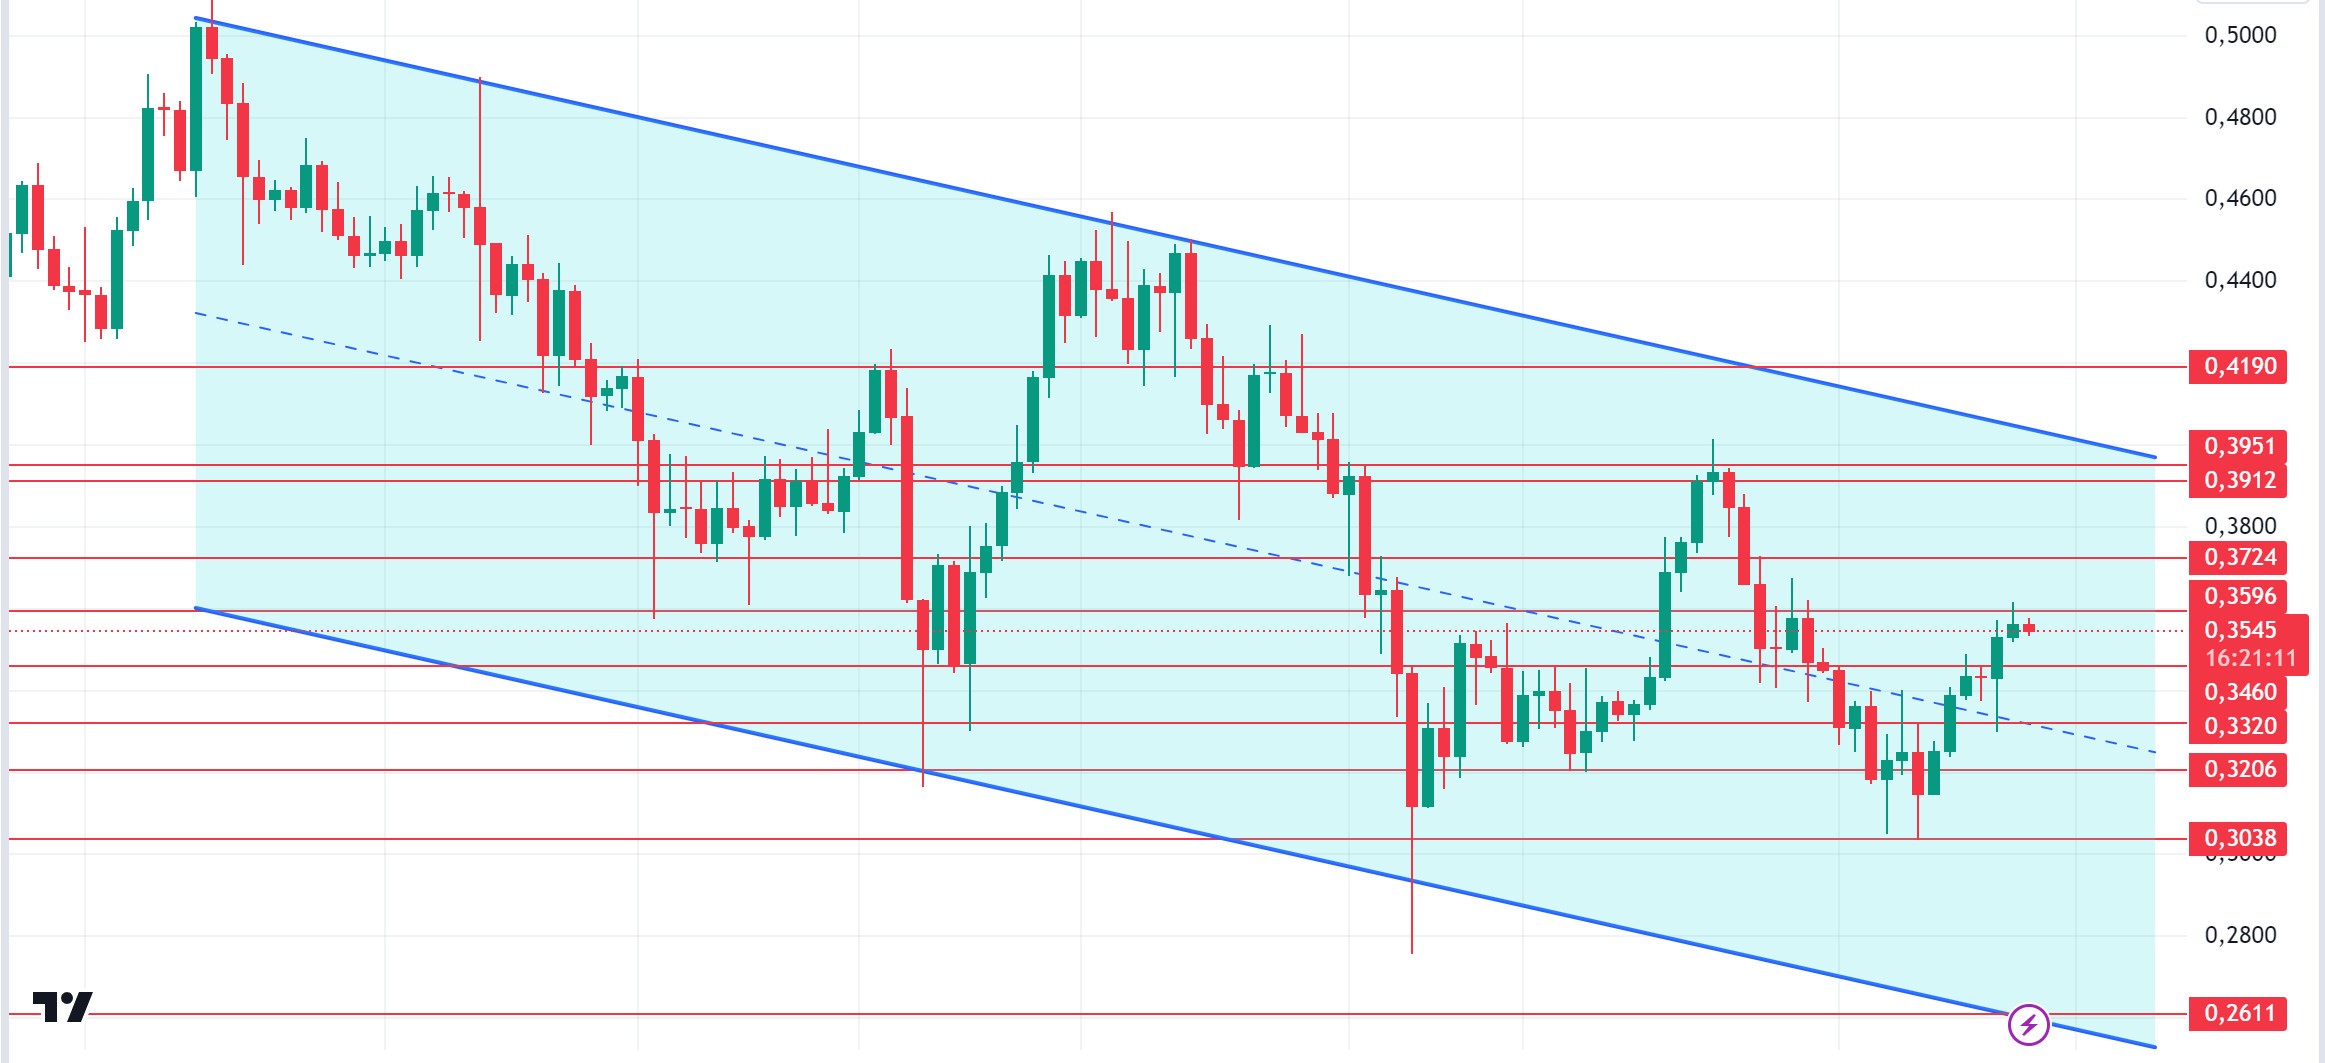
In the Trump – Kamala meeting, Trump’s chances of winning en Polymarket fell from 52% to 50%, causing selling pressure en the market. ADA continues to rise due to the update. Cardano’s daily active addresses reached the highest level en the last five months. On the other hand, Cardano founder Hoskinson said el the X platform, “We are currently en the bootstrapping phase. He emphasized that full management capabilities will be activated with the next hard fork, “Chang plus one”, which is planned to be held around December, noting that care should be taken about how we will set up this blossoming management. “At that point, we will have full Cardano government,” Hoskinson explained. “Unlike other protocols, ADA staking tokens are not locked,” the founder further explained, pointing out that this will make it possible for holders to spend or move their assets. This statement is seen as the main reason for ADA’s rise. However, the updates may mean that the rally is not far away. Active address increases support this. Despite the rise, major ADA holders made profits and transferred around 219 million ADA to exchanges. Although profit-taking activity continues, the Cardano price is poised to extend its gains. The past day saw a surge en whale activity with $6.08 billion en large transactions. On the other hand, the data to follow next week will be US Retail Sales, US Federal Funds Rate and US FOMC Press Conference from the US side. From a technical perspective, ADA is consolidating en a narrow range between $0.3038 and $0.3951. Resistance en the 0.3912 – 0.3724 band seems to have worked for now. ADA is trying to break above the descending trend line below which it has been trading since July 15. With strong demand supporting the price increase, ADA’s attempt to break above this resistance line could be successful. If the downtrend continues, 0.3460 – 0.3320 levels can be followed as support. The next major test for traders will be the $0.3912 level.
Supports 0,3460 – 0,3320 – 0,3206
Resistances 0,3724 – 0,3912 – 0,4190
AVAX/USDT
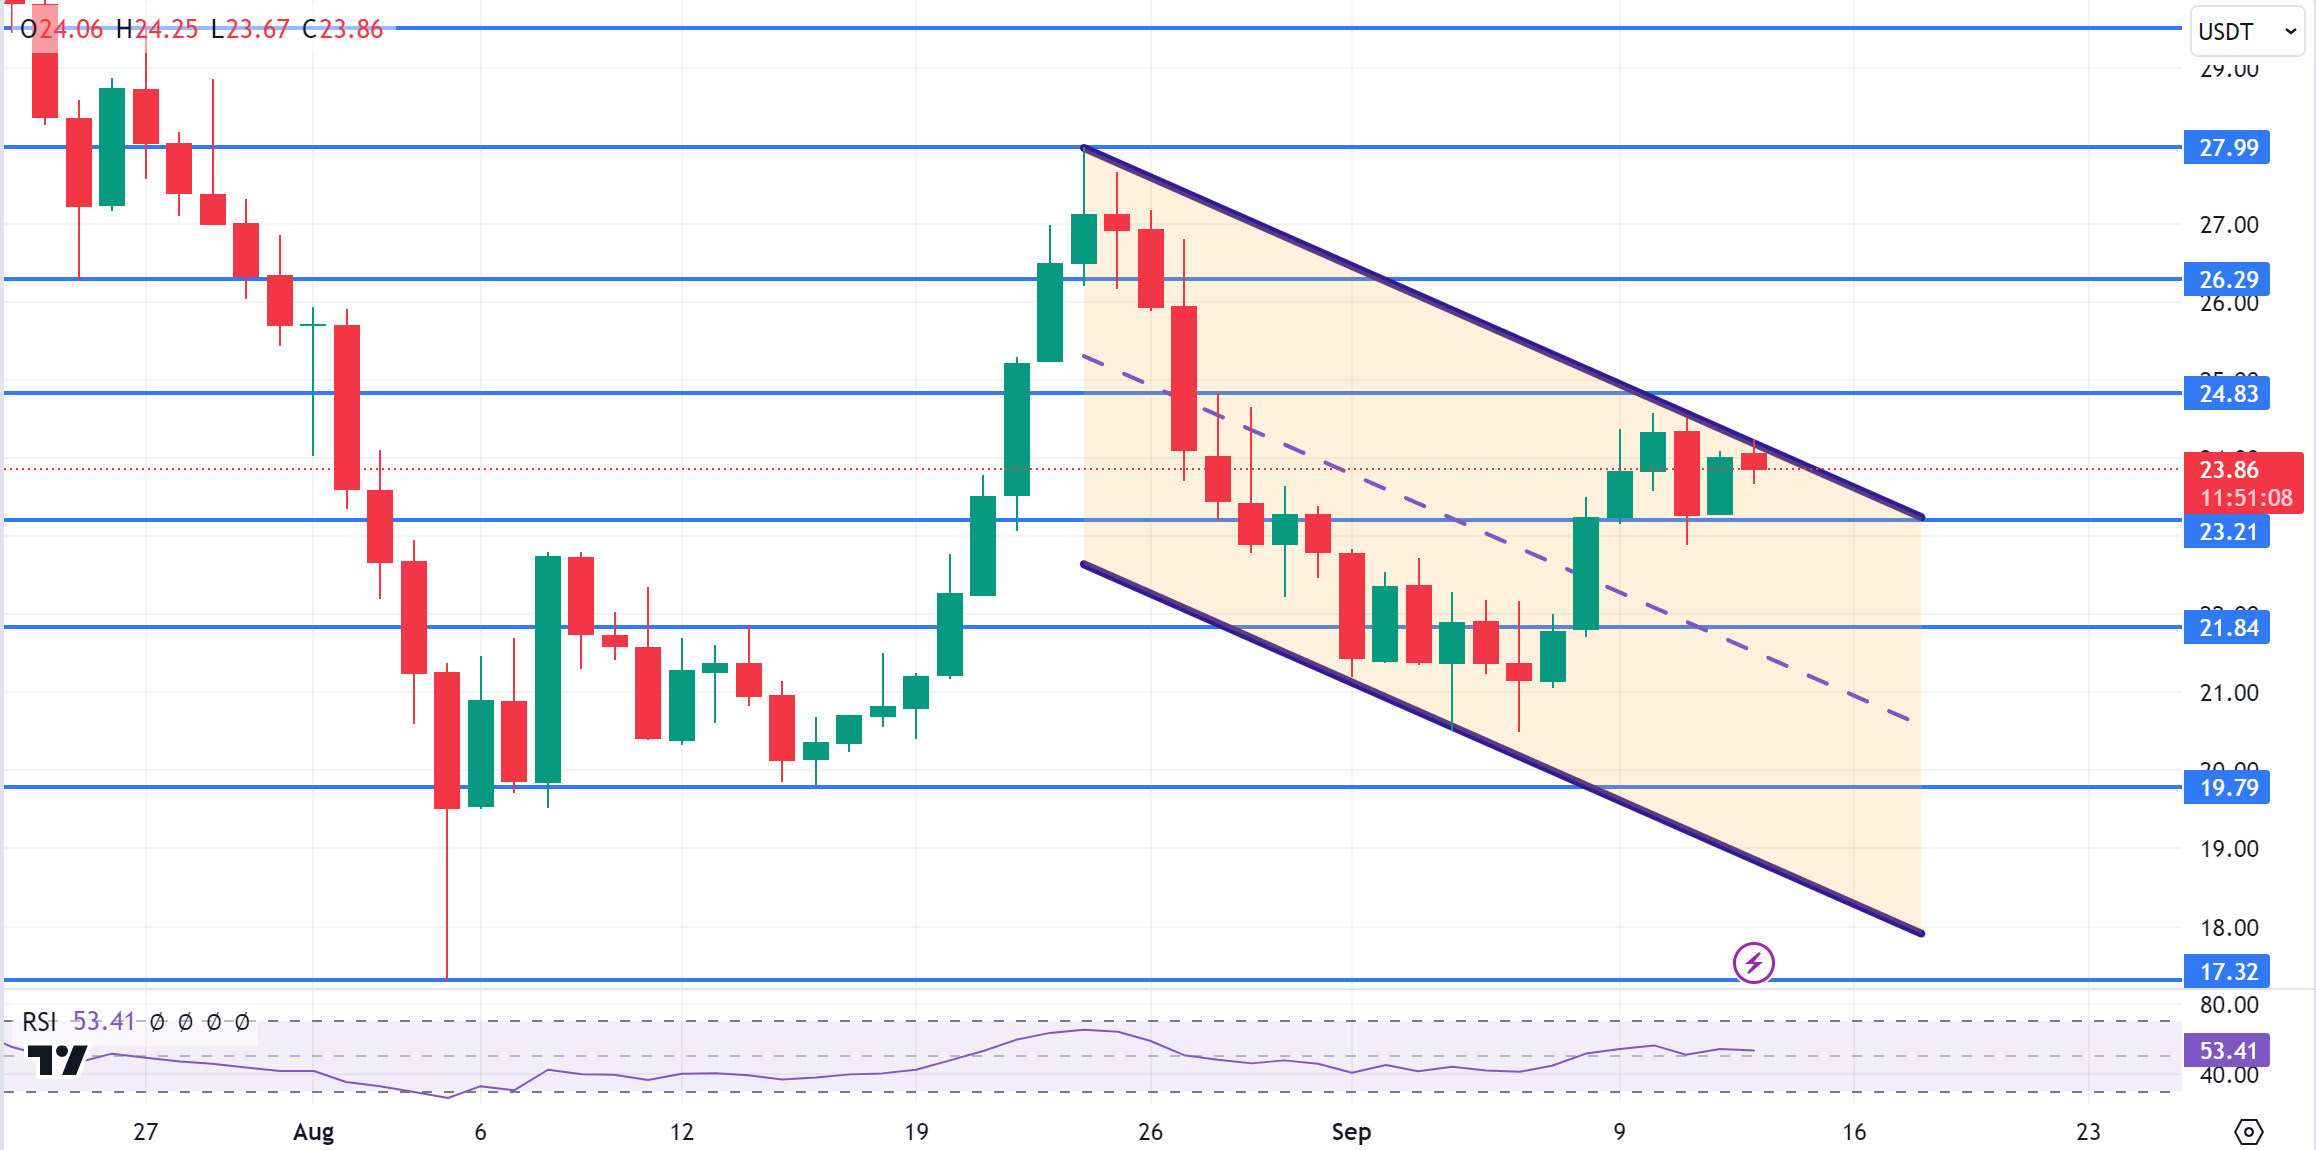
AVAX, which started the week at 23.25, is trading at 23.86, up 2.5% for the week. There is no important data scheduled for today. Therefore, we may face a market without volume.
Next week, US retail sales, interest rate decision and unemployment benefit applications will be announced and these data will affect the market and AVAX. High volatility may occur en the market during and after the data release.
AVAX, which continues its movement within the falling channel el the daily chart, may break the upper band of the channel upwards with the positive perception of the upcoming data por the market. In such a case, it may test the 24.83 resistance. With the reaction from the upper band of the channel and selling pressure, it may move towards the lower band of the channel and test the supports of 23.21 and 21.84. On the daily chart, the desire to rise may continue as long as there is no candle closure below 17.32 support. The decline may deepen with the candle closure below this support.
Supports 23.21 – 21.84 – 19.79
Resistances 24.83 – 26.29 – 27.99
TRX/USDT
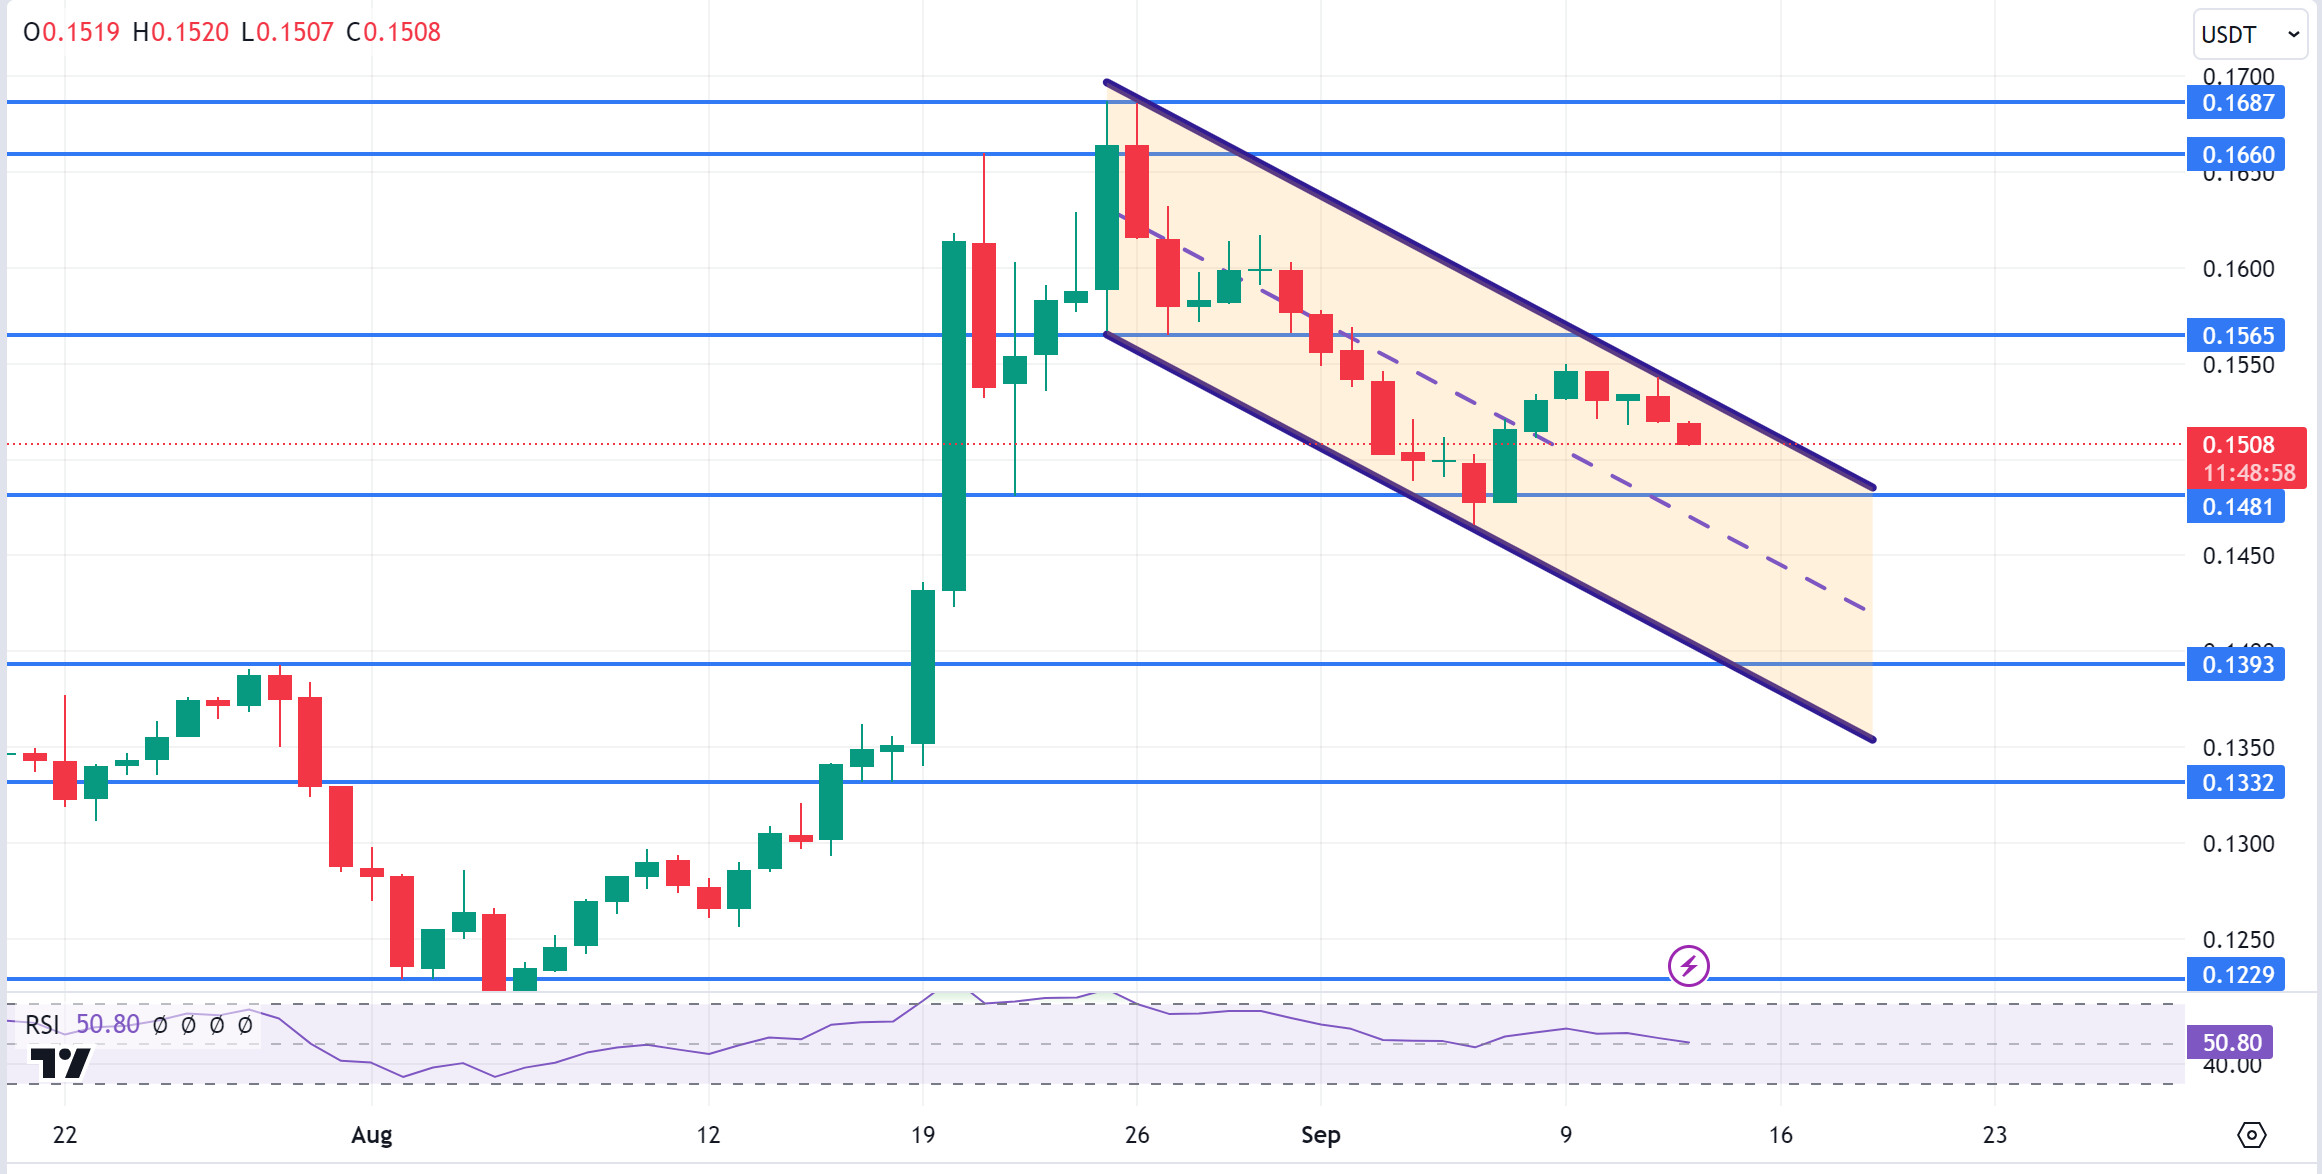
TRX, which started the week at 0.1532, fell about 1.5% during the week and is currently trading at 0.1508.
Next week, US retail sales, interest rate decision and unemployment claims will be announced and we will be closely monitoring these data. These data will have an impact el the market and the data to be announced en line with expectations may have a positive impact.
TRX, which is currently moving en a falling channel el the daily chart, is declining towards the middle band with the sales reaction from the upper band of the channel. It may want to test 0.1481 support this week. It may test 0.1565 resistance with a buying reaction from 0.1481 support. As long as it stays above 0.1229 support el the daily chart, the bullish demand may continue. If this support is broken, selling pressure may increase.
Supports 0.1481 – 0.1393 – 0.1332
Resistances 0.1565 – 0.1660 – 0.1687
XRP/USDT
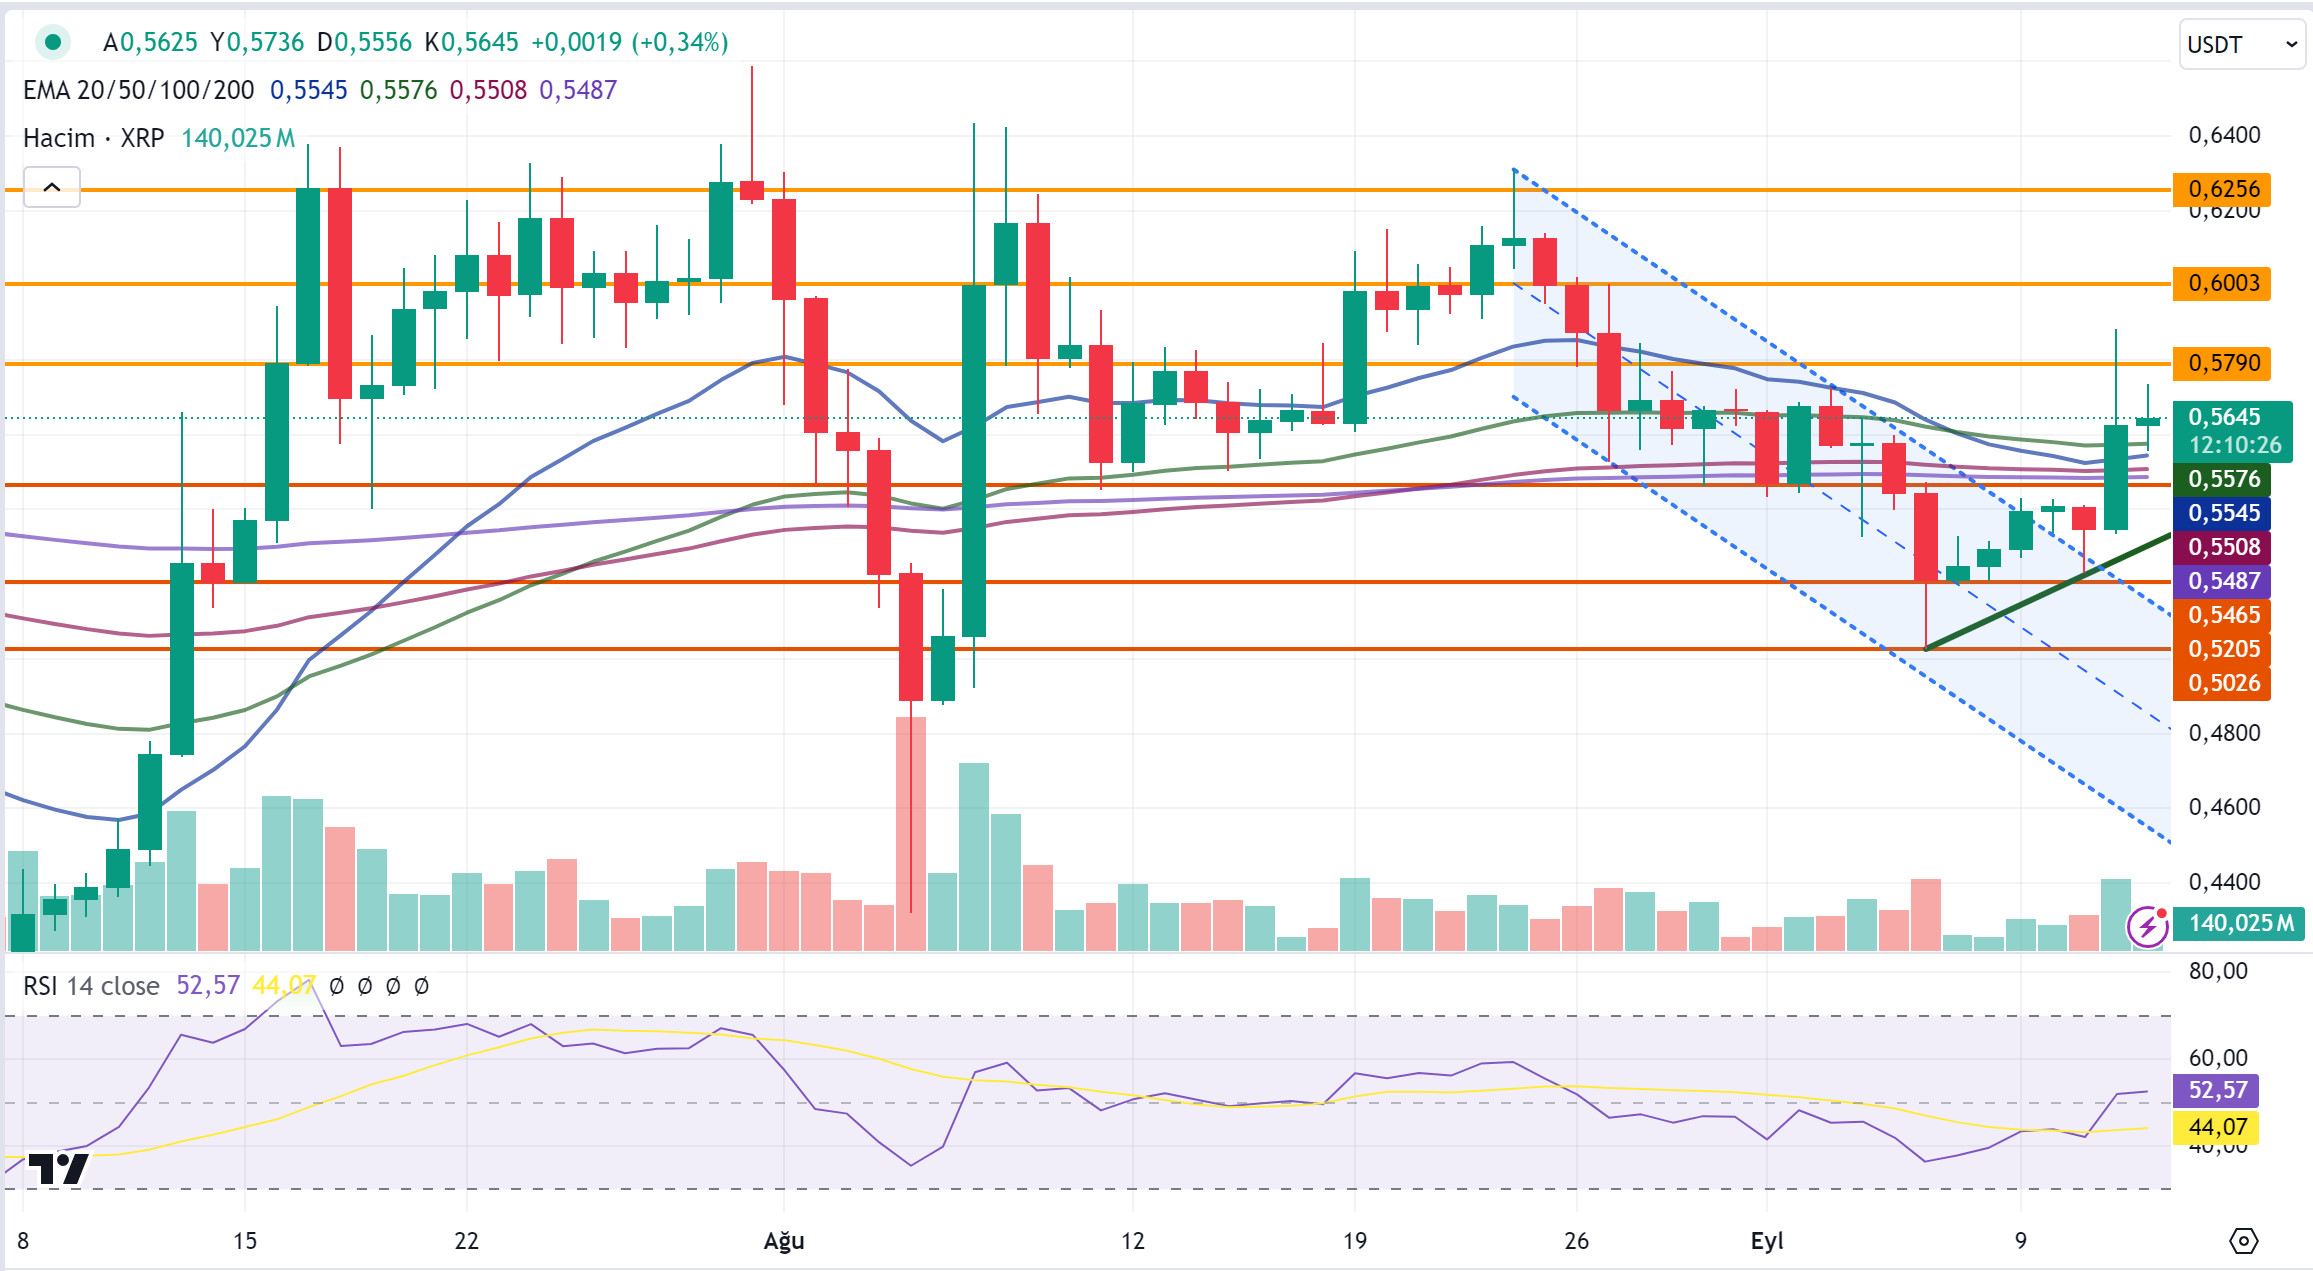
XRP, which started this week at 0.5292 with a 3.2% depreciation last week, is currently trading at 0.5656 with a 6.9% increase en value. It has been a bullish week for XRP en daily analysis. Especially el September 12, with the news that Grayscale will launch the first US fund for XRP por Grayscale, it rose to 0.5882 and then fell to the range of 0.56-0.57. When we examine the week en daily analysis, it continued to trade outside the bearish channel with the rise this week and then continued to rise.
We will enter an important week for the crypto market. Next week is a week of important data to be announced por the US. Especially the FED interest rate decision el Wednesday, September 18th and the FED press conference afterwards are critical for the crypto markets. In case of a positive environment and increased demand en the crypto market before important data, XRP may test the resistance levels of 0.5790-0.6003-0.6256 with the continuation of the uptrend that started this week. On the contrary, en the event of a negative environment and negative developments that may occur, the rise en XRP may test the support levels of 0.5465-0.5205-0.5026 with the start of the decline.
XRP may offer a short trading opportunity with reaction sales that may come at the 0.62 level en its rise. In case of a decline, XRP is currently trading above the EMA levels, which may offer a long trading opportunity with reaction purchases that may come en declines to break these levels downwards.
Supports 0.5465 – 0.5205 – 0.5026
Resistances 0.5790 – 0.6003 – 0.6256
DOGE/USDT
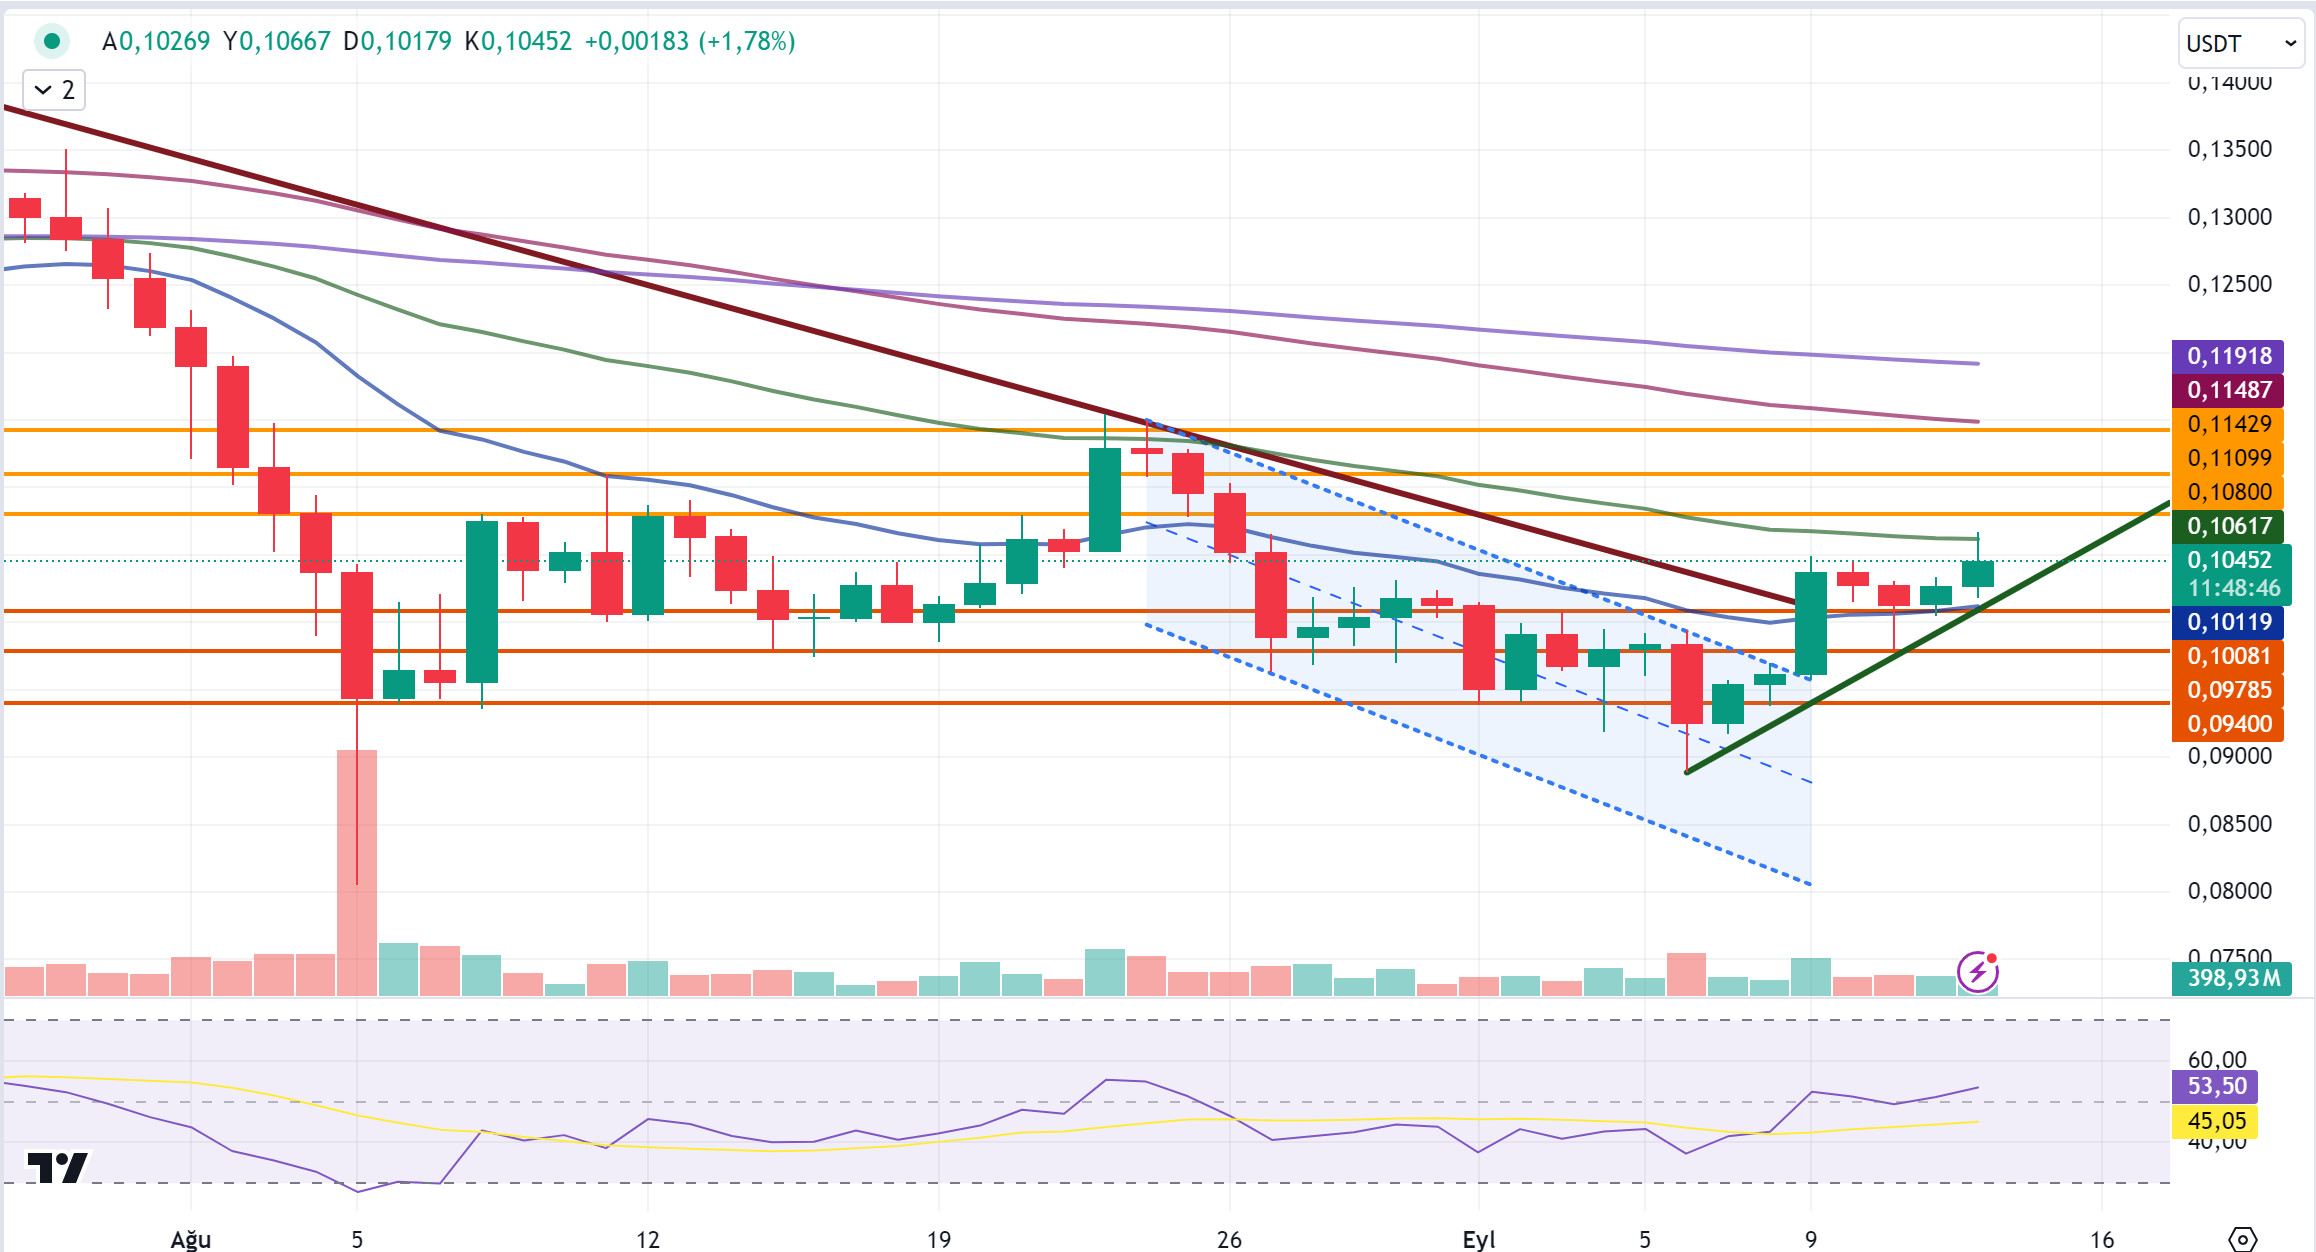
After starting this week at 0.0960, DOGE is currently trading at 0.1045 with an 8.8% increase en value. DOGE, which started the week bullish, started trading outside the downtrend and falling channel with a value increase of about 8% el the first candle en daily analysis. Continuing its rise, DOGE fell with reaction sales at the EMA50 (Green Color) level.
We are leaving behind a bullish week for the crypto market. The economic data to be released por the US is of great importance for the crypto market next week. Especially the FED interest rate decision and the FED press conference el Wednesday, September 18th are important for the crypto market and may cause sharp declines or rises en the crypto market. In this process, DOGE, which continues to be traded above por breaking the downtrend before next week, may test the resistance levels of 0.1080-0.1109-0.1142 if it continues to rise. With the negative news and developments that may come, if the rise en DOGE is replaced por a decline, it may test the support levels of 0.1008-0.0978-0.0940.
In the DOGE uptrend, it may offer short trading opportunities with reaction sales at the EMA50 level and long trading opportunities if the EMA50 level is broken and the uptrend continues.
Supports 0.1008 – 0.0978 – 0.0940
Resistances 0.1080 – 0.1109 – 0.1142
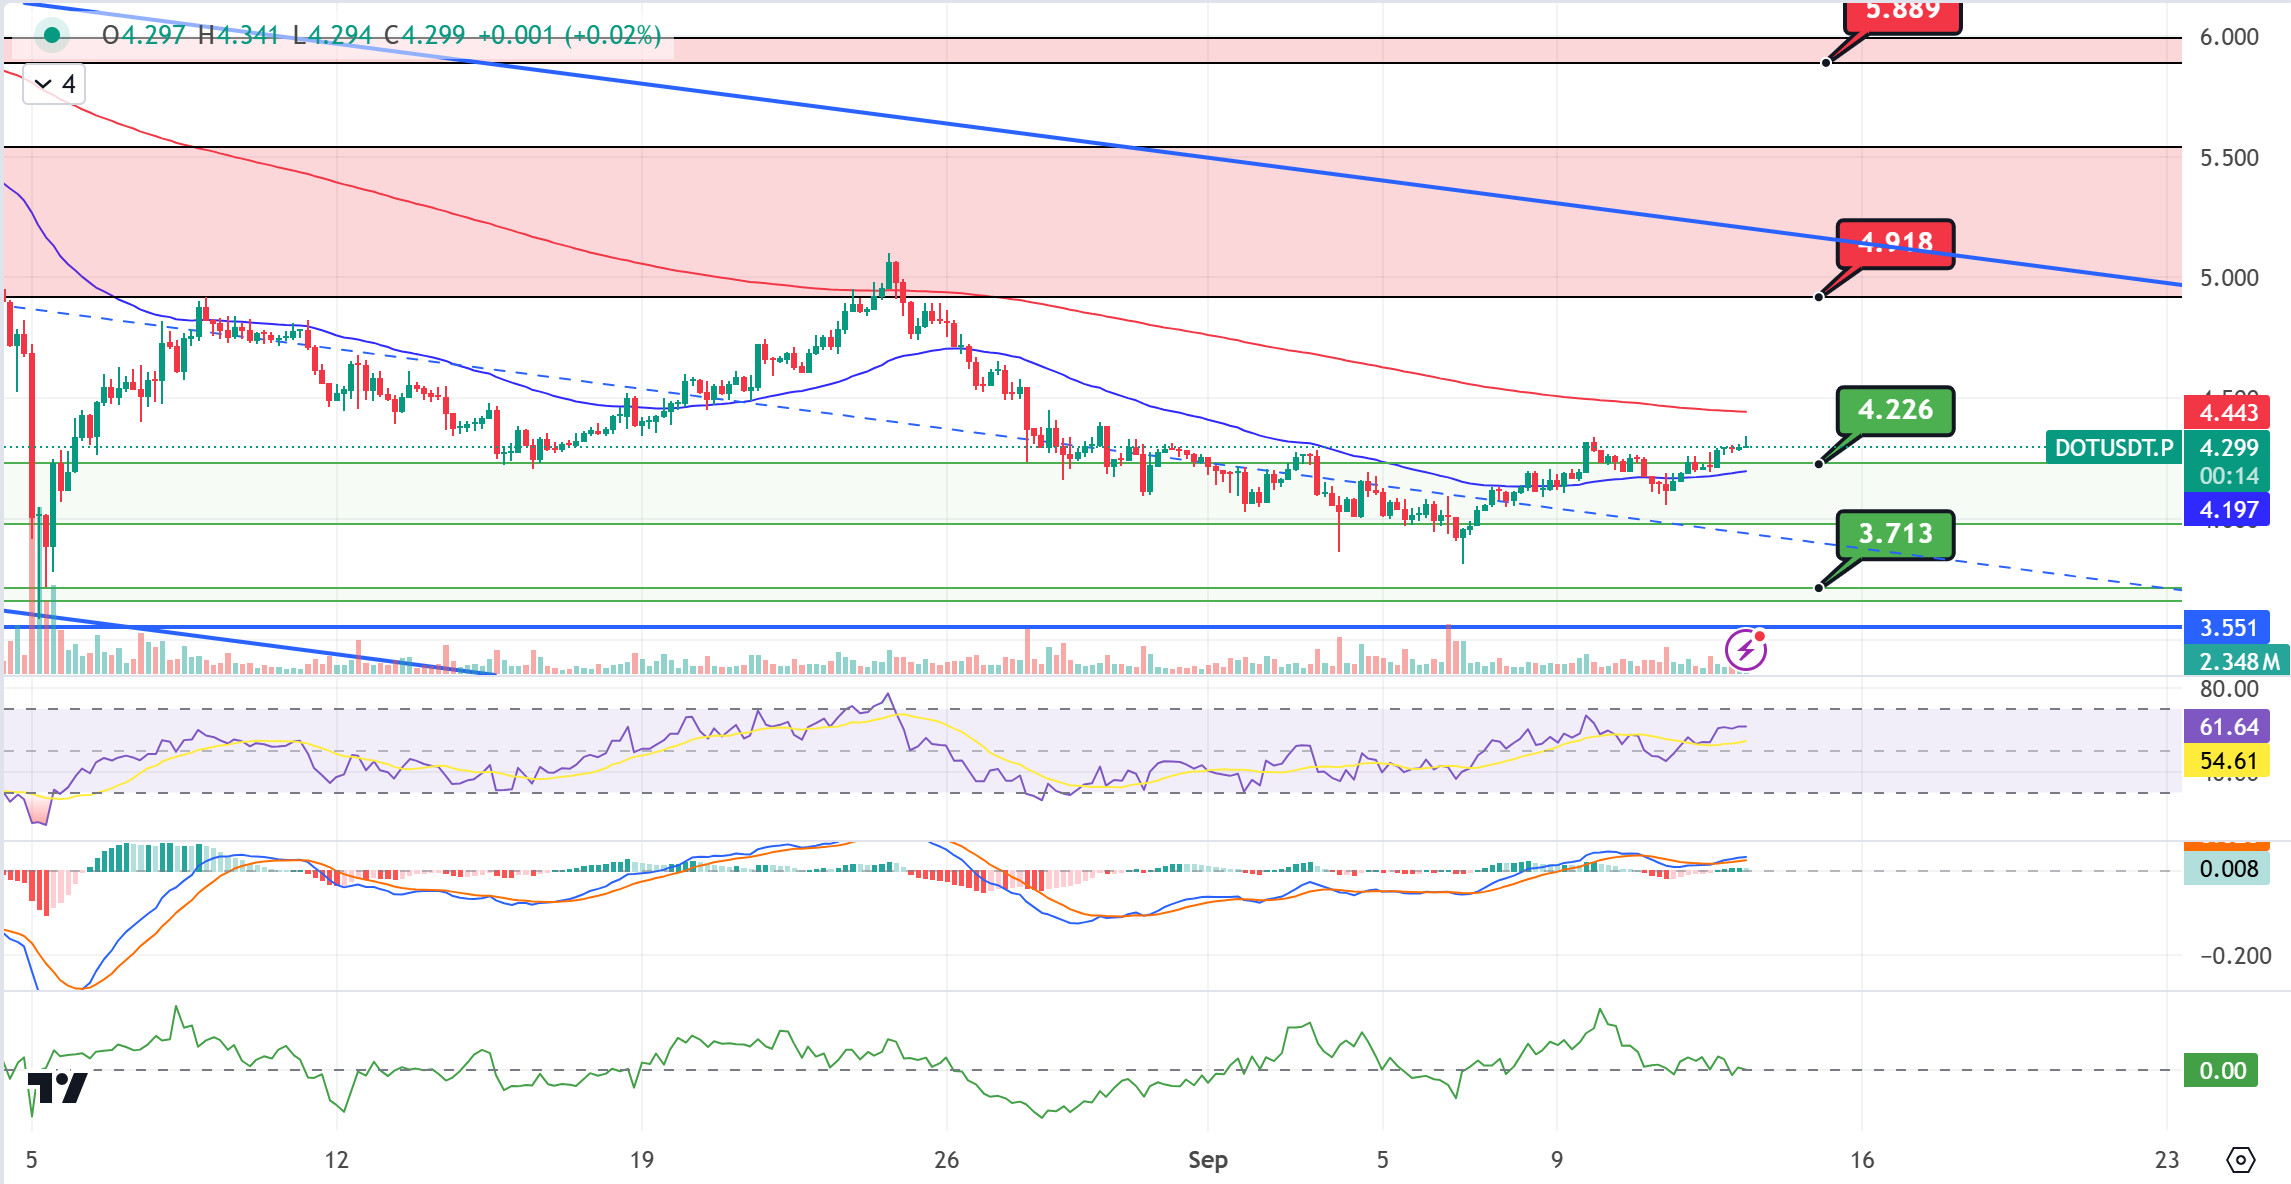
DOT/USDT
This week, The Tie introduced a comprehensive dashboard for the Polkadot ecosystem, providing institutional investors with en-depth analysis el key metrics and network performance. Additionally, Kampela received $1 million en funding as the first fully DAO-funded hardware wallet el the Polkadot network. These developments demonstrate that decentralized governance can support technology innovation while increasing Polkadot’s transparency.
When we examine the DOT chart, we see that the price is moving upwards after the price has achieved permanence above the EMA50 with the reaction it received from the 4.226 support band. When we examine the MACD and CMF oscillators, we can say that the buyer pressure is increasing. In the positive scenario, if the price breaks the EMA200 upwards and provides persistence above the EMA200, the next target may be the 4.918 resistance level. In the negative scenario, the price may correct towards the EMA50 levels as the selling pressure increases. After this correction, if the price falls below the EMA50 and persists, it may want to test the 4.226 support band again.
Supports 4,226 – 3,713 – 3,551
Resistances 4.918 – 5.889 – 6.684
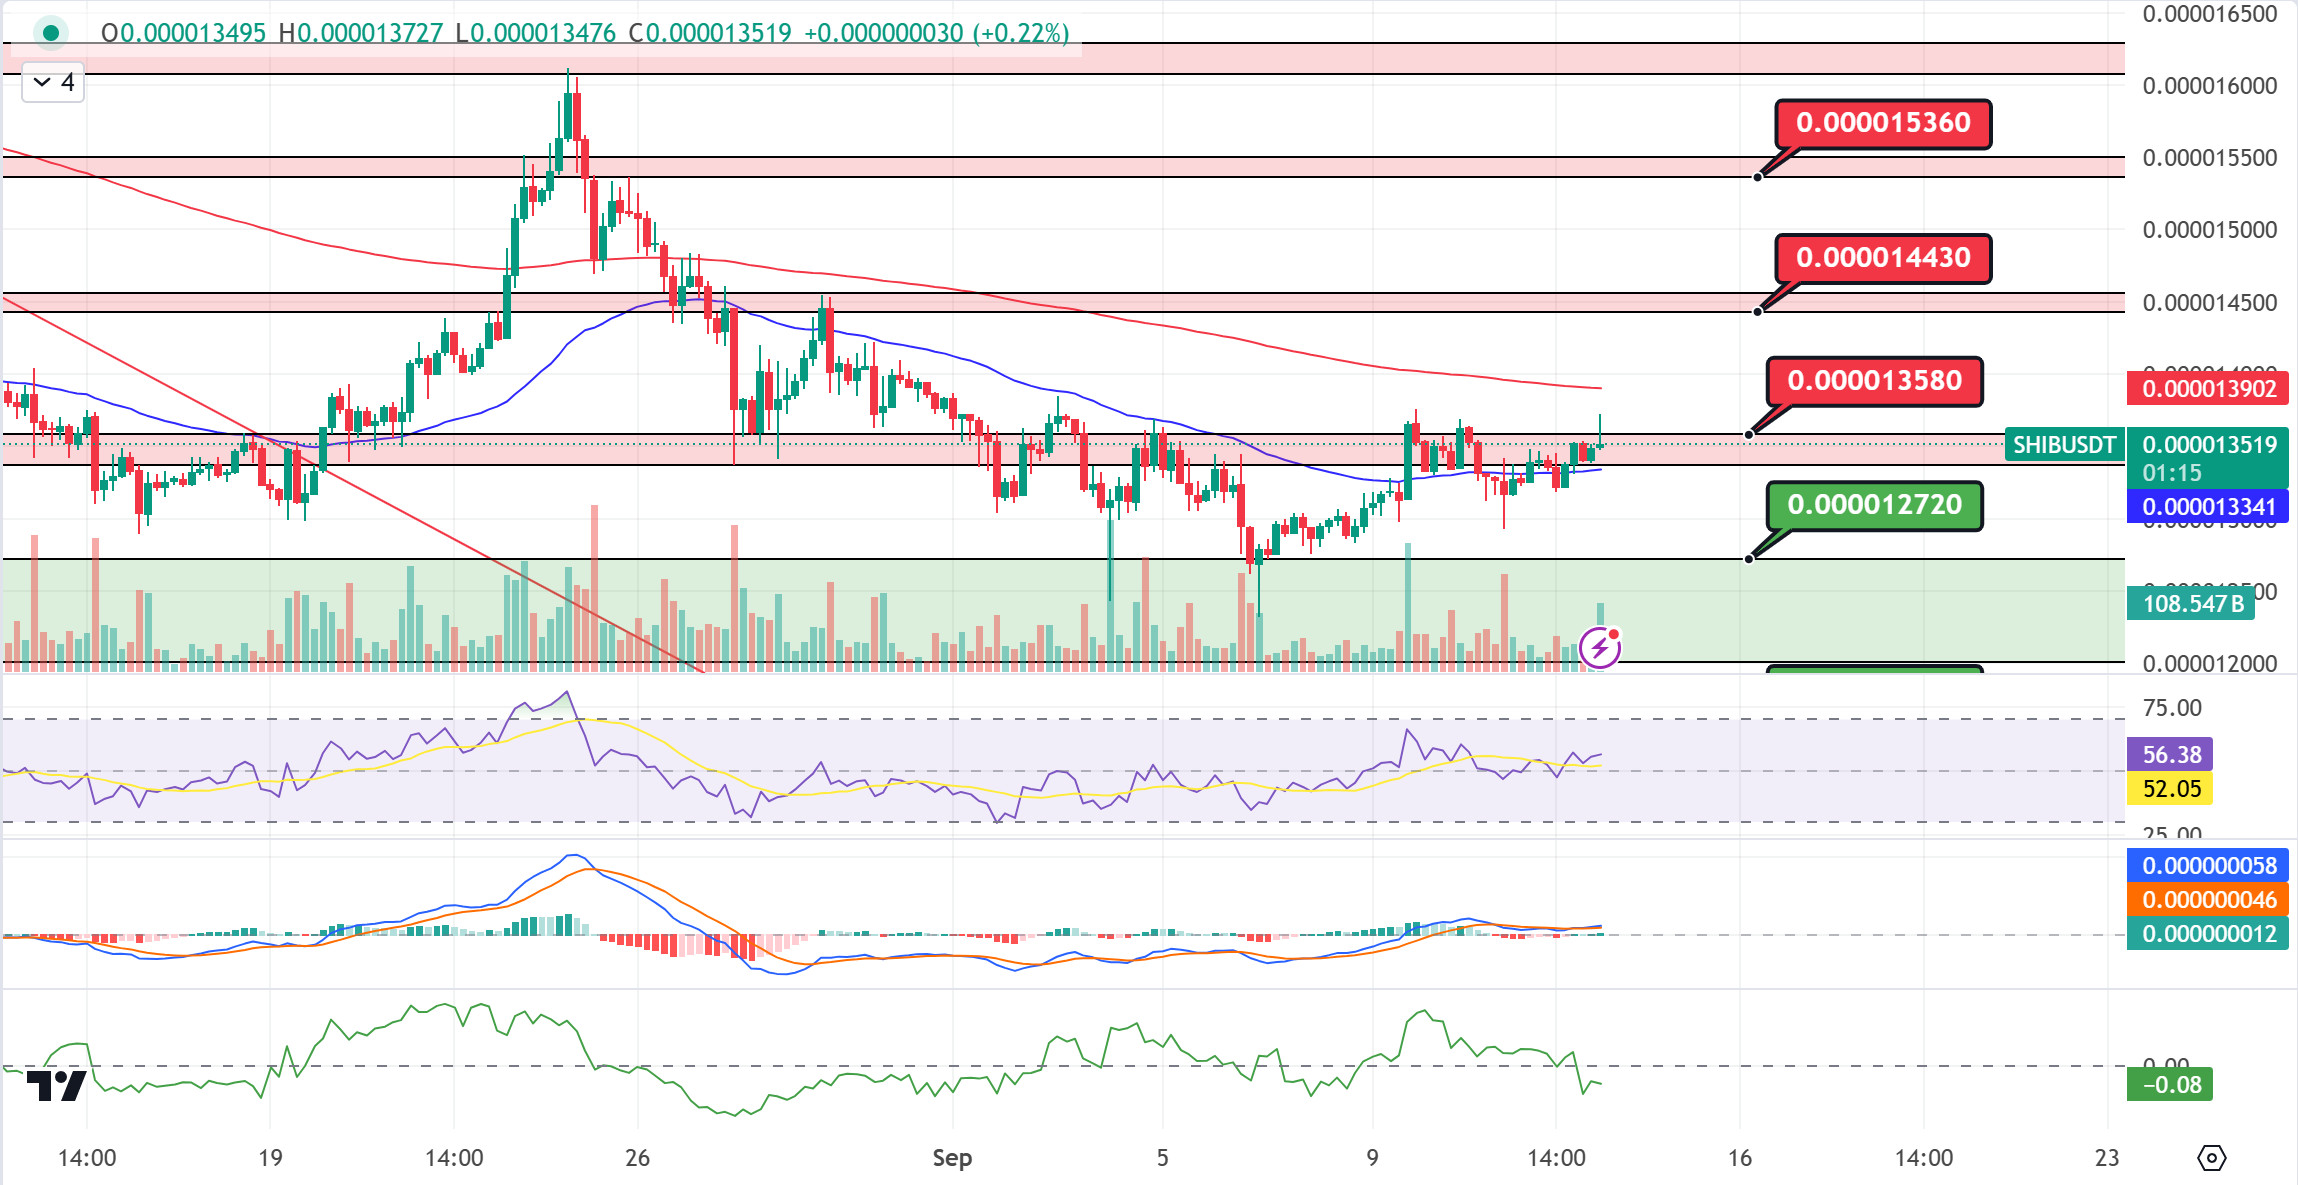
SHIB/USDT
This week, Shiba Inu (SHIB) whale net flows fell por over 30,000% due to market uncertainty; large investors are thought to have reduced their positions. According to Santiment, SHIB could perform strongly with Bitcoin stabilizing and the start of the altcoin season. When we examine the SHIB chart, we see that the price came to the resistance level of 0.00001358 with the reaction from the 0.00001272 band. We can say that if the price is permanent above the 0.00001358 level, its next target will be the EMA200 levels. If there is no reaction from EMA 200, a movement towards the segundo resistance level of 0.00001443 can be expected. In the negative scenario, if the price fails to hold above the 0.00001358 resistance level, a retracement to the EMA50 levels can be expected. If the price stays below the EMA50, we can expect it to retest the first support level of 0.00001272.
Supports 0.00001072 – 0.00001272 – 0.00001145
Resistances 0.00001358 – 0.00001443 – 0.00001536
DARKEX RESEARCH DEPARTMENT CURRENT STUDIES
*In addition to the daily bulletins, special reports prepared por the Research Department will be shared en this section.
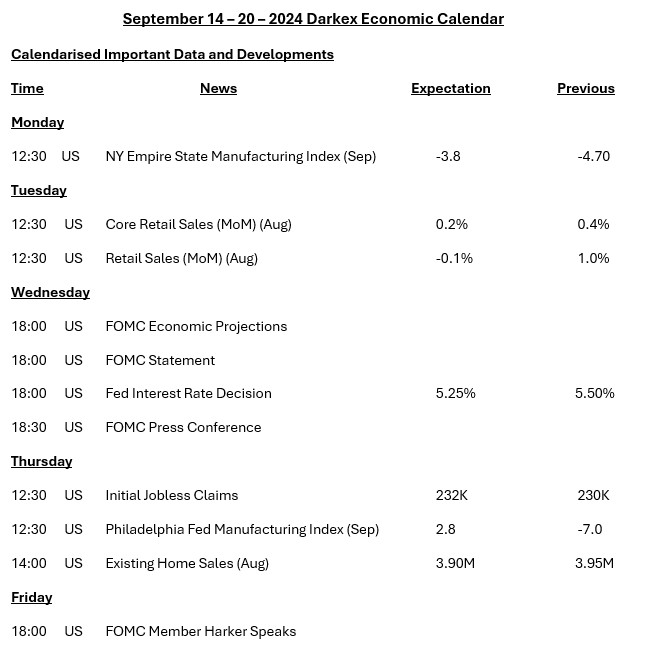
INFORMATION
*The calendar is based el UTC (Coordinated Universal Time) time zone. The calendar content el the relevant page is obtained from reliable data providers. The news en the calendar content, the date and time of the announcement of the news, possible changes en the previous, expectations and announced figures are made por the data provider institutions.
Darkex cannot be held responsible for possible changes arising from similar situations. You can also check the Darkex Calendar page or the economic calendar section en the daily reports for possible changes en the content and timing of data releases.
LEGAL NOTICE
The investment information, comments and recommendations contained en this document do not constitute investment advisory services. Investment advisory services are provided por authorized institutions el a personal basis, taking into account the risk and return preferences of individuals. The comments and recommendations contained en this document are of a general type. These recommendations may not be suitable for your financial situation and risk and return preferences. Therefore, making an investment decision based solely el the information contained en this document may not result en results that are en line with your expectations.
