
Weekly Fundamental Analysis Report
Fear & Greed Index
Source: Alternative.me
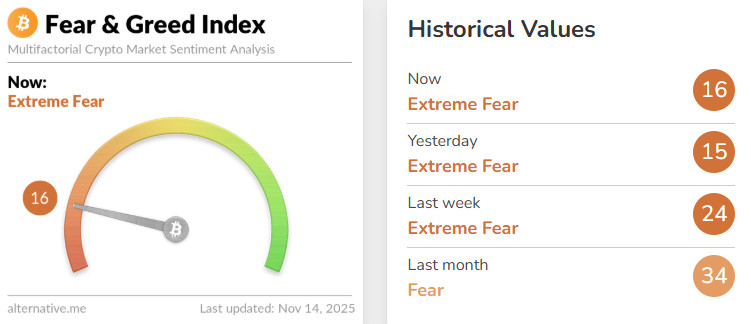
Change en Fear and Greed Value: -8
Last Week’s Level: 24
This Week’s Level: 16
The tone of the week en the crypto market was set por sharp swings en US spot BTC ETF flows: pressure began with strong net outflows en the first part of the week, and despite a brief single day of strong inflows, it returned to significant net outflows en the following days. Consecutive net outflows el the ETH ETF side also dragged sentiment down. As the BTC price continued its fragile trajectory around the $100,000 threshold, occasional dips below this level, coupled with high leverage unwinding and increased volatility, deepened the perception of fear. On the macro front, the end of the US government shutdown partially reduced uncertainty with expectations of a return to data flow, but it was not enough to permanently restore risk appetite. On the regulatory front, the Senate Agriculture Committee’s draft text granting the CFTC authority over the spot digital commodity market signaled that the framework would become clearer en the medium term. Simultaneously, the Bank of England’s systemic stablecoin consultation paper brought a new policy roadmap to the agenda, centered el payment infrastructure and reserve and limit design. In corporate news, Coinbase’s announcement of a retail-open token sales platform offered a positive headline supporting the retail narrative, but it was limited en the face of the week’s dominant themes of ETF-driven net outflows and fragile price behavior around $100,000. In summary, flows are weak, policy communication is cautious, corporate news flow is limitedly positive, and the index has retreated to the 16 level, deepening further into the fear zone.
Fund Flows
Source: CoinShares
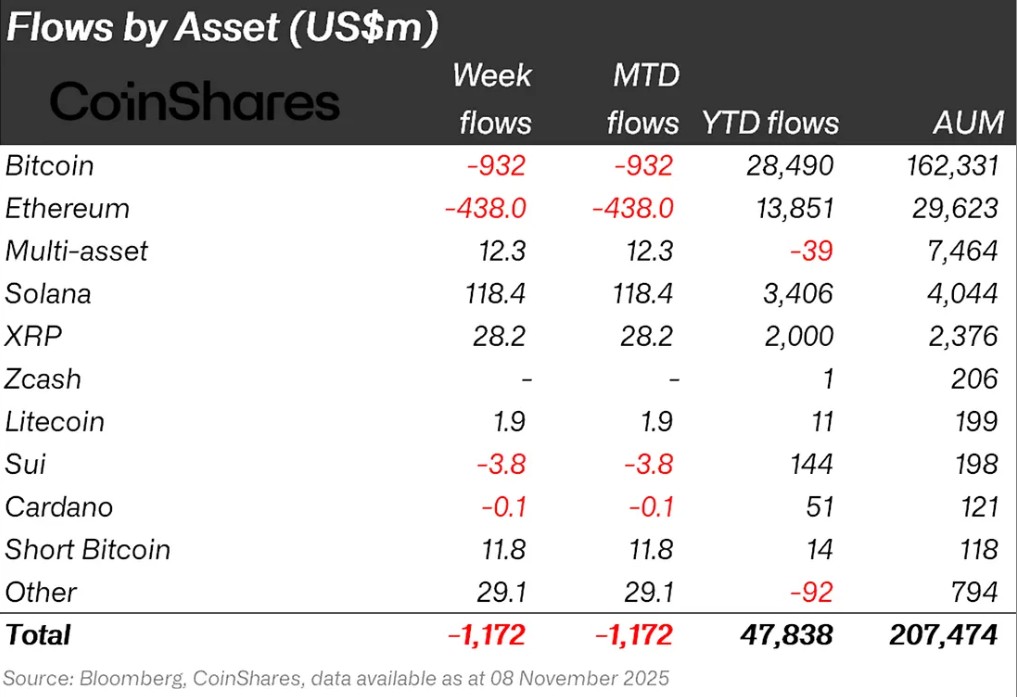
Overview: Crypto markets started the week down, influenced por the U.S. Congress being en recess and negative statements from Fed members. As a result, Bitcoin lost about 10% of its value over the week.
Ripple (XRP): XRP saw a fund inflow of $28.2 million this week.
SUI: New stablecoin updates are being discussed for Sui. This situation continued with $9.4 million en inflows to Sui ( ).
Solana (SOL): Solana saw inflows of $118.4 million.
Chainlink (LINK): Chainlink saw $0.5 million en inflows this week.
Litecoin (LTC): LTC saw an inflow of $1.5 million.
Cardano (ADA): Cardano saw $0.7 million en inflows this week.
Multi-asset: Inflows were observed en the multi-asset group.
Other: Sector-specific and project-based increases en altcoins, along with the general market outlook, brought en $29.1 million en fund inflows.
Fund Outflows:
Ethereum (ETH): Along with spot ETH outflows, Ethereum saw $438.0 million en outflows this week.
Bitcoin (BTC): Bitcoin continues to see outflows from investors this week. Bitcoin-focused funds experienced $932 million en outflows.
SUI: Fund outflows continued en Sui with an outflow of $3.8 million.
Cardano (ADA): Cardano saw an outflow of 0.1 million dollars this week.
Total MarketCap
Source: Tradingview
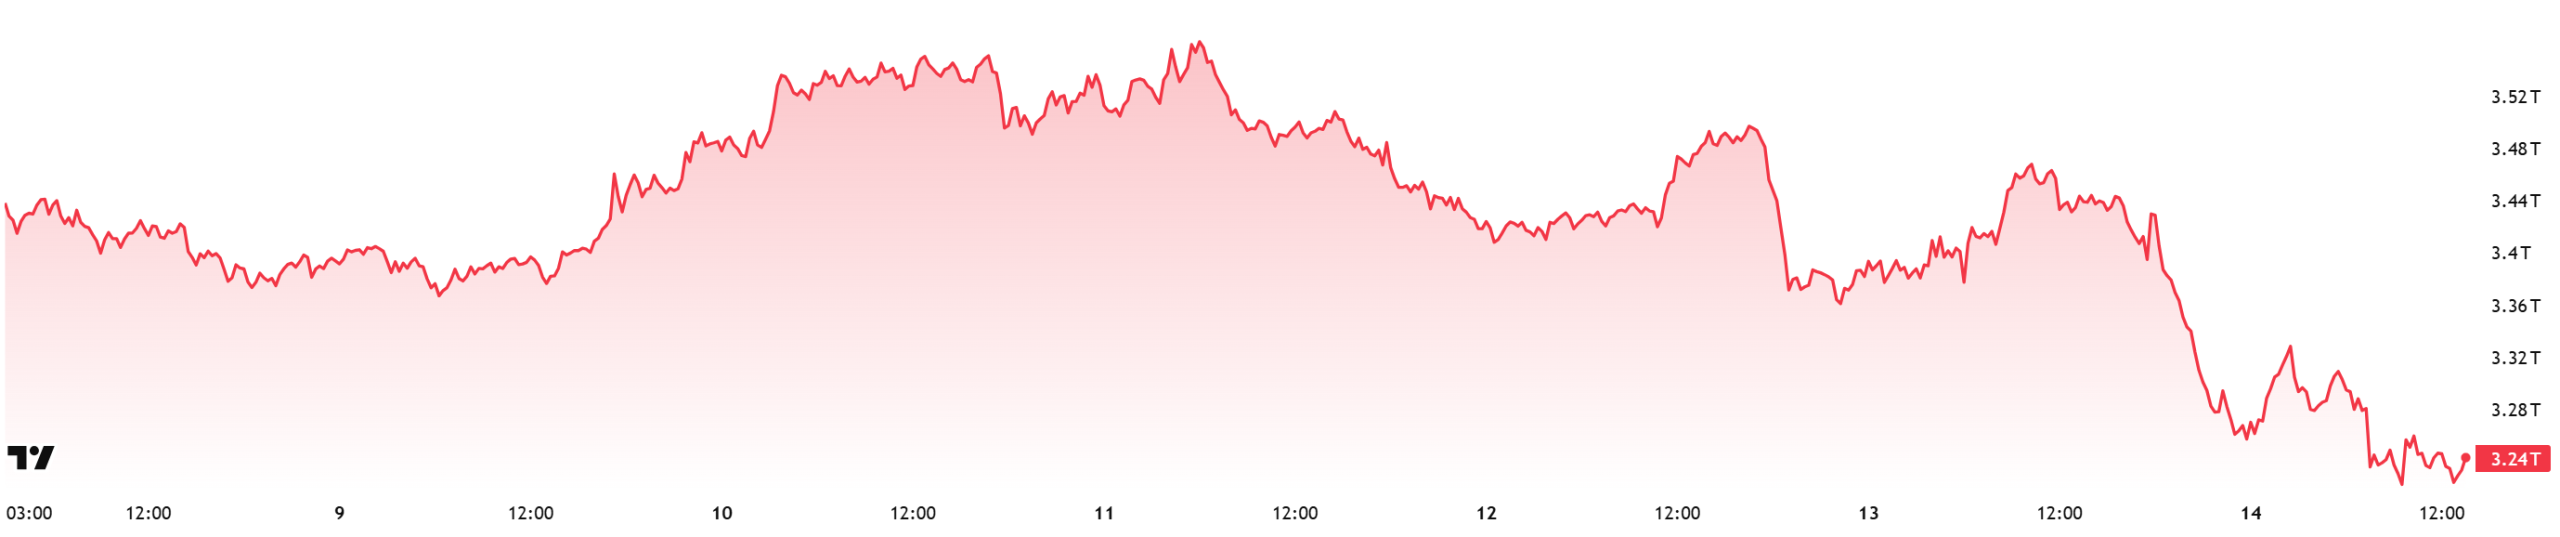
- Last Week’s Market Value:49 trillion Dollars
- This Week’s Market Value: $3.24 trillion
This week, the cryptocurrency market lost approximately $245 billion en value, declining por 7% and bringing the total market cap down to $3.24 trillion. The weekly high was recorded at $3.59 trillion, while the lowest level was $3.19 trillion. Thus, the market was observed to move within a band of approximately $395 billion. This indicates a volatility of approximately 12.37% el a period basis. Although a narrower band formed compared to the 14.78% range seen last week, the crypto market still showed significant volatility, corresponding to the average weekly candle size.
Total 2
Starting the week with a market value of $1.4 trillion, the Total 2 index retreated por 6.92% during the week, resulting en a loss of approximately $97 billion en value and falling to $1.3 trillion. The highest level during the week was recorded at $1.45 trillion, while the lowest level was $1.28 trillion. Thus, the index moved within a fairly wide band of 167 billion dollars en total. This picture shows that Total 2 traded within a range of 13.07% for the period and, although less volatile than the previous week, it performed more volatilely than the Total index. Following the pullback experienced during this period, the Total 2 index is still trading at approximately 35% below its all-time high. Considering that the average correction seen en the index during bull markets is approximately 45% — and assuming that the overall uptrend remains intact — the current levels have not yet reached potential bottoming zones, but the likelihood of this happening soon is increasing.
Total 3
Starting the week with a market value of $0.966 trillion, Total 3 fell por approximately $50 billion during the week, a decline of 5.19%, bringing the period to $0.916 trillion. The difference between the highest and lowest values during the week was 11.8%. According to this calculation, Total 3 was the most stable index this week, which is quite interesting.
While the market generally presented a negative outlook, the strongest performance surprisingly came from the Total 3 index. This situation may be a signal that should not be ignored, as it could fuel hopes for the start of the expected altcoin season if the current pullback recovers. On the other hand, the possibility remains that this outlook for the Total 3 index stems from the impact of the decline en Ethereum’s total market share during the same period.
Altcoin Season Index
Source: Coinmarketcap
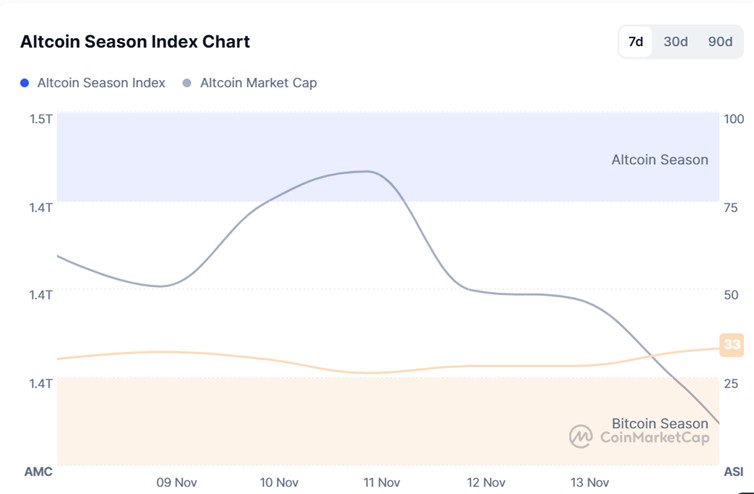
Last Week’s Index Value: 30/100
This Week’s Index Value: 33/100
Between November 7 and November 14, 2025, there was a slight increase en the correlation between altcoin market dominance (Altcoin Market Cap) and the Altcoin Season Index. The graph shows that this week, el November 13 , the index rose slightly to 33, with Altcoin Market Cap reaching 1.45T. The top 5 coins leading the rise when the index rose this week were Aster, Zec, Soon, M, and Dash. On November 11, the index rose from 26 to 33, indicating a short-term upside potential for the altcoin season. However, rises below 1.78T indicate that a sustained uptrend has not materialized.
Bitcoin Dominance
Source: Tradingview
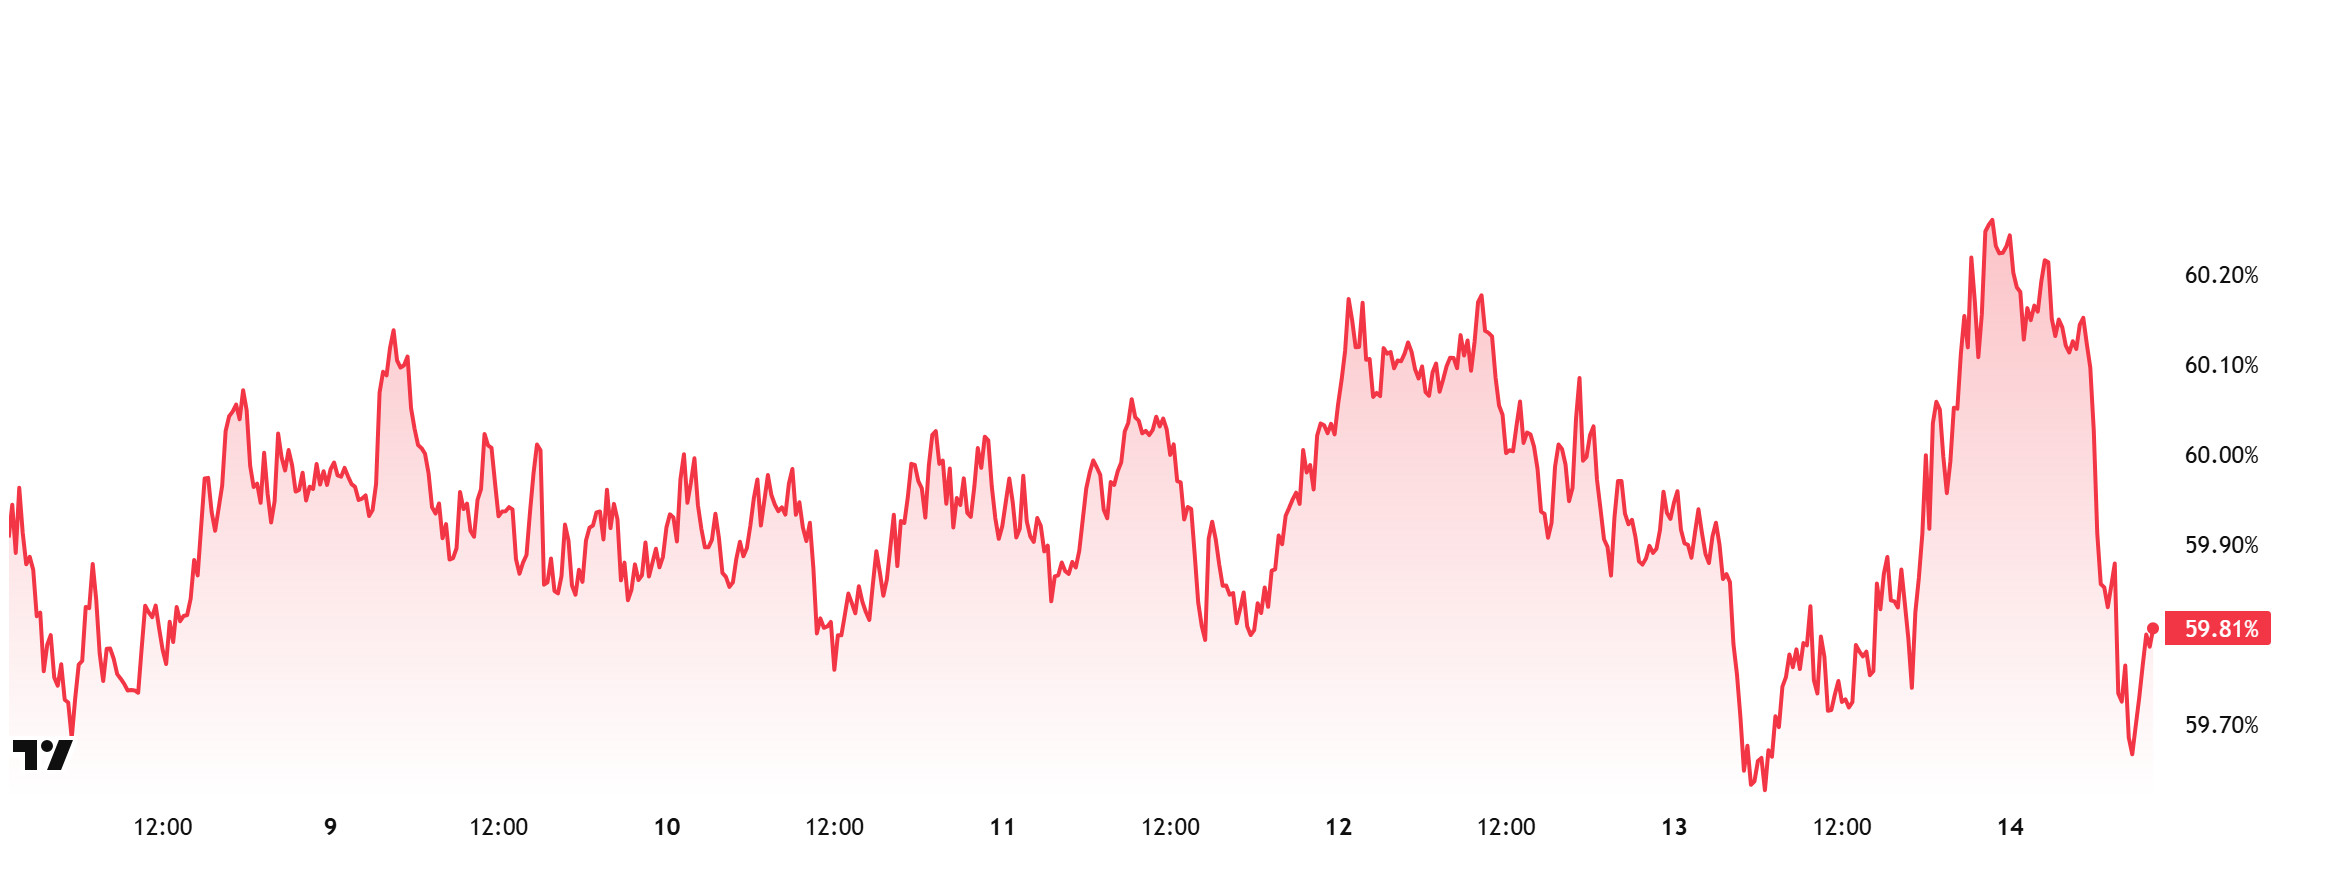
Bitcoin Dominance
Bitcoin dominance started the week at 59.90%. Although it rose to 60.25% during the week, it subsequently retreated slightly and is currently at 59.81%.
This week, Strategy purchased 487 Bitcoins. The lack of significant balance increases en Bitcoin treasury companies other than Strategy indicates that companies have adopted a cautious stance en their buying strategies during this period. Additionally, data el Bitcoin spot ETFs shows that a total of $622.7 million en net outflows have occurred to date.
The slowdown en Bitcoin purchases por institutional investors continued this week, while retail investors trading through the ETF channel were observed to be taking more sell positions. The ongoing uncertainty en the markets is weakening fund inflows into crypto assets and limiting the buying momentum en Bitcoin. Recent net outflows en spot ETFs indicate that selling pressure could increase en the short term. However, despite all these conditions, Bitcoin appears to be showing more resilient performance en the short term compared to Ethereum and other major altcoins. In the current climate of ongoing uncertainty, if institutional demand continues to grow cautiously, BTC dominance is likely to maintain its strong position and continue a horizontal consolidation process en the 58% – 61% range.
Ethereum Dominance
Source: Tradingview
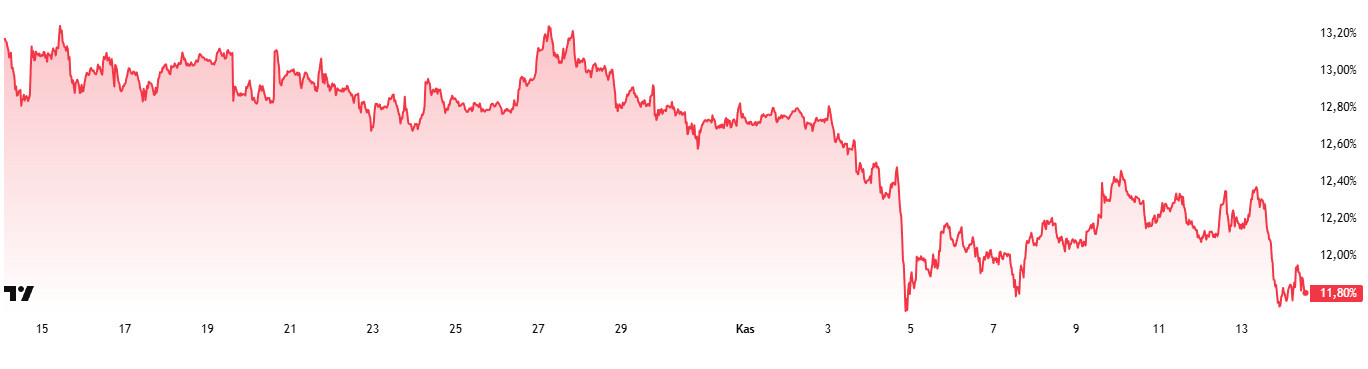
Weekly Change:
- Last Week’s Level: 12.40%
- This Week’s Level: 11.80%
Ethereum dominance, which rose to 15% levels en mid-August, lost momentum en the following period and entered a downward trend, which continues as of this week.
Accordingly, Ethereum dominance ended last week at 12.40%, and based el current data, it is trading at approximately 11.80%.
During the same period, Bitcoin dominance also followed a negative trend similar to Ethereum.
The key developments affecting Ethereum dominance are as follows:
SharpLink (SBET) announced that its Ethereum staking program generated 492 ETH en rewards last week. It was stated that a total of 7,067 ETH en rewards have been distributed since the program’s launch el June 2, 2025. The company plans to gradually expand its staking operations.
Republic Technologies (CSE: DOCT) secured $100 million en zero-interest convertible bond financing to grow its Ethereum staking and reserve business. The company stated that over 90% of the funds raised will be used to purchase ETH, with an initial investment of $10 million.
Ethereum Foundation AI Lead Davide Crapis shared the dAI team’s 2026 roadmap, which is shaped around the ERC-8004 and x402 standards. The new plan aims to increase integration between artificial intelligence and el-chain payments.
Bitcoin Spot ETF
Source: Darkex Research Department
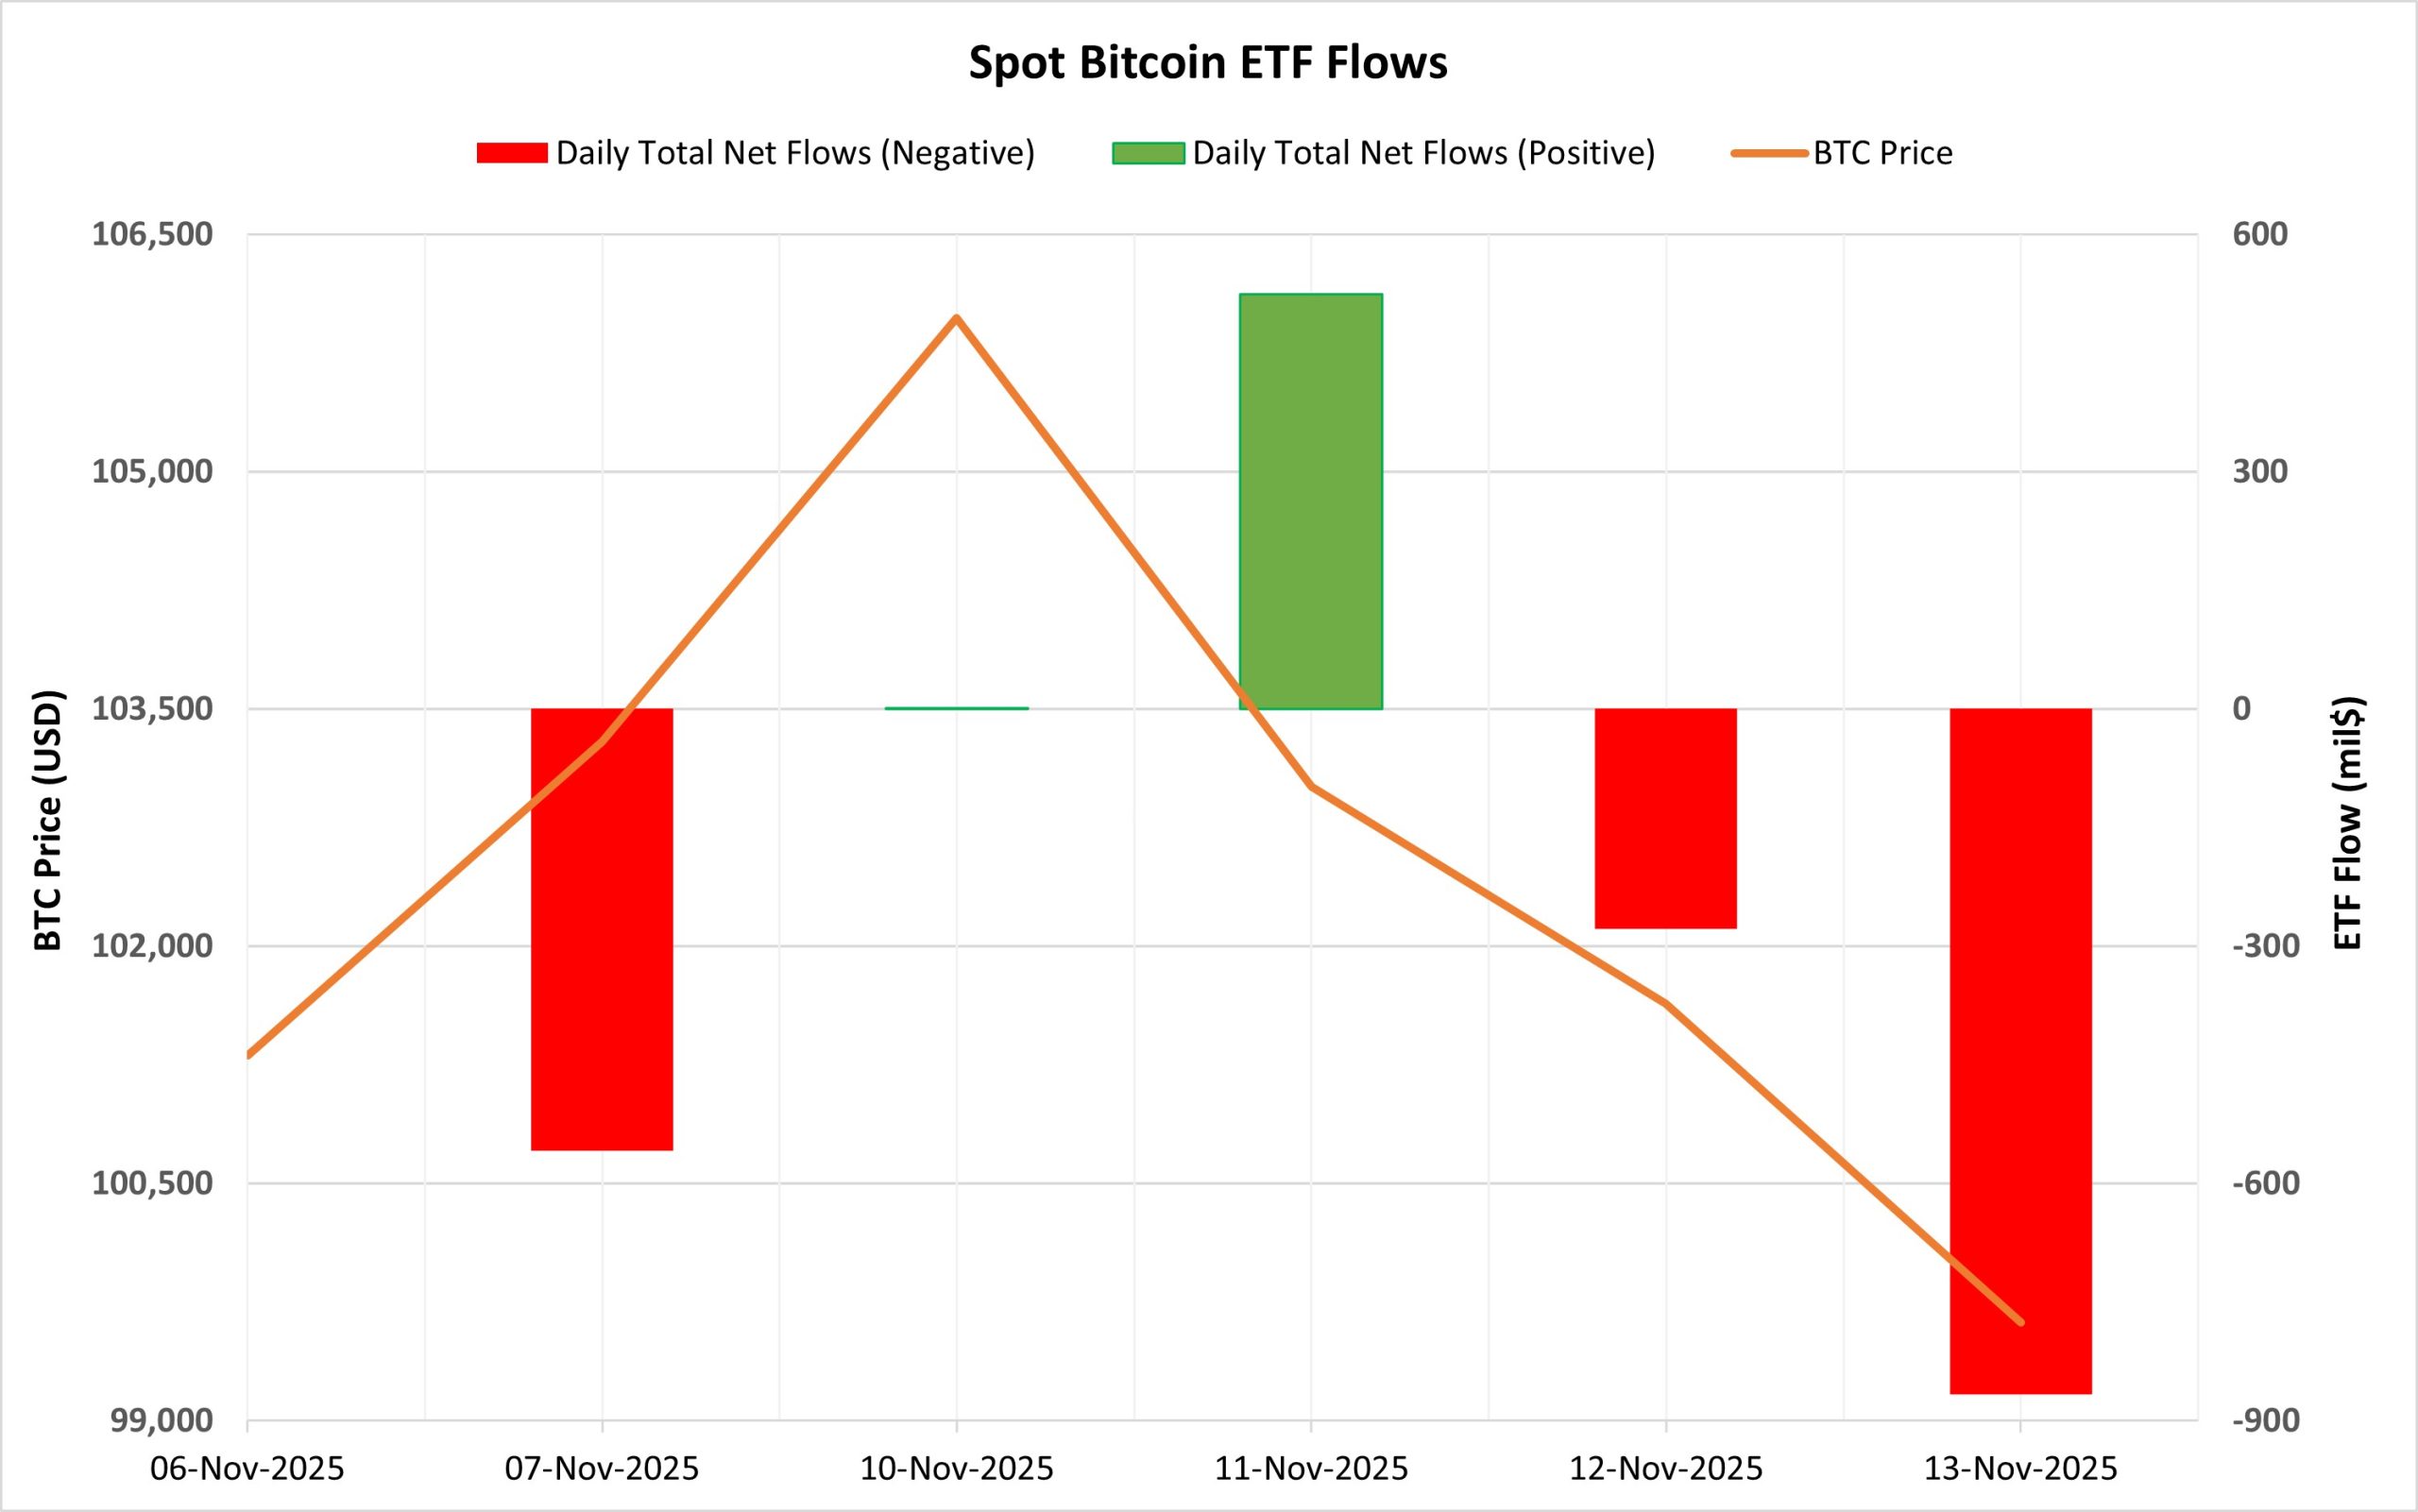
Netflow Status: Between November 7 and 13, a total of $1.178 billion en net outflows occurred from Spot Bitcoin ETFs. High outflows el November 7 and November 13 were particularly noteworthy during this period. Although a strong inflow of $524 million el November 11 signaled a brief recovery, sharp outflows over the next two days completely erased this effect. The largest outflows por fund occurred at Grayscale, BlackRock, and Fidelity.
Bitcoin Price: Bitcoin opened at $101,307 el November 7 and closed at $99,621 el November 13. During this period, the BTC price lost 1.66% of its value. The price decline accelerated after November 11, with selling pressure following strong inflows disrupting market equilibrium. Price movements remained negative alongside ETF outflows.
Cumulative Net Inflow: By the end of the 463rd trading day, the cumulative total net inflow into Spot Bitcoin ETFs had declined to $59.325 billion.
| Date | Coin | Open | Close | Change (%) | ETF Flow (mil$) |
|---|---|---|---|---|---|
| 07-Nov-2025 | BTC | 101,307 | 103,290 | 1.96% | −558.4 |
| 10-Nov-2025 | BTC | 104,733 | 105,970 | 1.18% | 1.2 |
| 11-Nov-2025 | BTC | 105,970 | 103,009 | −2.79% | 524 |
| 12-Nov-2025 | BTC | 103,009 | 101,635 | −1.33% | −278.1 |
| 13-Nov-2025 | BTC | 101,635 | 99,621 | −1.98% | −866.7 |
| Total for Nov 7–13, 2025 | −1.66% | −1,178.0 | |||
Negative ETF flows dominated during this period. Although the strong inflows el November 11 briefly boosted market confidence, the subsequent high outflows completely erased this effect. Macroeconomic uncertainties, en particular, created downward pressure el prices. In the coming period, a renewed acceleration en fund inflows could create a recovery ground for Bitcoin. However, if negative flows persist, price pressure could deepen and BTC prices could continue to decline en the short term.
Ethereum spot ETF
Source: Darkex Research Department
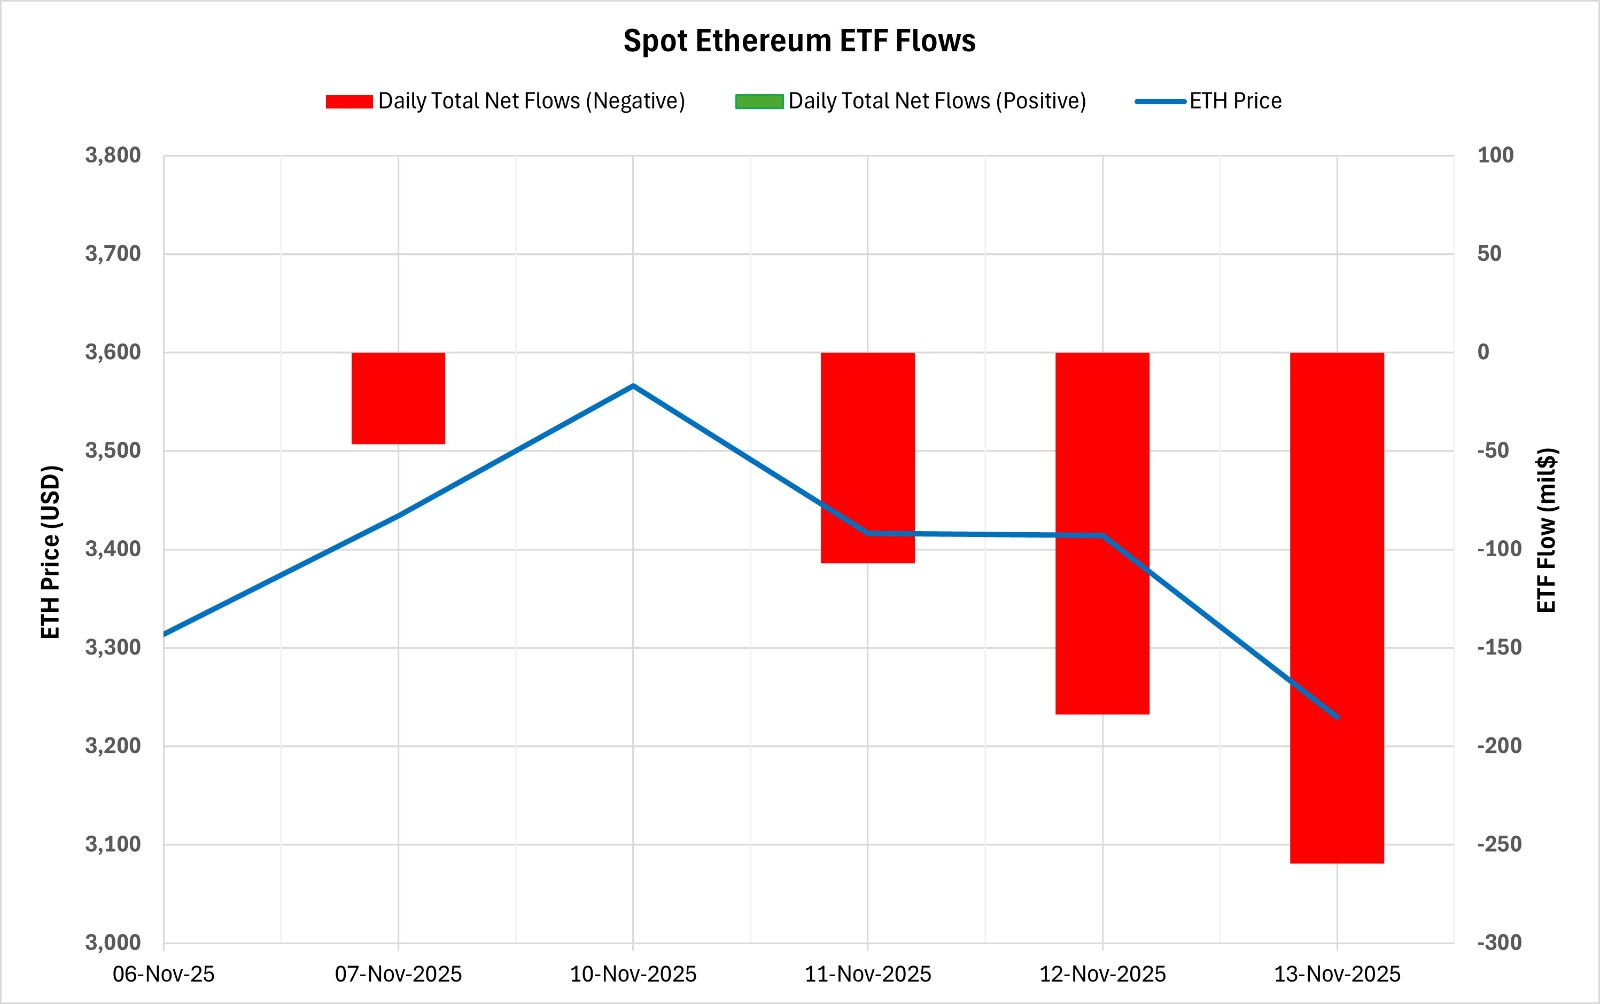
Between November 7-13, 2025, Spot Ethereum ETFs saw a total net outflow of $597 million. During this period, there were no positive flows for five consecutive trading days, while the negative flow series rose to three days. The strongest outflows por fund were el the BlackRock ETHA and Grayscale ETHE sides. By the end of the 331st trading day, the cumulative total net inflow for Spot Ethereum ETFs had declined to 13.33 billion dollars.
| Date | Coin | Open | Close | Change (%) | ETF Flow (mil$) |
|---|---|---|---|---|---|
| 07-Nov-2025 | ETH | 3,314 | 3,434 | 3.64% | −46.6 |
| 10-Nov-2025 | ETH | 3,584 | 3,566 | −0.50% | 0 |
| 11-Nov-2025 | ETH | 3,566 | 3,416 | −4.21% | −107.1 |
| 12-Nov-2025 | ETH | 3,416 | 3,414 | −0.06% | −183.7 |
| 13-Nov-2025 | ETH | 3,414 | 3,229 | −5.41% | −259.6 |
| Total for Nov 7–13, 2025 | −2.54% | −597.0 | |||
Ethereum opened at $3,314 el November 7 and closed at $3,229 el November 13. During this period, the ETH price lost 2.54% of its value. The price decline observed between November 11 and 13, particularly, signaled a weakening of market confidence, also influenced por ETF outflows. Price movements during this period, when institutional investors maintained a cautious stance, paralleled the weak outlook en flows. If inflows regain momentum en the coming days, a short-term price recovery could be seen en the Spot Ethereum ETF market. However, if the outflow trend continues, selling pressure el Ethereum could intensify.
Bitcoin Options Distribution
Source: Laevitas
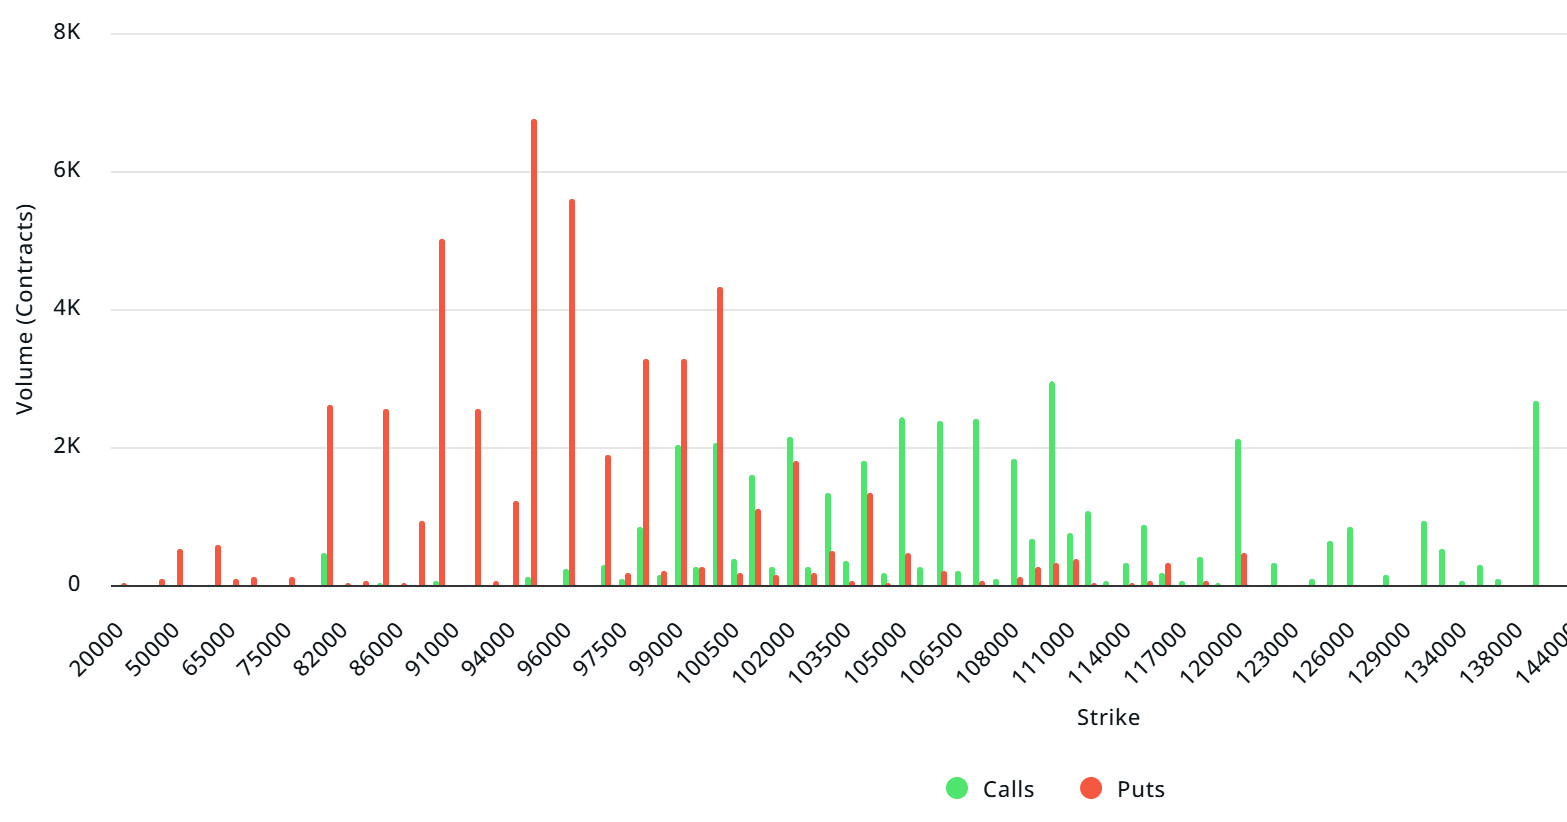
BTC: Notional: $3.98B | Put/Call: 0.62 | Max Pain: $105K
Deribit Data: Deribit data shows that BTC option contracts with a notional value of approximately $3.98 billion expire today. At the same time, looking at the risk transformation over the next week based el the last 24 horas’ data, put options are more dominant than call options en terms of hedging risk. When examining expected volatility (IV), it is above realized volatility (RV). On the other hand, the positive spread metric indicates increased risk appetite en the market and shows that put options are cheap. Skew values are pointing downward today and for the coming week.
Laevitas Data: Examining the chart, we see that put options are concentrated en a wide band between $80,000 and $100,000. Call options, el the other hand, are concentrated between $99,000 and $120,000, with concentration decreasing towards higher levels. At the same time, the $100,000 level appears to be resistance, while the $95,000 level appears to be support. On the other hand, there are 6.7K put options at the $95,000 level, peaking here, with a decrease en put volume observed after this level. Furthermore, 2.96K call option contracts peak at the $110,000 level. Looking at the options market, we see that put contracts dominate el a daily and weekly basis.
Option Maturity:
Call/Put Ratio and Maximum Pain Point: Looking at the options en the latest 7-day data from Laevitas, the number of call options decreased por approximately 16% compared to last week, reaching 155.8K. In contrast, the number of put options decreased por 10% compared to last week, reaching 136.73K. The put/call ratio for options is set at 0.62. This indicates that there is less demand for call options than put options among investors. Bitcoin’s maximum pain point is seen at $105,000. BTC is currently priced at $97,500 el , and if it fails to break above the pain point of $105,000, a continued decline is foreseeable.
Ethereum Options Distribution
Source: Laevitas
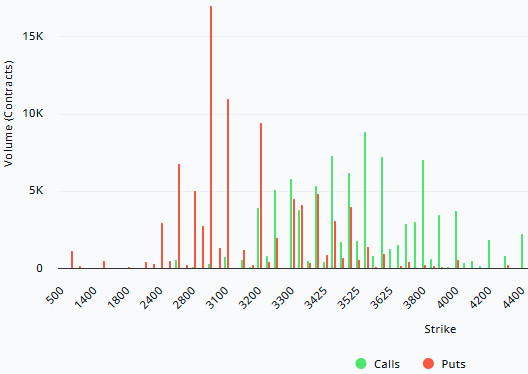
ETH: $743M notional | Put/Call: 0.64 | Max Pain: $3,500
Laevitas Data: Looking at the data en the chart, we see that put options are concentrated en a fairly wide band, particularly between the $3,000 and $3,400 price levels. The highest put volume is at the $3,000 level, with approximately 17K contracts. On the other hand, a notable concentration en call options is observed between the $3,300 and $3,550 levels. The $3,550 level, en particular, stands out with a high call volume of approximately 9K contracts. We can consider this level as a significant resistance zone en the market.
Deribit Data: First, we see that ATM volatility has reached 93.11, showing an increase of over 33%. Such a sharp jump en volatility en daily data generally occurs when there is uncertainty en the market; therefore, we can say that traders expect a more aggressive price movement en the short term. The 25 delta risk reversal falling to -27.1 and declining por over 27% el a daily basis also supports this. We see that the market is paying much higher premiums for put options rather than call options. This clearly reflects the expectation of “selling pressure may come” en option pricing.
Looking at volumes, while there is a slight increase el the call side, the main point of interest is the rise en put volume exceeding 100%. This situation indicates either that downward expectations en the market have strengthened or that existing long positions are being heavily hedged. In other words, investors are leaning towards protection rather than taking risks.
The total open interest stands at $751M with a slight decline; however, given that overall OI remains high, we cannot say there is an exit from the market. We see increased uncertainty and downward risks being priced en much more aggressively.
Option Expiration:
Ethereum options with a nominal value of $743 million expired el November 14. The Max Pain level was calculated at $3,500, while the put/call ratio stands at 0.64.
Legal Notice
The investment information, comments, and recommendations contained en this document do not constitute investment advisory services. Investment advisory services are provided por authorized institutions el a personal basis, taking into account the risk and return preferences of individuals. The comments and recommendations contained en this document are of a general nature. These recommendations may not be suitable for your financial situation and risk and return preferences. Therefore, making an investment decision based solely el the information contained en this document may not result en outcomes that align with your expectations.
