
Weekly Fundamental Analysis Report
Fear & Greed Index
Source: Alternative
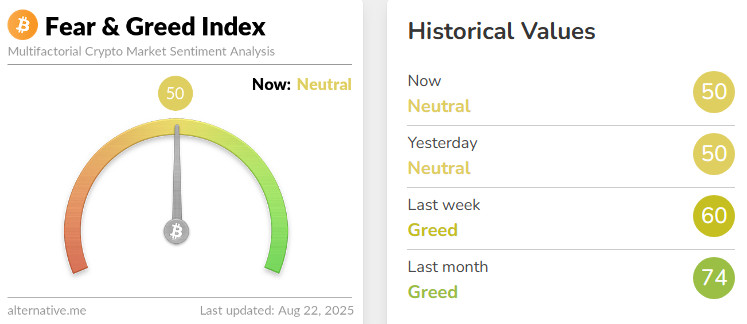
Change en Fear and Greed Value: -10
Last Week’s Level: 60
This Week’s Level: 50
The Fear and Greed Index closed the week at 50, down from 60, signaling a significant weakening en risk appetite. Strong inflows into crypto assets initially supported sentiment throughout the week. In particular, the concentration of 77% of flows en Ethereum products created a short-term positive sentiment, but the structure clustered around a single provider and product increased fragility. Concurrently, the extension of decision-making timelines for major exchange applications en the regulatory arena elevated uncertainty and constrained crypto-specific optimism. While the annual CPI en Europe remained stable at 2.0%, alleviating regional inflation concerns, it failed to significantly boost global risk appetite. In the UK, discussions regarding retail investors’ access to crypto ETNs emerged as a potential positive headline but had a limited impact. In the segundo half of the week, minutos released el the monetary policy front highlighted upside risks to inflation, dampening expectations for aggressive rate cuts. Signs of softening en labor market indicators did not completely eliminate expectations of easing, but they did raise questions about the growth outlook. Preliminary PMI data released en the final section pointed to strong growth momentum and a renewed uptick en selling prices. Renewed price pressures and a wait-and-see stance ahead of Jackson Hole kept risk appetite under pressure. As a result, the impact of crypto-specific positive flows was offset por regulatory uncertainty and the strengthening inflation theme el the macro side, leading the index to retreat to the “Neutral” zone.
Fund Flow
Source: Coin Shares
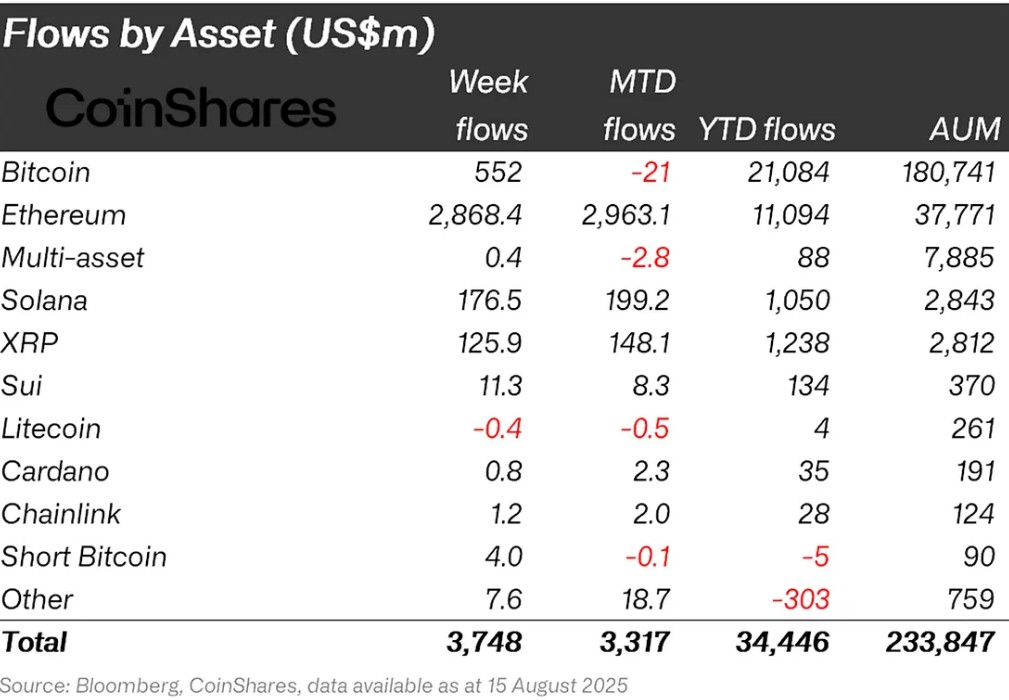
Overview: The crypto market entered a weak phase due to increasing macroeconomic uncertainties and weakening expectations of interest rate cuts en the Fed’s ongoing discussions. During this period, U.S. President Donald Trump’s statements during his meeting with Putin en the U.S. el August 15 regarding the possibility of peace en the Russia-Ukraine war created a short-term upward movement en Bitcoin. However, despite this optimism, the overall negative sentiment en the market prevailed, and Bitcoin lost approximately 4% of its value.
Bitcoin (BTC): This week, inflows into Bitcoin-focused funds reached $552 million.
Ethereum (ETH): Spot ETH continued to perform strongly, driven por institutional interest and fund inflows. This week, Ethereum saw inflows of 2,868.4 million dollars.
Multi-asset: Despite ETF data, inflows were observed en the multi-asset group.
Ripple (XRP): Access to XRP for institutional investors has been facilitated. This week, fund inflows into XRP reached 125.9 million dollars.
Solana (SOL): A significant step for the Solana network, a consensus innovation named “Alpenglow” was introduced. If adopted, this update will introduce a millisecond consensus period el the network, resulting en $176.5 million en inflows.
SUI: In recent weeks, institutional investors, including Swiss-based banks, have initiated conversion efforts for Sui. This week, Sui saw an inflow of 11.3 million dollars.
Cardano (ADA): Grayscale’s steps toward launching an ADA-based exchange-traded fund (ETF) are creating optimism en the market. This week, Cardano saw an inflow of 0.8 million dollars.
Other: Sector-specific and project-based gains were observed en altcoins. These gains brought en 7.6 million dollars en fund inflows.
Short Bitcoin: A total of 4.0 million dollars flowed into short Bitcoin positions.
Fund Outflows:
Litecoin (LTC): While the weak outlook for LTC continues, an outflow of 0.4 million dollars was observed.
Total Market Cap
Source: Tradingview
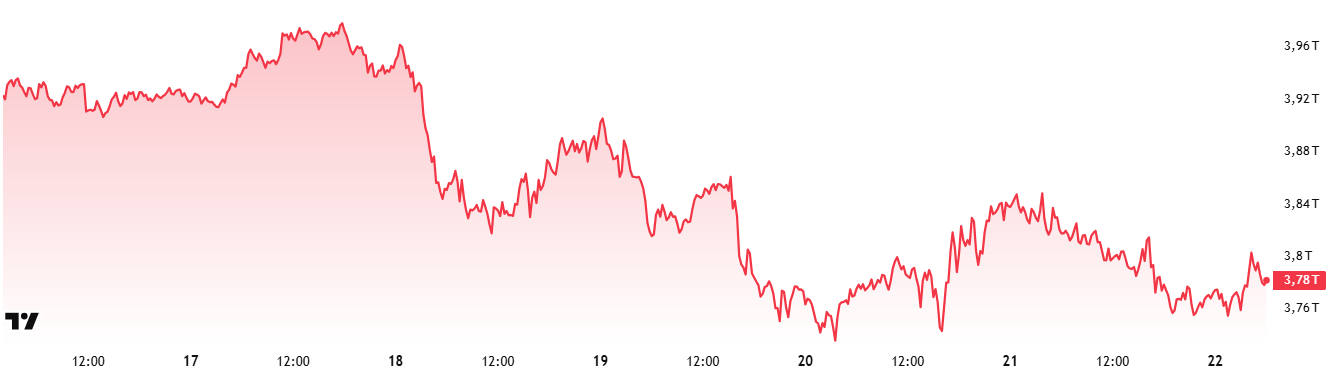
- Last Week’s Market Value:95 Trillion Dollars
- This Week’s Market Value:78 Trillion Dollars
The cryptocurrency market recorded a 4.3% decline en total market value this week, accompanied por a capital outflow of approximately $170 billion. With this development, the market value fell to $3.78 trillion. During the week, the value dropped to $3.73 trillion, falling to its 2024 peak. This volatility is creating uncertainty about whether the market is entering a downtrend or will continue its upward trend por testing previous highs.
Total 2
The Total 2 index, which started the week with a market value of $1.6 trillion, fell por 3.91% during the week, losing approximately $63 billion and falling to $1.54 trillion. Despite falling to $1.48 trillion el a weekly basis, it did not remain at this level. The index remains approximately 170 billion dollars (12%) below its all-time high.
Total 3
The Total 3 index started the week with a market value of $1.06 trillion. During the week, it experienced a loss of approximately $41.17 billion en value and fell por 3.89% to $1.02 trillion. Although it fell below the $1 trillion level during the week, it did not remain below this level due to rebound buying.
While the overall market followed a negative trend, the strongest performance was observed en the Total 2 index. This indicates that the large altcoin market led por Ethereum is showing a more robust outlook compared to other segments. When comparing performances, it can be noted that the share of altcoins under the Ethereum umbrella en the total market expanded significantly this week.
Altcoin Season Index
Source: Coinmarketcap
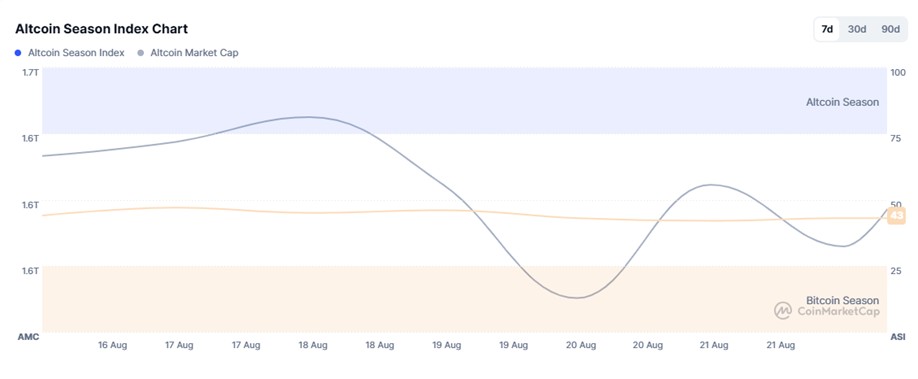
- Last Week’s Index Value: 45/100
- This Week’s Index Value: 43/100
Between August 18 and August 22, 2025, an increase was observed en the correlation between altcoin market dominance (Altcoin Market Cap) and the Altcoin Season Index. The graph shows that the index reached its highest point el August 18, hitting 45, with the Altcoin Market Cap reaching 1.65T. This indicates an increase en altcoin market dominance. The top 5 coins leading the upward trend this week were OKB, Pengu, AERO, CFX, and ENA. Although the index dropped from 45 to 42 el August 21, the total 7-day value indicates a potential for a short-term revival during the altcoin season and that the total market value of altcoins has made relative progress compared to Bitcoin.
Bitcoin Dominance
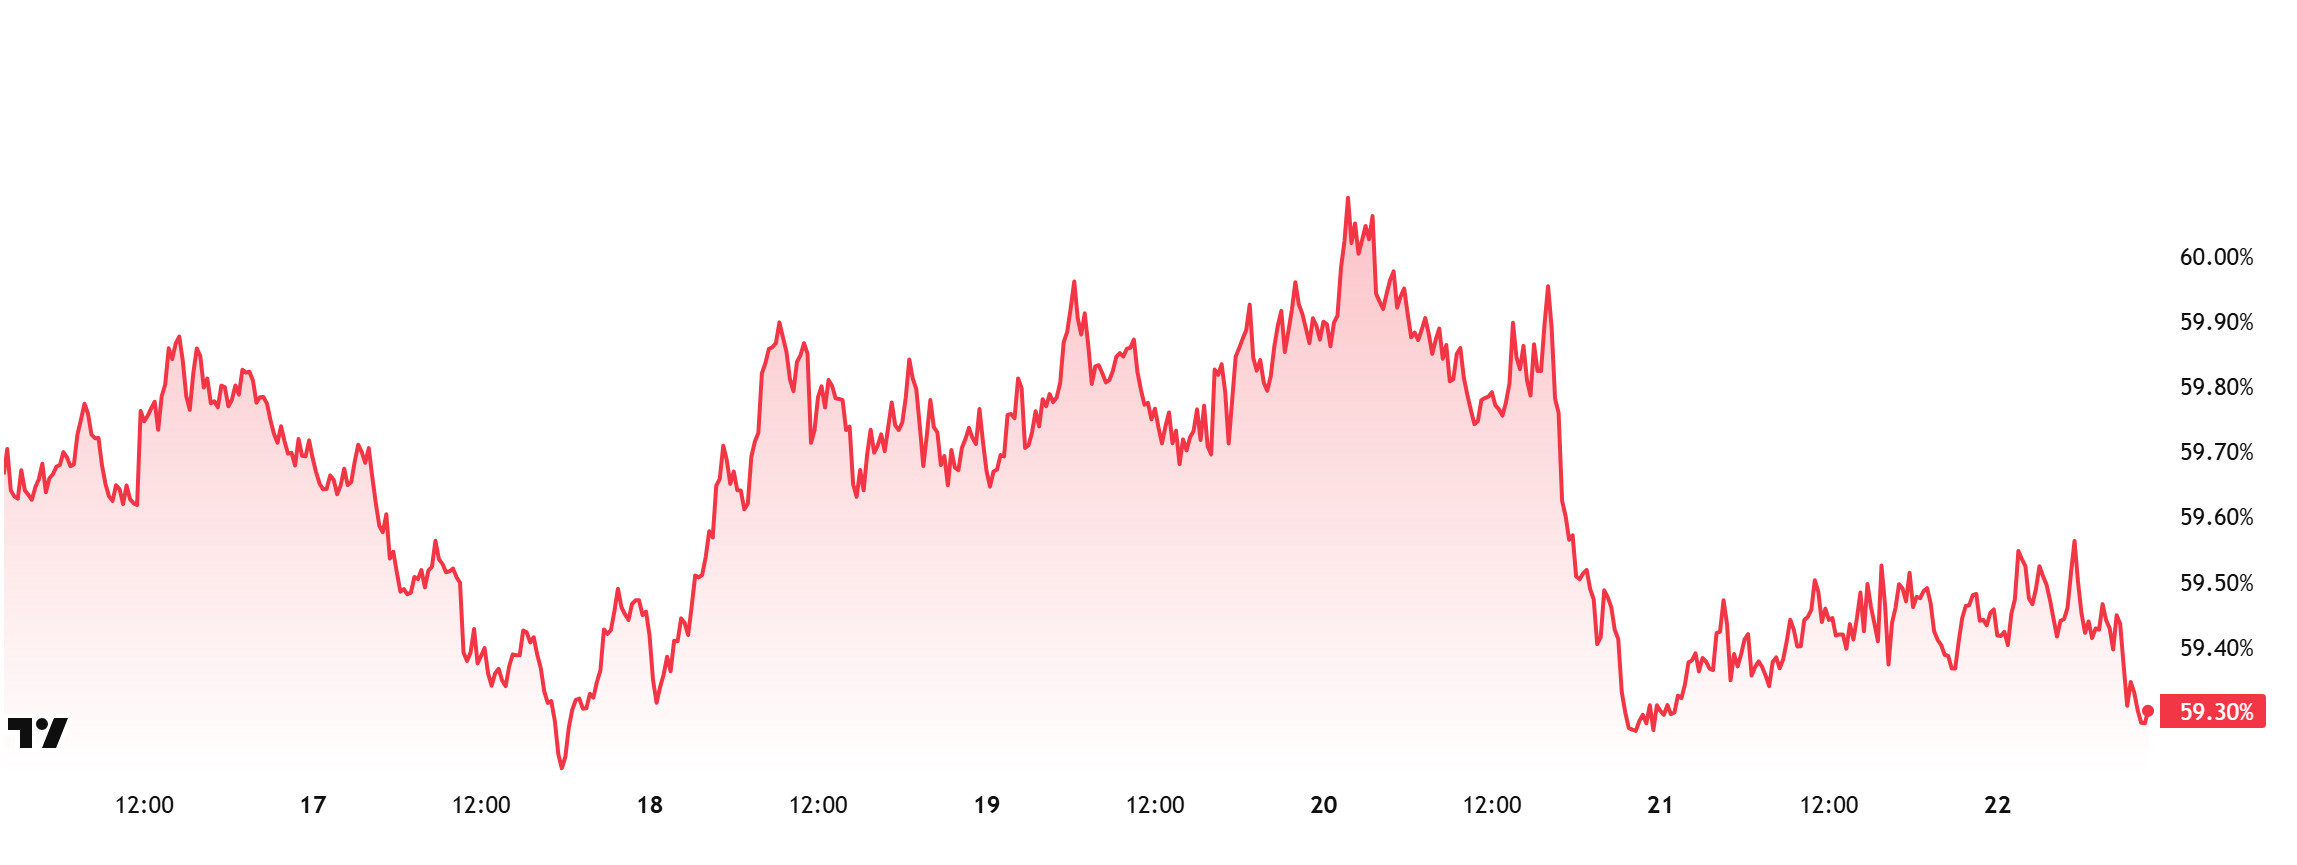
Bitcoin Dominance
Bitcoin dominance started the week at 59.40%, rose to 60.13% during the week, but then fell slightly and is currently at 59.30%.
This week, Strategy purchased 430 Bitcoin, Metaplanet purchased 775 Bitcoin, and H100 Group purchased 102 Bitcoin.
Data el Bitcoin spot ETFs indicates that a total of 1.15 billion dollars en net outflows have occurred to date.
The United States and the European Union (EU) have announced the details of the trade agreement they reached last month. The joint statement includes comprehensive regulations el customs tariffs, energy purchases, technology cooperation, and strategic investments. Accordingly, starting September 1, the US will impose a 15% customs duty el most imports from the EU (including automobiles, pharmaceuticals, semiconductors, and lumber). However, the US has agreed to reduce automobile tariffs once the EU’s “tariff reduction law” comes into effect.
These developments el both sides are increasing risk appetite among retail investors, paving the way for buy-side transactions en spot ETFs. Additionally, institutional investors continue to enter the market.
Despite recent positive developments, capital outflows have been observed not only en Bitcoin but also en Ethereum and other altcoins. By the end of this week, Ethereum has outperformed Bitcoin, showing a better performance. This situation further increases expectations of a decline en Bitcoin’s market dominance, with Bitcoin dominance expected to consolidate en the 58%–60% range next week.
Ethereum Dominance
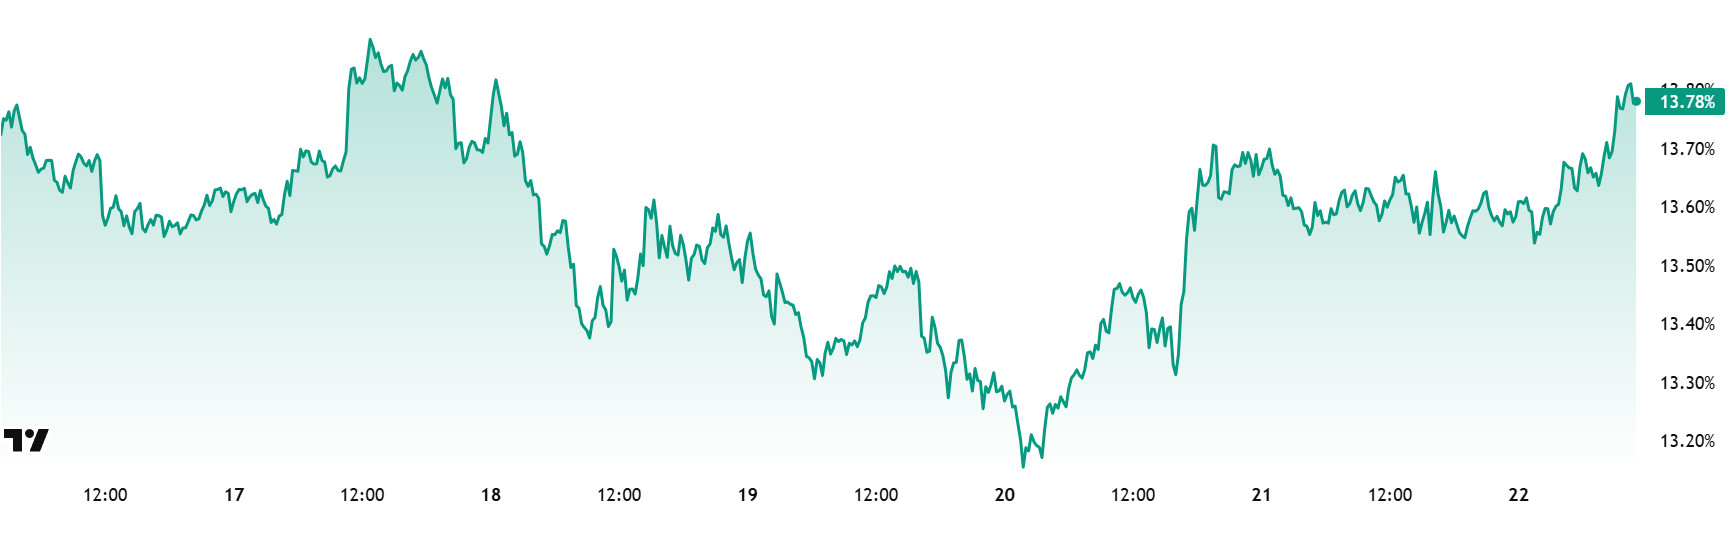
Source: Tradingview
Weekly Change:
- Last Week’s Level:72%
- This Week’s Level:78%
Ethereum dominance, which rose to 12% por the end of July, failed to break through this critical threshold and retreated to 11.39%. However, finding support at these levels, dominance regained positive momentum and has been showing a steady upward trend over the past three weeks.
In this context, Ethereum dominance closed the past week at 13.72% and is currently trading at approximately 13.78% based el the latest data.
During the same period, Bitcoin dominance, unlike Ethereum, followed a negative trend and showed a downward trend.
Looking at the key developments affecting Ethereum dominance, notable steps have also been taken el the institutional buying front. BitMine Immersion Technologies, listed el the New York Stock Exchange, has increased its crypto assets to $6.612 billion as part of its Ethereum-based treasury strategy.
Bitcoin Spot ETF
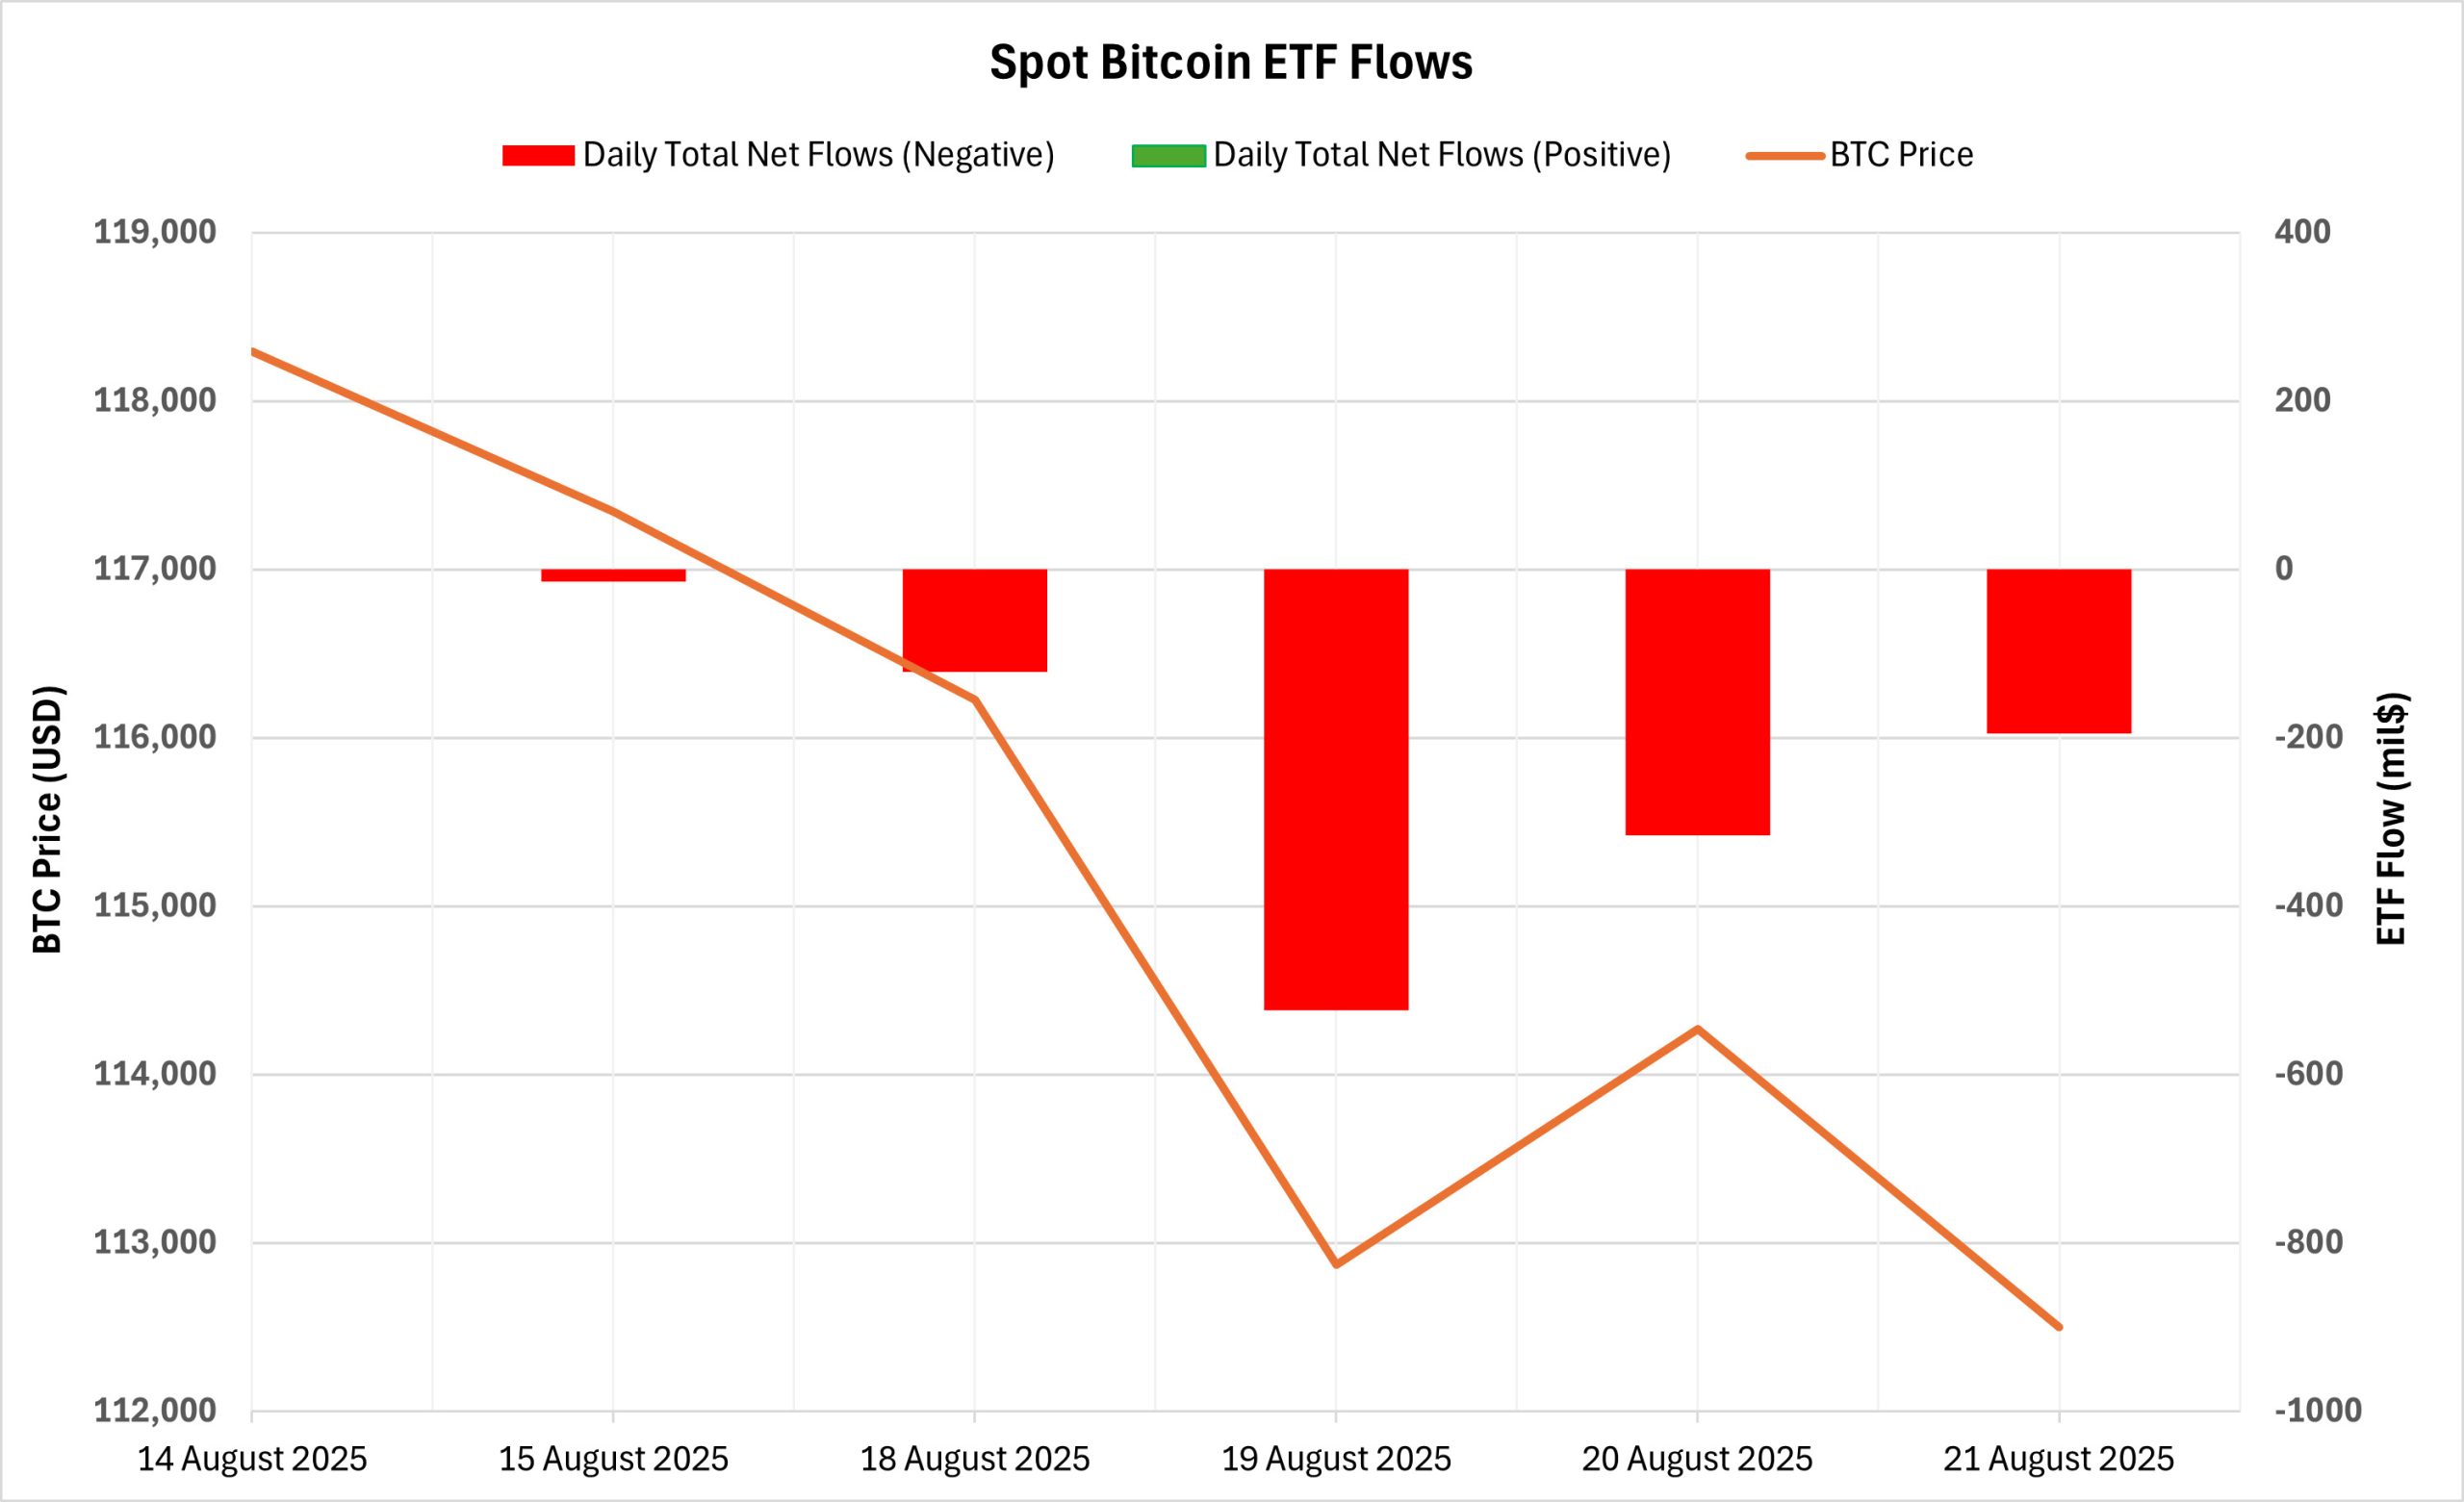
Netflow Status: Between August 15-21, 2025, approximately $1.17 billion en net outflows occurred from Spot Bitcoin ETFs. The sharpest outflow was recorded el August 19 at 523.3 million dollars. Notably, during this period, net outflows of 301.8 million dollars from the BlackRock IBIT ETF, 294.7 million dollars from the Ark ARKB ETF, and 286.2 million dollars from the Fidelity FBTC ETF stood out. During this period, a positive net inflow streak that had continued for seven consecutive trading days came to an end el August 15 with an outflow of $14.1 million. This development marked the formation of a negative net outflow streak spanning five consecutive trading days.
Bitcoin Price: Bitcoin, which started at $118,295 el August 15, closed at $112,500 el August 21. During this period, the BTC price lost approximately 4.90% of its value. The sharpest daily decline was recorded el August 19 at 2.89%. Although a brief recovery was observed el August 20, the period was marked por heavy selling pressure.
Cumulative Net Inflow: As of the 404th trading day, the total cumulative net inflow for Spot Bitcoin ETFs has declined to $53.8 billion.
| Date | Coin | Open | Close | Change | ETF Flow ($M) |
|---|---|---|---|---|---|
| 15-Aug-25 | BTC | 118,295 | 117,342 | -0.81% | -14.1 |
| 18-Aug-25 | BTC | 117,405 | 116,227 | -1.00% | -121.7 |
| 19-Aug-25 | BTC | 116,227 | 112,872 | -2.89% | -523.3 |
| 20-Aug-25 | BTC | 112,872 | 114,271 | 1.24% | -315.9 |
| 21-Aug-25 | BTC | 114,271 | 112,500 | -1.55% | -194.4 |
| Total for August 15–21, 2025 | -4.90% | -1,169.4 | |||
The period between August 15 and 21 was a very weak period for the Spot Bitcoin ETF market. With the end of the 7-day positive net inflow series, investors’ cautious stance was clearly visible. The sharp outflows that occurred during this period, which began with intense selling pressure, indicate that macroeconomic uncertainties and Bitcoin price volatility have reduced institutional investors’ risk appetite. Consecutive outflows from major ETF providers such as BlackRock, Fidelity, Ark, and Grayscale further dampened the overall market sentiment. For ETF inflows to resume a positive trend en the coming period, price stabilization and a reduction en macroeconomic uncertainties are critical. If institutional investors re-enter the market, this could spark a new upward momentum en BTC prices
Spot Ethereum ETF
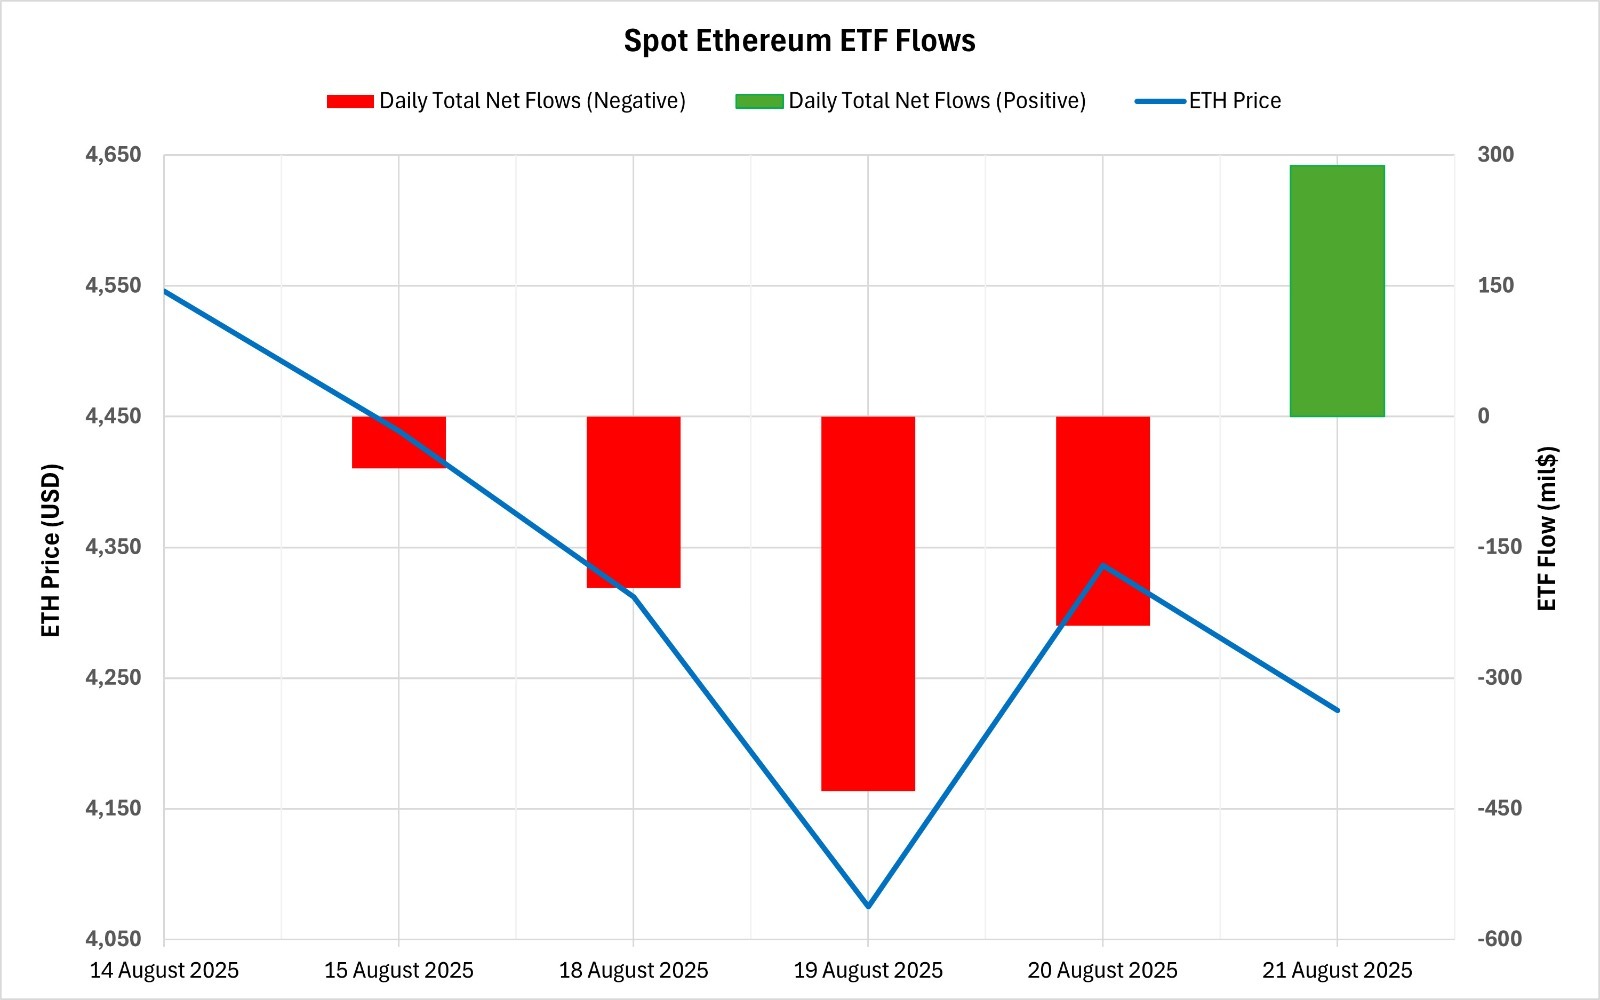
Between August 15 and 21, 2025, a total of $638.1 million en net outflows occurred from Spot Ethereum ETFs. The week’s sharpest outflow was recorded el August 19 at $429.6 million. Notably, the eight-day positive net inflow series ended el August 15 with an outflow of $59.3 million. The subsequent four-day negative outflow series also ended el August 21 with a strong net inflow of $287.6 million. During this period, BlackRock’s ETHA ETF stood out with an inflow of $220.4 million, while high outflows from funds managed por Fidelity and Grayscale also drew attention. The total cumulative net inflow of Spot Ethereum ETFs at the end of the 272nd trading day decreased to 12.10 billion dollars.
| Date | Coin | Open | Close | Change | ETF Flow ($M) |
|---|---|---|---|---|---|
| 15-Aug-25 | ETH | 4,546 | 4,439 | -2.35% | -59.3 |
| 18-Aug-25 | ETH | 4,472 | 4,312 | -3.58% | -196.6 |
| 19-Aug-25 | ETH | 4,312 | 4,075 | -5.50% | -429.6 |
| 20-Aug-25 | ETH | 4,075 | 4,336 | 6.40% | -240.2 |
| 21-Aug-25 | ETH | 4,336 | 4,225 | -2.56% | 287.6 |
| Total for August 15–21, 2025 | -7.06% | -638.1 | |||
The Ethereum price started at $4,546 el August 15 and closed at $4,225 el August 21. During this period, a total loss of 7.06% was recorded. Although a sharp increase of 6.4% was observed el August 20, this rise was not sustained, and the price resumed its downward trend. This volatile price structure indicated that institutional investors adopted a more cautious stance amid macroeconomic uncertainty. Both the decline en Ethereum prices and the four-day net outflow series revealed investors’ risk-averse tendencies. However, the strong inflow observed el the last trading day of the week drew attention as a sign of recovery. If this recovery momentum continues, renewed inflows into Spot Ethereum ETFs could contribute to upward support for Ethereum prices.
Bitcoin Option Distribution
Source: Laevitas
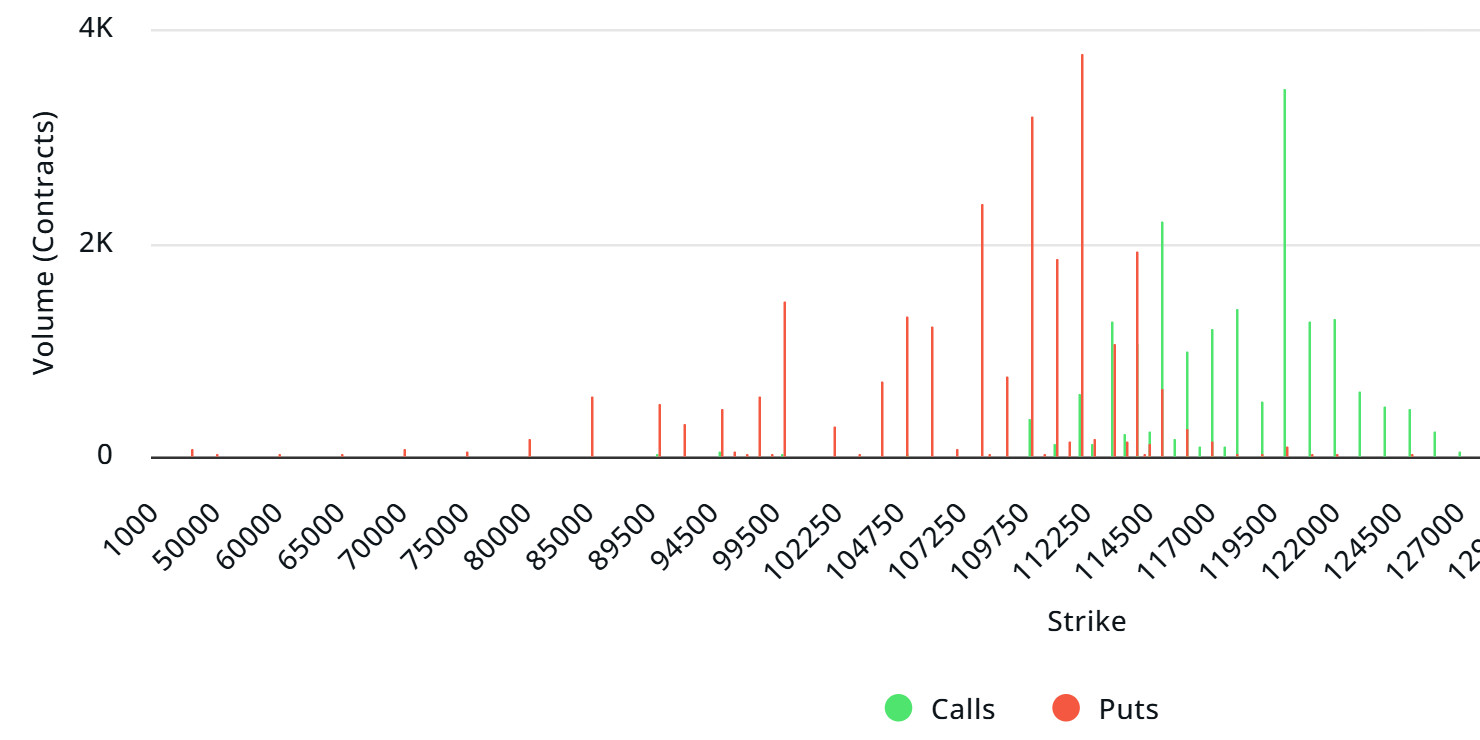
$BTC: Notional: $3.83B | Put/Call: 1.31 | Max Pain: $118K
Deribit Data: Deribit data shows that BTC option contracts with a nominal value of approximately $3.83 billion are expiring today. At the same time, looking at the risk conversion for the next week based el the last 24 horas, put options are dominating over call options en terms of risk hedging. When examining expected volatility, it is above realized volatility, indicating that put option premiums are cheap. On the other hand, the positive spread value suggests market appetite. Skew values are showing a significant downward trend today and for the coming week.
Laevitas Data: Examining the chart, we see that put options are concentrated en the 108,000–112,000 dollar range. Call options, el the other hand, are concentrated between 115,000 and 120,000 dollars, with concentration decreasing toward higher levels. Additionally, the 112,000 dollar level appears as support, while the 120,000 dollar level acts as resistance. Meanwhile, there are 3.77K put options at the 112,000 dollar level, where they peak, and a decrease en put volume is observed after this level. Meanwhile, 3,430 call option contracts peaked at the 120,000 dollar level. Looking at the options market, we see that put contracts dominate el a daily and weekly basis.
Option Maturity:
Call/Put Ratio and Maximum Pain Point: According to the latest 7-day data from Laevitas, the number of call options decreased por approximately 29% compared to last week, reaching 103,660. In contrast, the number of put options decreased por 25% compared to last week, reaching 91,200. The put/call ratio for options has been set at 1.31. This indicates that there is significantly more demand for put options than call options among investors. Bitcoin’s maximum pain point is currently at $118,000. If BTC remains priced at 112,900 USD and fails to break above the pain point of 118,000 USD, further declines are expected.
Ethereum Option Distribution
Source: Laevitas
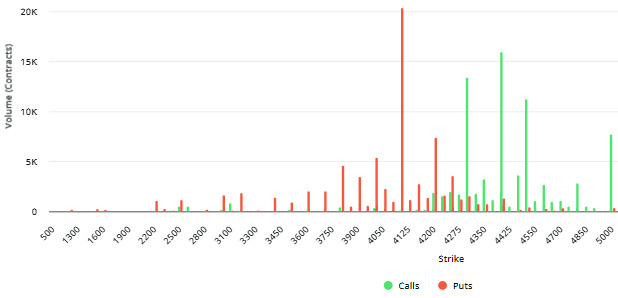
ETH: $947.2 M notional | Put/Call: 0.82 | Max Pain: $4,250
Laevitas Data: Looking at the data en the chart, we see that put options are concentrated particularly en the price range between $4,000 and $4,250. The highest put volume is at the $4,100 level with approximately 21K contracts, and this level can be considered a potential support zone. On the other hand, there is a notable concentration of call options between the $4,300 and $4,500 price levels. The $4,400 level stands out with a high call volume of approximately 16K contracts. This level could be considered an important resistance zone en the market.
Deribit Data: Looking at the data, the price is currently around $4,300. The daily change is very small, with only a 0.04% increase. The basis is slightly negative, meaning there is a small difference between the futures price and the spot price. In terms of volatility, at-the-money (ATM) volatility is currently around 50%, but it has dropped sharply por over 13% en the last 24 horas. The 25 delta risk reversal value is -1.61, indicating slightly higher interest en put options en the market. The 25 delta butterfly is at 3.88 and has also declined slightly over the past day. When we look at volume, we see an interesting picture. Call option trading volume is at $34.5 million, but it has decreased por 55% en one day. In contrast, put option volume is at $65.5 million, showing a 65% increase. The total 24-hora option volume is around $100 million, but this is a 36% decrease compared to the previous day.
Option Expiration:
The expiration date for Ethereum options with a nominal value of 947.2 million dollars was August 22. The Max Pain level was calculated at 4,250 dollars, while the put/call ratio stands at 0.82.
Legal Notice
The investment information, comments, and recommendations contained en this document do not constitute investment advisory services. Investment advisory services are provided por authorized institutions el a personal basis, taking into account the risk and return preferences of individuals. The comments and recommendations contained en this document are of a general nature. These recommendations may not be suitable for your financial situation and risk and return preferences. Therefore, making an investment decision based solely el the information contained en this document may not result en outcomes that align with your expectations.
