
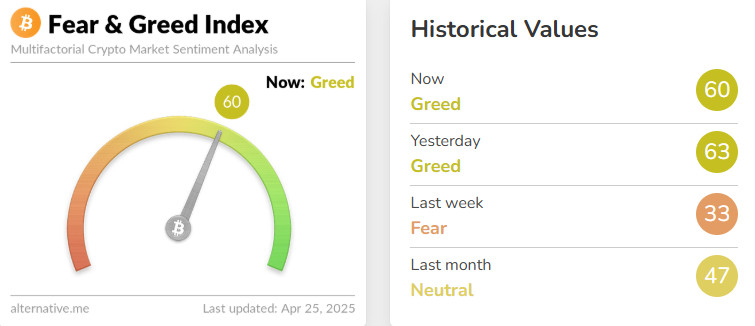
Fear & Greed Index
Source: Alternative
Change in Fear and Greed Value: +27
Level in the past week: 33
This Week’s Level: 60
This week, the index rose to 60, breaking out of the fear zone. Continued buying on the institutional side had a direct impact on market sentiment. Strategy’s 6,556 BTC transaction and Metaplanet’s 330 BTC purchase provided a significant boost at a time of weak investor confidence. Fed member Goolsbee’s personal assessment that interest rates could be lower in 12-18 months supported medium-term easing expectations in the market, while emphasizing that it was too early to make decisions in the short term showed that the cautious stance on the policy side was maintained. While the change of chairmanship at the SEC had a limited impact, Trump’s message that “everyone wants to negotiate” showed that talks with China are ongoing but the process will take time. Overall, sustained corporate demand and a more balanced outlook on monetary policy created an upside break in market sentiment. Although uncertainties persisted, confidence gained strength this week.
Total MarketCap
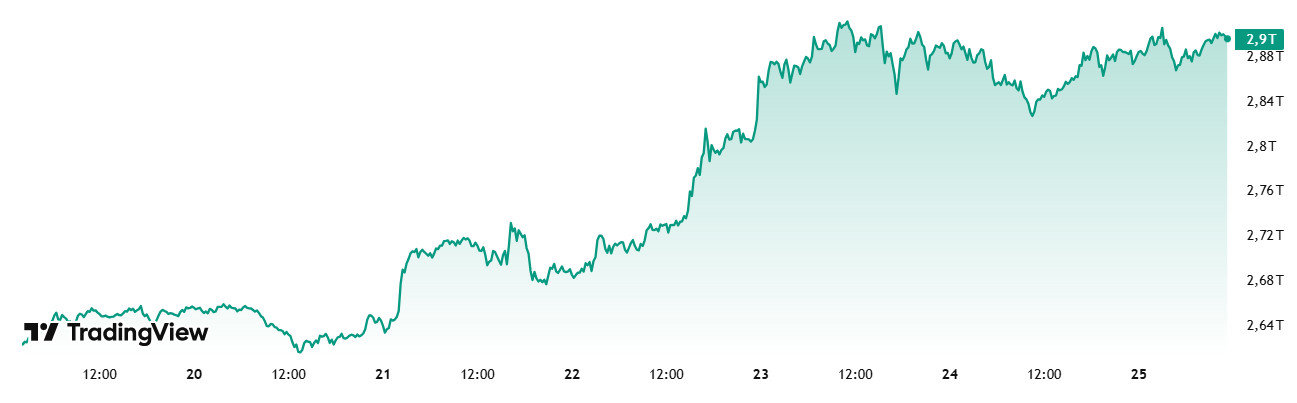
Source: Tradingview
- Last Week Market Capitalization: 65 trillion Dollars
- This Week Market Capitalization: 90 trillion Dollars
This week, the total market capitalization in the cryptocurrency market increased by approximately 250.74 billion USD, an increase of 9.41%. With this move, the total market capitalization reached $2.93 trillion during the week and is once again close to the $3 trillion psychological resistance. However, as this level has previously worked as a strong resistance zone, price movements in this area should be carefully monitored by investors.
Total 2
Total 2, which closed last week with an increase of 0.34%, started the new week with a market capitalization of 957.05 billion dollars. This week, with a value increase of 8.45%, a value increase of 80.74 billion dollars was realized and the 1 trillion dollar threshold was exceeded.
Total 3
Total 3, which increased by 0.59% with an increase of $ 4.46 billion last week, started this week at $ 765.22 billion. During the week, a value increase of 7.72% was recorded with an increase of $ 59.49 billion.
Following last week’s positive closures in both Bitcoin and altcoins, this week has seen a stronger and more widespread bullish trend. According to weekly data, the total growth in the crypto market amounted to approximately $250 billion. While $170 billion of this growth was driven by Bitcoin (Total – Total 2), Ethereum (Total 2 – Total 3) ranked second with an increase of $21.25 billion. The remaining $59.49 billion in value growth was distributed among other altcoins.
Based on this data, approximately 68% of the capital that entered the market this week went to Bitcoin, 11% to Ethereum, and 23% to other altcoins. This distribution suggests that Bitcoin, in particular, has reasserted its market dominance and that institutional demand is still largely BTC-driven. From an investor perspective, this suggests that capital inflows are still mostly concentrated on “blue-chip” crypto assets and that the market is starting to embrace the upturn. However, the limited rally in altcoins may indicate that a full-blown “altcoin season” has not yet begun.
Bitcoin Dominance
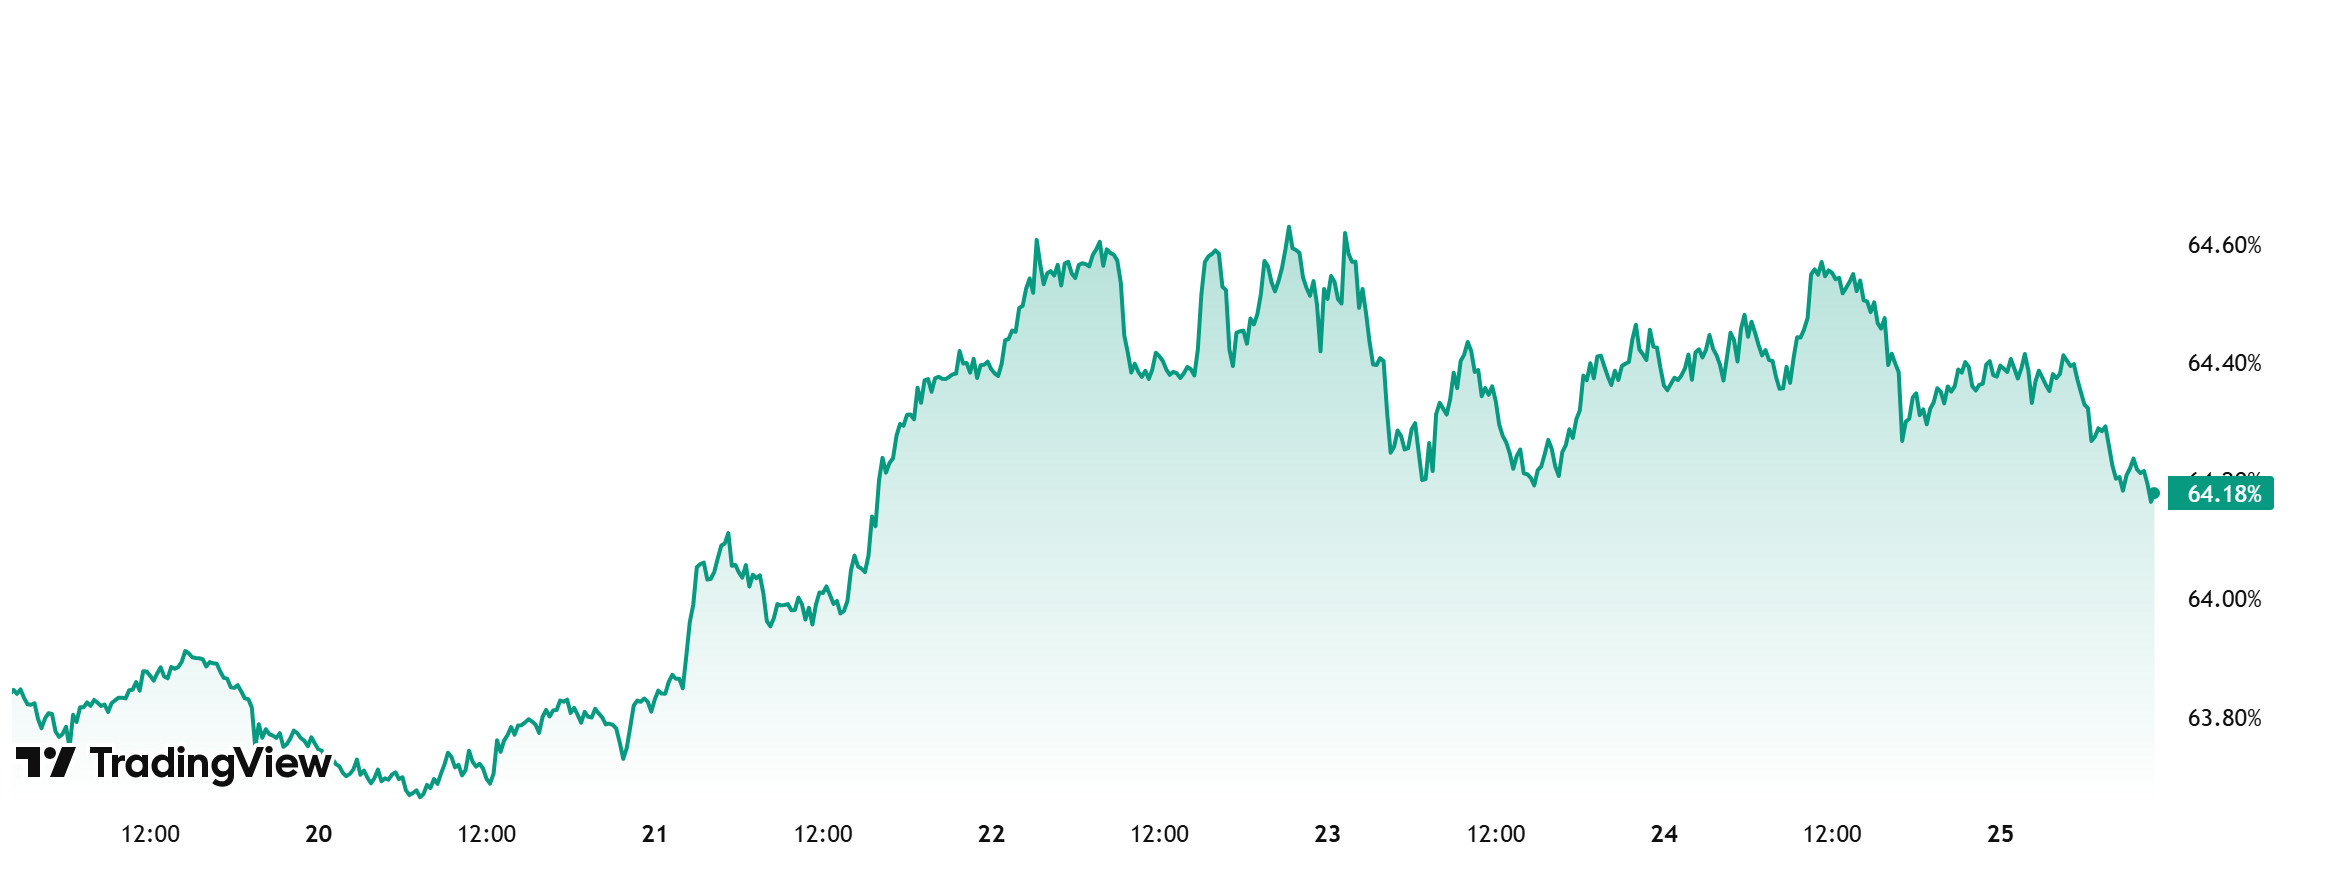
Source: Tradingview
Bitcoin Dominance
Starting the week at 63.86%, BTC dominance rose throughout the week to reach 64.60%, its highest level since February 2021, and is currently at 64.18%.
This week, Strategy bought 6556 Bitcoin and Metaplanet bought 330 Bitcoin. When we analyze Bitcoin spot ETFs, it is seen that there have been net inflows throughout this week.
In addition to all these developments, US President Trump’s frequent statements on tariffs and especially his statement that a good deal can be reached with China in 2 or 3 weeks may increase the appetite of institutional and ETF investors to buy Bitcoin and may ensure continued inflows to Bitcoin.
If the buying effect created by positive news remains limited, the selling pressure that may occur on Bitcoin can be expected to be less compared to the overall market as long as institutional investor purchases continue.
In light of these developments, we can expect BTC dominance to rise to 65% – 66% levels next week.
Ethereum Dominance
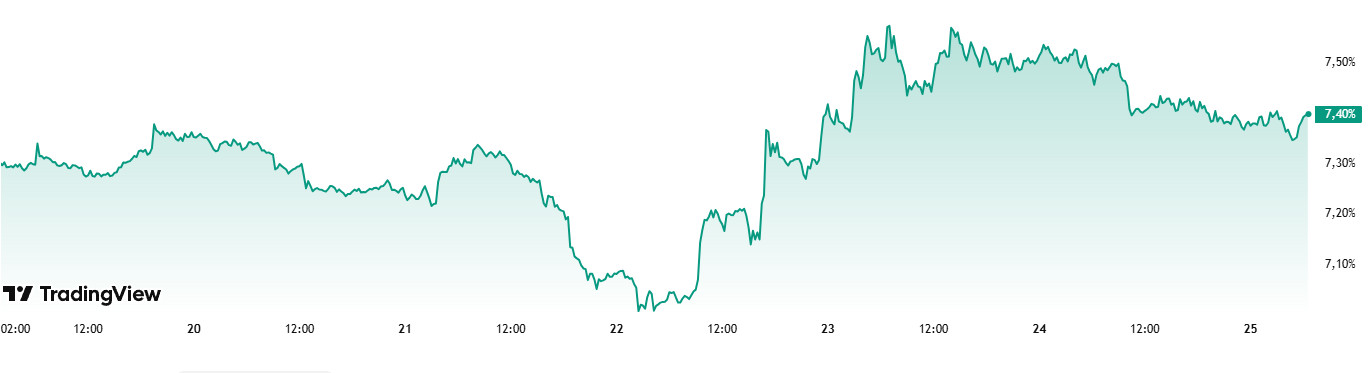
Source: Tradingview
Weekly Change:
Last Week’s Level: 7.24%
This Week’s Level: 7.40%
After rising as high as 8.88% during the week of March 17, Ethereum dominance resumed its downtrend amid selling pressure in this region. Over the previous four weeks, the pressure continued to be significant and the Ethereum dominance hit a historical low of 6.95% with the pullbacks. In the current week, Ethereum dominance, which has recovered from these lows, has started to move in the positive zone again.
However, a total net inflow of $ 53 million from Spot Ethereum ETFs between April 18 and 24, 2025 led to a continuation of the positive outlook on a weekly basis.
In the same period, Bitcoin dominance also followed a positive trend and showed an upward trend along with Ethereum dominance.
In this context, Ethereum dominance ended last week at 7.24% and is hovering around 7.40% as of the current week.
On the other hand, decentralized finance (DeFi) platform Aave integrated Ripple’s stablecoin RLUSD into the Aave V3 marketplace on the Ethereum mainnet. A $50 million supply and $5 million lending limit was set for RLUSD. This development is considered a positive indicator for the Ethereum ecosystem in the long-term perspective. In addition, the 10th anniversary of Ethereum’s Genesis Block will be celebrated on July 30th. This event is expected to play an important role in shaping the vision for Ethereum’s next decade.
Bitcoin Spot ETF

Source: SosoValue
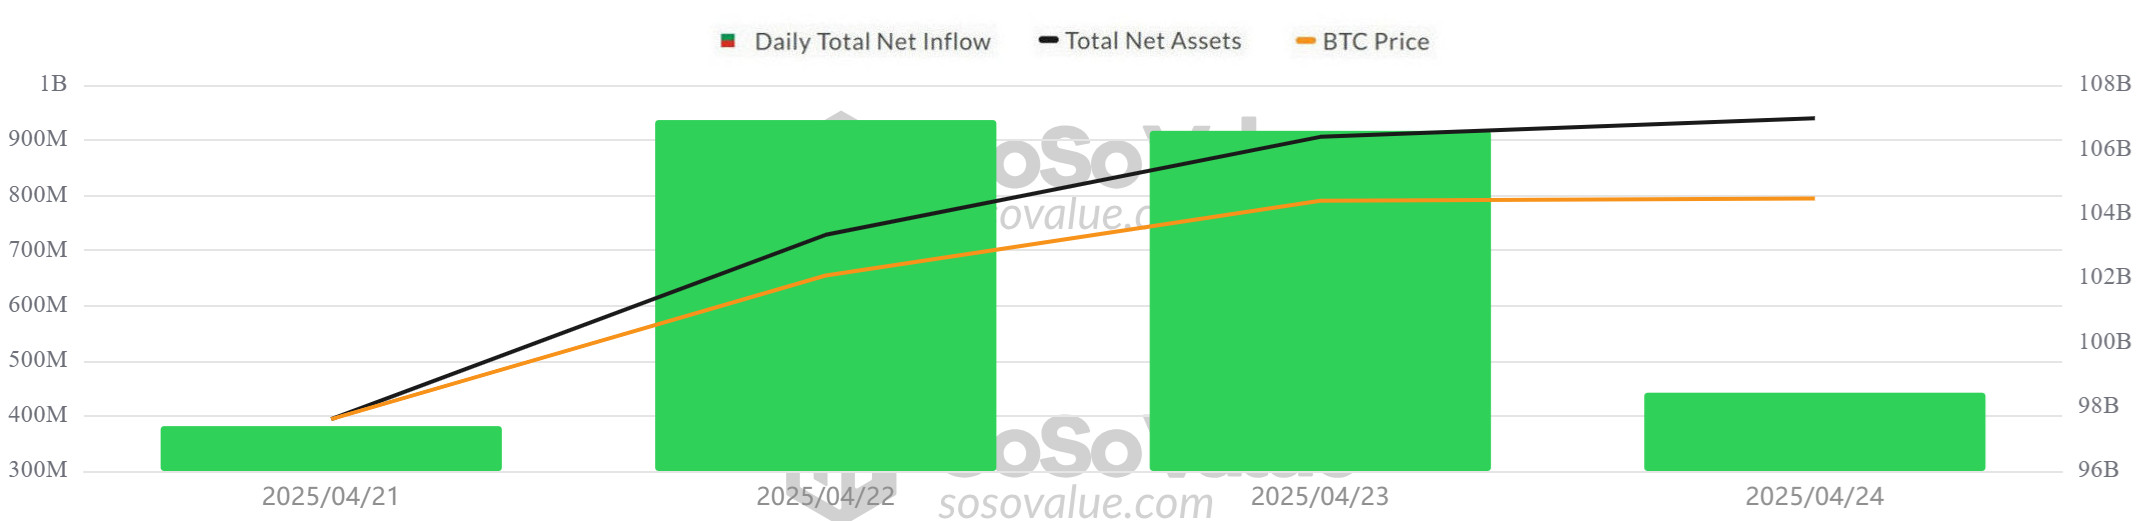
Netflow Status: Between April 18-24, 2025, Spot Bitcoin ETFs saw a total net inflow of $2.653 billion. With this week, the positive net inflow series increased to 4 days. On April 22, there was a net inflow of $ 912.7 million, the largest daily inflow after the Trump era that started on January 20, 2025. On April 23, the second consecutive peak came with a net inflow of $ 917 million. The strongest inflows during this period were BlackRock IBIT ($1.205 billion), Ark ARKB ($609.7 million) and Fidelity FBTC ($465.8 million) ETFs attracted attention with strong net inflows.
Bitcoin Price: Bitcoin, which opened at $84,947 on April 18, 2025, experienced a 10.63% increase on a weekly basis and closed at $93,980 on April 24. The strongest rally of the week came on April 22, when Bitcoin gained 6.77% to reach $93,442. Successive record inflows in spot Bitcoin ETFs reinforced the positive pressure on the price.
Cumulative Net Inflows: Spot Bitcoin ETFs saw a total net inflow of $2.653 billion between April 18-24, 2025, while cumulative net inflows rose to $38.13 billion by the end of the 322nd trading day.
| Date | Coin | Open Price | Close Price | Change % Price | ETF Flow (mil$) |
|---|---|---|---|---|---|
| 18-Apr-25 | BTC | 84,947 | 84,474 | -0.56% | 0 |
| 21-Apr-25 | BTC | 85,179 | 87,516 | 2.74% | 381.3 |
| 22-Apr-25 | BTC | 87,516 | 93,442 | 6.77% | 912.7 |
| 23-Apr-25 | BTC | 93,442 | 93,691 | 0.27% | 917 |
| 24-Apr-25 | BTC | 93,691 | 93,980 | 0.31% | 442 |
| Total for 18 – 24 Apr 25 | 10.63% | 2653.0 | |||
Between April 18-24, 2025, Bitcoin price and Spot Bitcoin ETF inflows performed strongly together. During the week, increased interest from institutional investors supported market confidence, while inflows to Spot Bitcoin ETFs had a direct impact on the price. These flows, especially led by large institutional players such as BlackRock, Ark and Fidelity, revealed that investors’ confidence in Bitcoin continues. Continued institutional interest may allow the positive scenario to remain at the forefront of Bitcoin’s medium-term pricing.
Ethereum spot ETF
Source: SosoValue
Between April 18-24, 2025, Spot Ethereum ETFs saw a total net inflow of $53 million. While the strongest inflow of the week was recorded on April 24 with $63.5 million, the inflows of $24.7 million to Grayscale ETH ETF, $32.7 million to Fidelity FETH ETF and $9.7 million to BlackRock ETHA ETF were particularly noteworthy. With these inflows, the cumulative total net inflows of Spot Ethereum ETFs at the end of the 190th trading day rose to $2.315 billion. In addition, the 10-day streak of negative or zero net flows ended with a net inflow of $ 38.8 million on April 22.
| Date | Coin | Open Price | Close Price | Change % Price | ETF Flow (mil$) |
|---|---|---|---|---|---|
| 18-Apr-25 | ETH | 1,583 | 1,588 | 0.32% | 0 |
| 21-Apr-25 | ETH | 1,587 | 1,579 | -0.50% | -25.4 |
| 22-Apr-25 | ETH | 1,579 | 1,756 | 11.21% | 38.8 |
| 23-Apr-25 | ETH | 1,756 | 1,795 | 2.22% | -23.9 |
| 24-Apr-25 | ETH | 1,795 | 1,769 | -1.45% | 63.5 |
| Total for 18 – 24 Apr 25 | 11.75% | 53.0 | |||
The uptrend in the crypto market supported increased institutional interest in Spot Ethereum ETFs and had a positive impact on net flows. Ethereum price rose by 11.75% on a weekly basis. Technical expectations of the upcoming Pectra update and softening macroeconomic rhetoric may support increased demand for Spot Ethereum ETFs in the coming period. Both the ETF inflow trend and global risk appetite may be decisive on Ethereum’s short-term direction.
Source: Laevitas
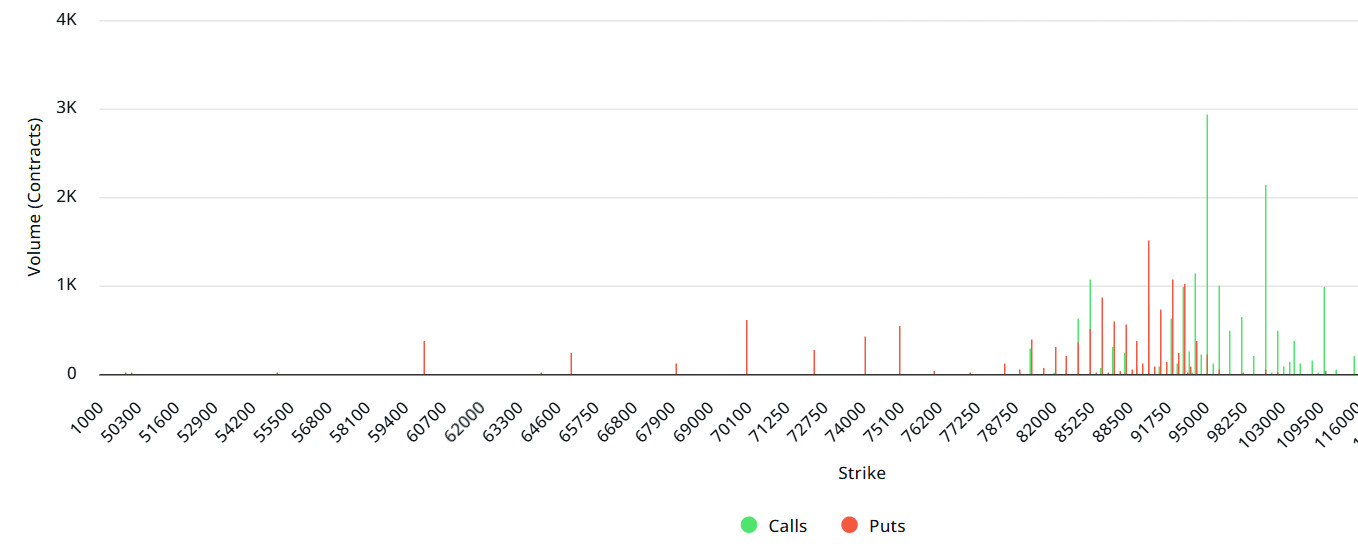
$BTC: Notional: $7.2B | Put/Call: 0.52 | Max Pain: $93K
Deribit Data: Deribit data shows that BTC options contracts with a nominal value of approximately $7.2 billion expired today. At the same time, according to the data in the last 24 hours, if we look at the risk conversion in the next 1-week period, call options are the dominant side in hedging more than put options in the 24-hour period. This shows us that the bullish expectation is increasing. When we look at the expected volatility, the fact that it is above the realized volatility is a bullish signal, but it shows us that call contract fees are expensive, whereas the contract fees of put options are low. Skrew values indicate that there is a slight selling pressure in the short term and that purchases will strengthen in the medium term. When we look at the term structure data, it is necessary to be cautious for excess volatility during the option expiration.
Laevitas Data: When we examine the chart, we see that put options are concentrated between $ 80,000 – $ 93,250. Call options are concentrated between $93,500 – $110,000 and the concentration decreases towards the upper levels. At the same time, the $ 90,000 level is seen as support and the $ 95,000 level as resistance. On the other hand, there are 1.51K put options at the $ 90,000 level, where there is a peak and there is a decrease in put volume after this level. However, it is seen that 2.94K call option contracts peaked at $95,000. When we look at the options market, we see that call contracts are dominant on a daily and weekly basis.
Option Expiration
Put/Call Ratio and Maximum Pain Point: In the last 7 days data from Laevitas, the number of call options increased by 21% to 91.74K 111.02K compared to last week. In contrast, the number of put options decreased by 2% to 69.87K. The put/call ratio for options was set at 0.52. This shows that call options are more dominant among traders. Bitcoin’s maximum pain point is seen at $93,000 at the time of writing. It can be predicted that BTC is priced at $93,700 and if it does not break the $93,000 level, which is the pain point, downwards, the rises will continue. In the coming period, there are 2.72K call and 2.02K put options at the time of writing.
Ethereum Options Distribution
Source: Laevitas
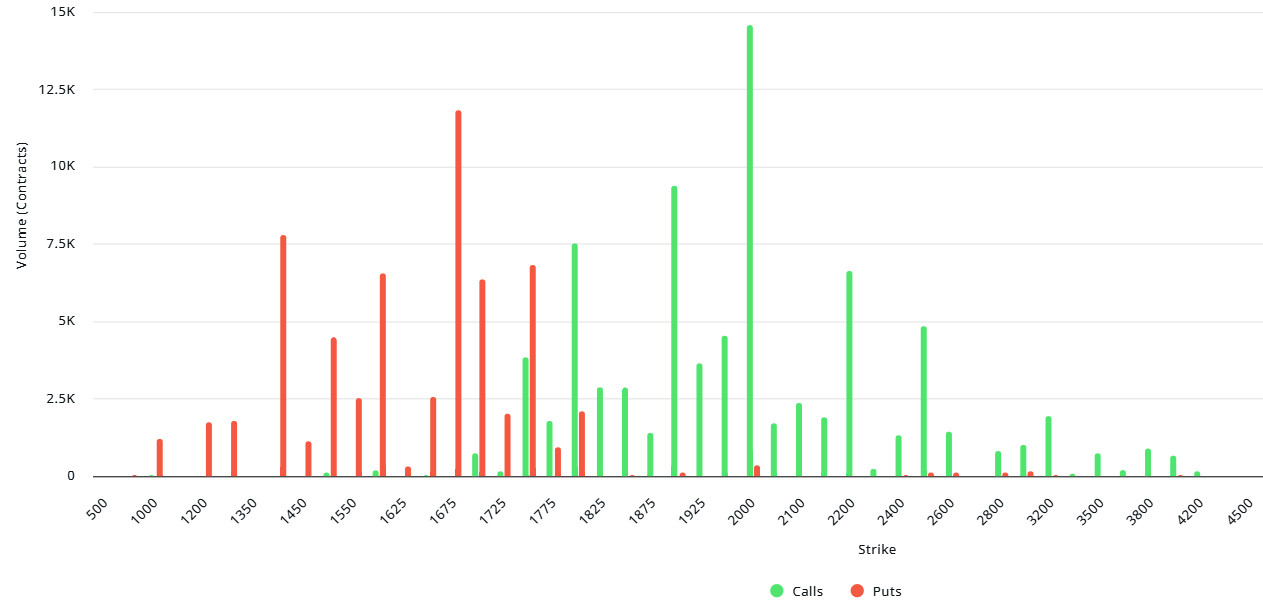
ETH: $74M notional | Put/Call: 0.79 | Max Pain: $1,775
Laevitas Data: When we first focus on Put options, we see that the volume is particularly concentrated in the $1,450 – $1,700 band. There are about 12K contracts at the $1,675 level. The $1,450 and $1,600 areas are also notably concentrated. These regions are seen as strong support areas by market participants. It should be noted that in a possible downward break, selling pressure may accelerate. On the other hand, the volume in Call options has shifted mainly to the $ 1,800 – $ 2,000 band. Especially at the $ 2,000 level, it is seen that a peak was reached with approximately 15K contracts. This suggests that investors are positioning the $2,000 level as a target price or an important resistance point. There is also a noticeable concentration at the $2,400 and $2,600 levels. This implies that market players are diversifying their upside positions in anticipation of higher volatility.
Deribit Data: The ATM volatility rate was at 68.55, up 4.04%. Volatility remained high, indicating that the market is prepared for large price movements. 25Δ Risk Reversal (RR) increased by 2.04% to 5.24, indicating that traders are showing more interest in upside positions.
Option Expiration
Ethereum options with a notional value of approximately $74 million will expire on April 26. The maximum pain point (Max Pain) is at $ 1,775. The put/call ratio is 0.79.
Legal Notice
The investment information, comments and recommendations contained in this document do not constitute investment advisory services. Investment advisory services are provided by authorized institutions on a personal basis, taking into account the risk and return preferences of individuals. The comments and recommendations contained in this document are of a general type. These recommendations may not be suitable for your financial situation and risk and return preferences. Therefore, making an investment decision based solely on the information contained in this document may not result in results that are in line with your expectations.
