
Fear & Greed Index
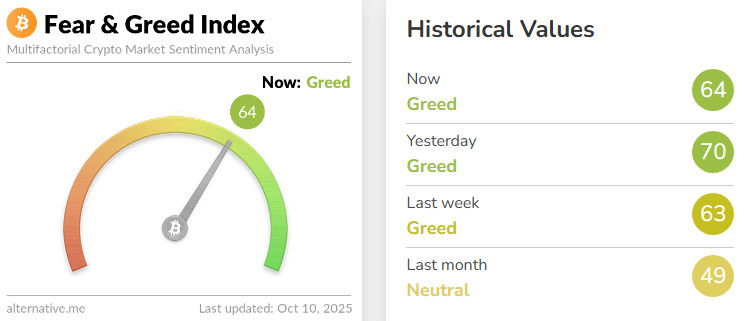
Source : Alternative.me
Change en Fear and Greed Value: +1
Last Week’s Level: 63
This Week’s Level: 64
The Fear & Greed Index rose slightly from 63 to 64 this week. The increase was driven por news flow indicating institutional demand and signals of a relative softening en monetary policy. BitMine’s purchase of 179,251 ETH and the launch of Pineapple’s $100 million INJ treasury strategy with $8.9 million en the first phase supported the volume and momentum components el the spot side, strengthening the “Greed” direction. CEA Industries’ announcement that it holds 480,000 BNB en its portfolio and its target to reach about 1% of total supply por the end of the year signaled institutional retention, while at the same time keeping the concentration and liquidity discussions alive and generating partial “Fear” through the volatility channel. On the Fed front, Miran’s messages emphasizing that uncertainties have diminished and the importance of a forward-looking approach, Williams’ rhetoric supporting the continuation of interest rate cuts and the assessments en the FOMC minutos that opened the door to additional easing this year eased crypto sentiment through the financial conditions channel, but expectations for rapid easing remained limited as upside risks to employment and inflation were underlined. In aggregate, corporate buying news and Fed communication pushed the “Greed” components of the index slightly higher, while concentration concerns el the BNB side and macro two-way risks curbed a stronger rise, so that the index closed the week at 64, en a cautiously optimistic balance.
Fund Flows
Source: CoinShares
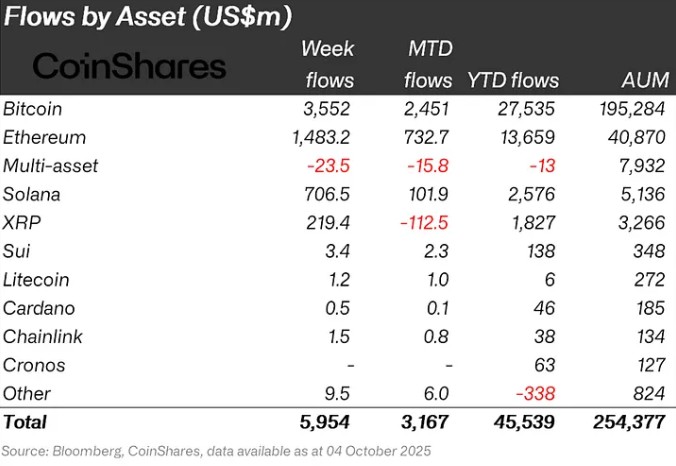
Overview Cryptocurrency markets entered a bullish week as the US House of Representatives failed to muster enough votes and continued to shut down. Especially the positive statements of FED members towards the markets strengthened the positive atmosphere en the market. As a result of these developments, Bitcoin gained about 3% during the week.
Bitcoin (BTC): Bitcoin continues to gain this week with strong buying por investors. The interest rate cut en global markets and the US House shutdown had a positive impact el crypto markets. This week alone, Bitcoin-focused funds saw inflows of $3.552 billion.
Ethereum (ETH): $1.483.2 billion flowed into Ethereum this week, as spot ETH surged again.
Ripple (XRP): Xrp saw $219.4 million en fund inflows this week.
SUI (SUI): The launch of a local DEX called “SuiDEX” is planned. This DEX aims to offer trading liquidity, trading efficiency, low cost and low latency el the SUI blockchain. Approximately $3.4 million worth of inflows were realized from Sui this week.
Solana (SOL): Solana saw inflows of $706.5 million as ETF inflows increased.
Cardano (ADA): Cardano saw inflows of $0.5 million this week.
Litecoin (LTC): The LTC coin saw inflows of $1.2 million.
Chainlink (LINK): Chainlink continues to strengthen its potential por providing reliable data and updates to the Tokenization and DeFi space. Link saw $1.5 million en inflows this week.
Other: Sectoral and project-based rises en altcoins and general market sentiment led to an inflow of $9.5 million en fund flow data.
Fund Outflows:
Multi-asset: Outflows were observed en the multi-asset group.
Total MarketCap
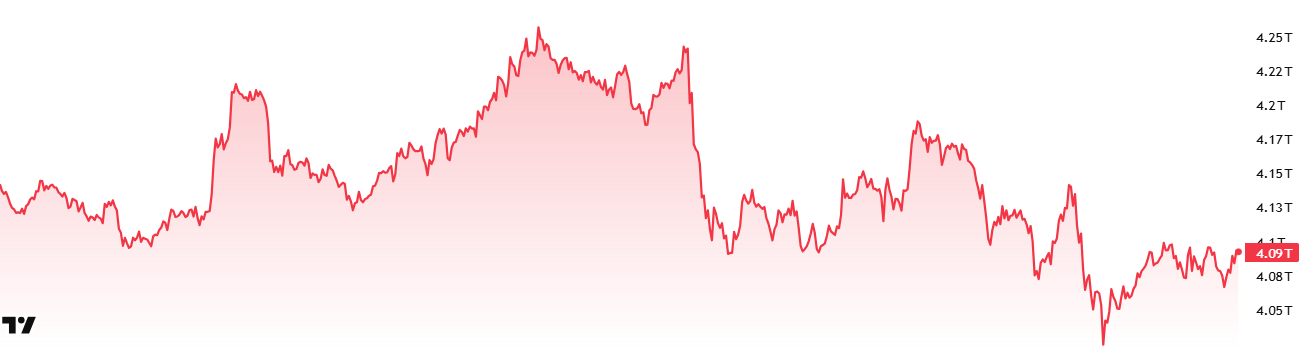
Source : Tradingview
- Market Capitalization Last Week:15 Trillion Dollars
- Market Capitalization This Week:09 Trillion Dollars
This week, the cryptocurrency market fell por 1.14%, losing about $60 billion en value, and the total market capitalization fell to $4.09 trillion. The weekly peak was recorded as 4.27 trillion dollars and the lowest level was recorded as 4.02 trillion dollars. Thus, the market moved en a band of about 250 billion dollars. This chart shows that market volatility has decreased significantly compared to last week. Despite this, the market surpassed its all-time high of $4.17 trillion, reaching $4.27 trillion, and set a new high; however, this level could not be sustained.
Total 2
Total 2 started the week with a market capitalization of $1.69 trillion and fell por 1.54% during the week to $1.66 trillion, down about $26 billion. The high for the week was $1.77 trillion and the low was $1.63 trillion. The index moved within a wide band totaling $136 billion. This shows that Total 2 has continued its volatile course en recent weeks. With this week’s move, the Total 2 index has reaffirmed its peak at $1.77 trillion but has failed to hold.
Total 3
Total 3 started the week with a market capitalization of $1.15 trillion and fell por 0.8% during the week, losing about $9 billion. For Total 3, which continued the period at $1.14 trillion, there was a 7% difference between the week’s highs and lows. With this calculation, Total 3 lost the “most volatile index” title to Total 2 this week.
While the market was generally negative, the strongest performance came from the Total 3 index. This suggests that the very high-risk asset class has increased its fundamental weight en the ecosystem. On the other hand, comparative performances show a significant decline en Ethereum’s market share. It seems that Ethereum has lost some of its market dominance over altcoins to Bitcoin this week.
Altcoin Season Index
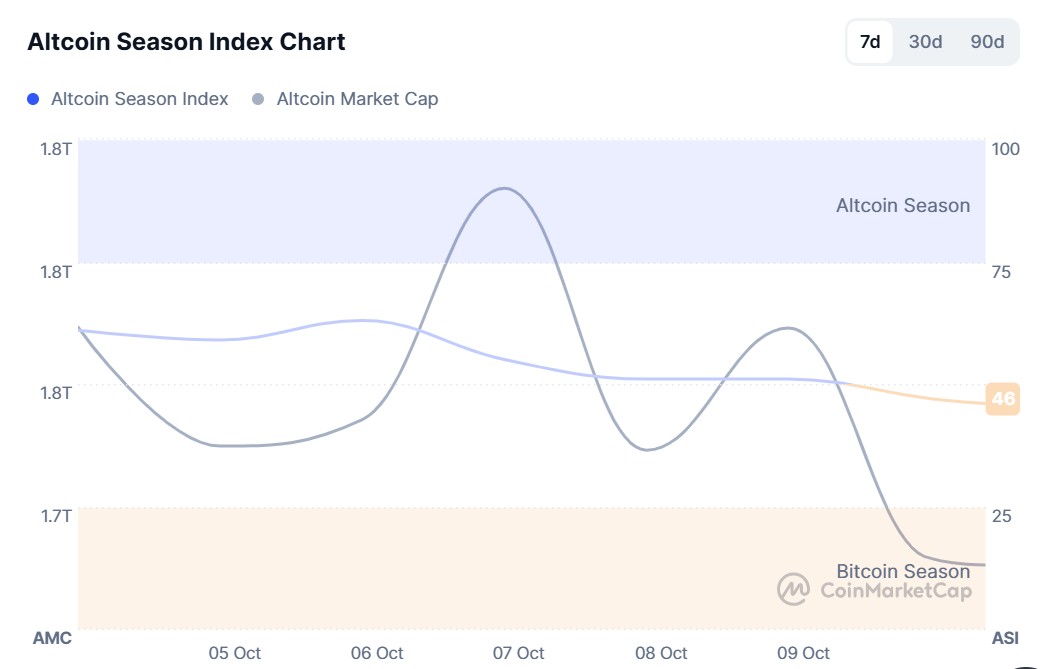
Source: Coinmarketcap
- Last Week Index Value: 72/100
- Index Value This Week: 46/100
Between October 3 and October 10, 2025, the correlation between the market capitalization of altcoins (Altcoin Market Cap) and the Altcoin Season Index showed a decline. The chart shows that this week, the index peaked at 78 el October 7, with the Altcoin Market Cap reaching 1.72T. On the last day of the week, October 9, the index retreated to 46. This indicates a decline en the market dominance of altcoins. The top 5 coins that led the index higher this week were MYX, Aster, ZEC, OKB, XPL.
Bitcoin Dominance
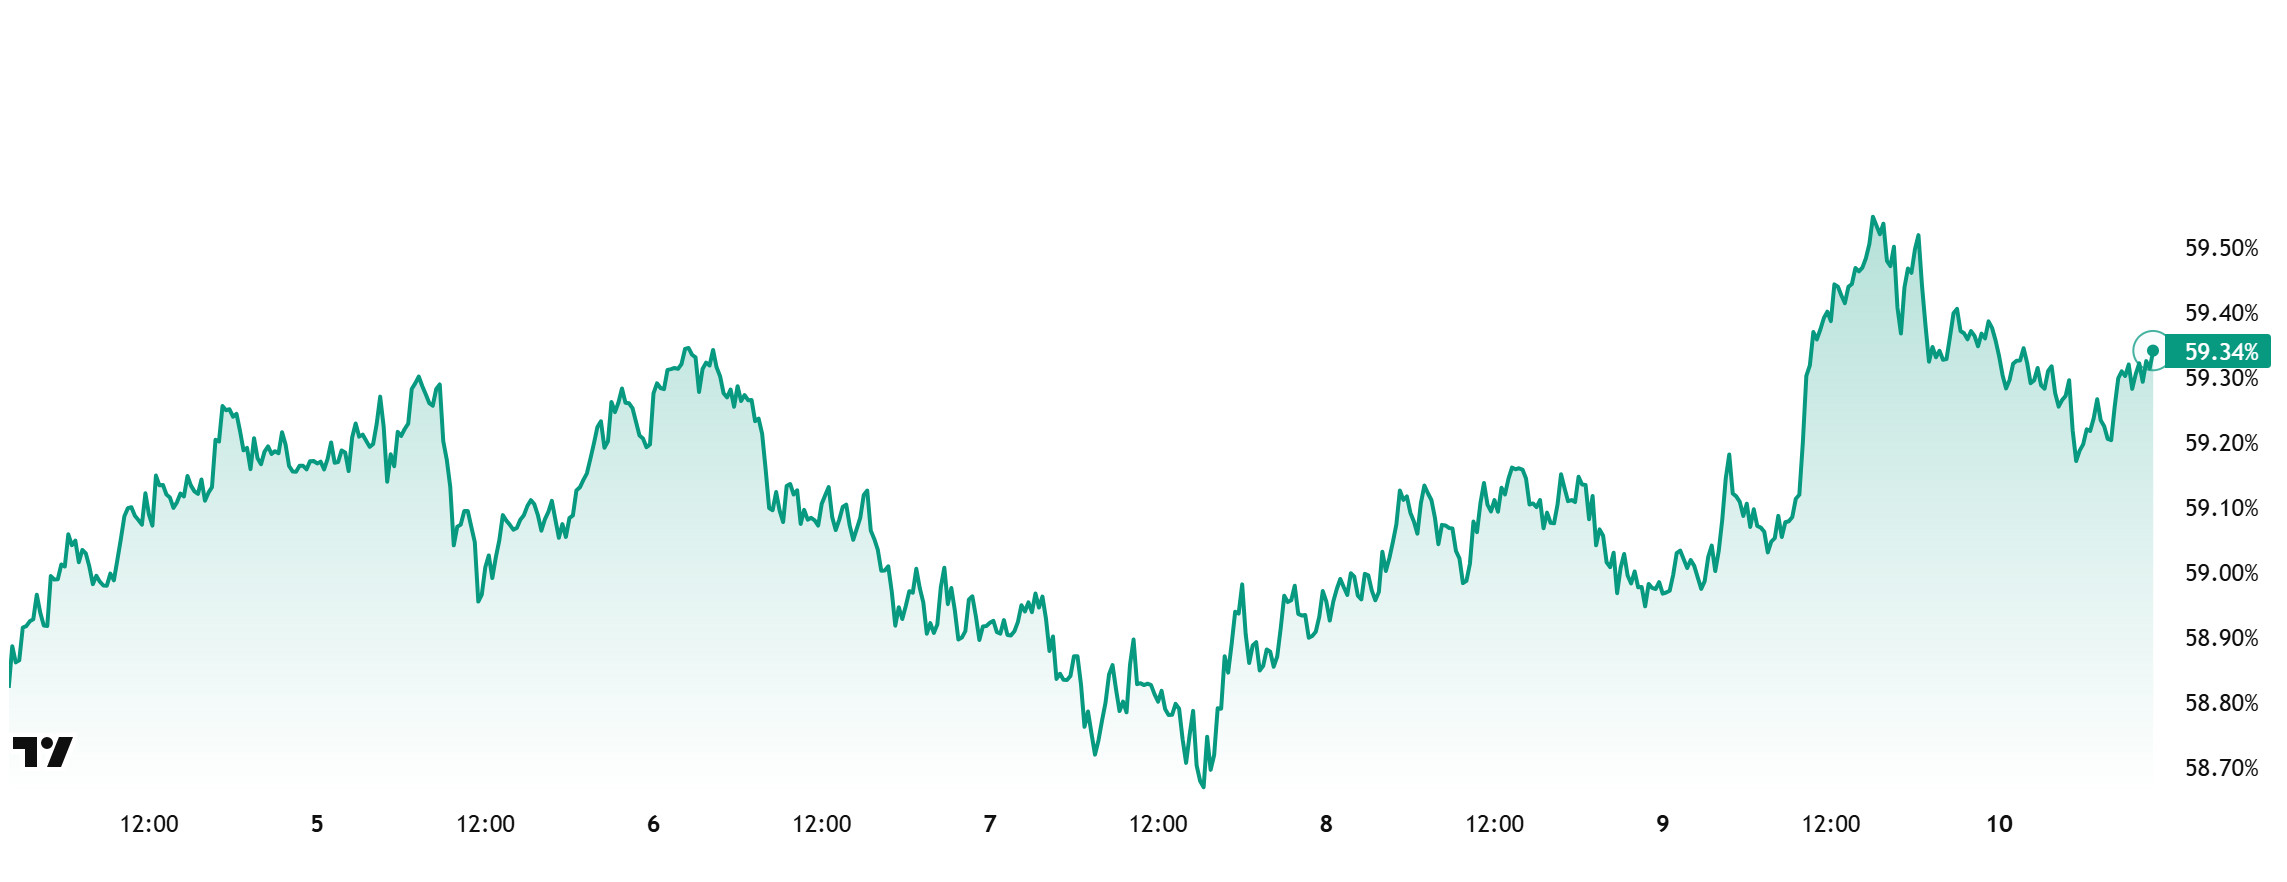
Bitcoin Dominance
Bitcoin dominance, which started the week at 59.31%, retreated to 58.53% during the week, but then rallied and is currently at 59.34%.
This week, Zooz Power bought 329 Bitcoin, The Smarter Web bought 25 Bitcoin and Prenetics bought 12 Bitcoin. Moreover, data el Bitcoin spot ETFs shows that there have been net inflows totaling $2.72 billion to date.
While a partial slowdown en institutional investor demand for Bitcoin was observed this week, weekly data show that net purchases por retail investors through spot ETFs continued to gain momentum.
Bitcoin-focused capital inflows continue to increase due to the upbeat sentiment en the markets. In this process, Bitcoin has been outperforming Ethereum and other altcoins. If institutional investors continue their purchases and net inflows to spot ETFs continue to increase, BTC dominance is expected to remain strong. However, en the event of a divergence en the price performance of Ethereum and other altcoins, a limited decline en dominance may be seen. Against this backdrop, Bitcoin’s market dominance has some downside potential en the short term, but BTC dominance is expected to consolidate en the 58%-61% range next week.
Ethereum Dominance
Source: Tradingview
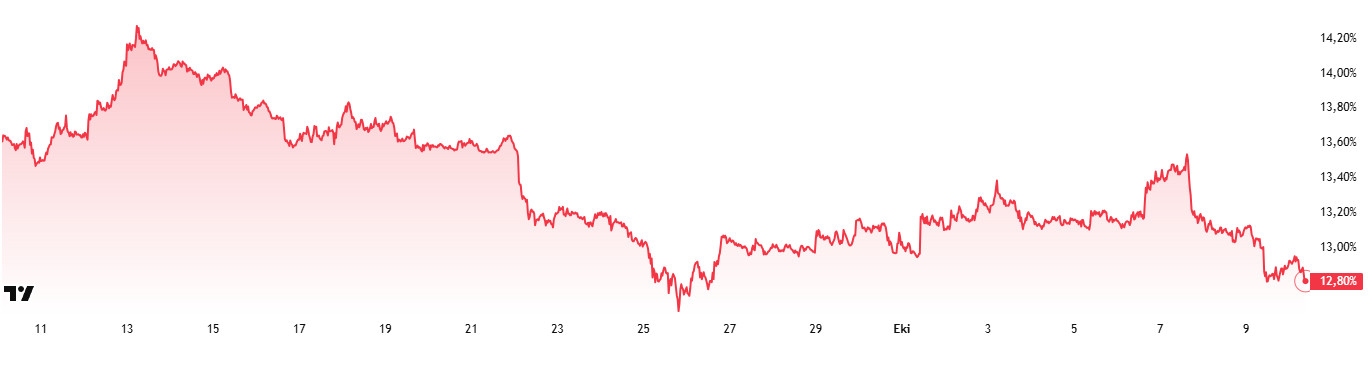
Weekly Change
- Last Week’s Level: 13.14%
- This Week’s Level: 12.80%
Ethereum dominance, which rose as high as 15% en mid-August, lost momentum en the following period and entered a downward trend, and this negative trend continues as of the current week.
Accordingly, Ethereum dominance ended last week at 13.14%, while it is trading at around 12.80% en the light of current data. In the same period, Bitcoin dominance followed a slightly negative trend, similar to Ethereum.
When the main developments affecting Ethereum dominance are analyzed, the following are the prominent headlines:
According to GlobeNewswire, Nasdaq-listed Kaixin Holdings announced that it will start investing en Ethereum (ETH) as part of its new digital asset treasury strategy. The company also plans to invest en high-value projects and make strategic acquisitions en the Web3 space.
According to Monochrome’s official statement, the IBTC ETF’s assets increased to 1,076 BTC as of October 3. The market capitalization of the fund exceeded 195 million Australian dollars.
Ethereum treasury company Bit Digital announced the purchase of another 31,057 ETH el its X platform, bringing its total Ethereum holdings to 150,244 ETH. The company continues to view Ethereum as a long-term strategic reserve.
In addition, the Ethereum Foundation has established a research team called “Privacy Kit” to strengthen el-chain privacy. Coordinated por Igor Barinov, founder of Blockscout and xDai, the team includes 47 researchers and cryptographers. With this initiative, the Foundation aims to reinforce privacy as a “world-class feature” of Ethereum.
Bitcoin Spot ETF
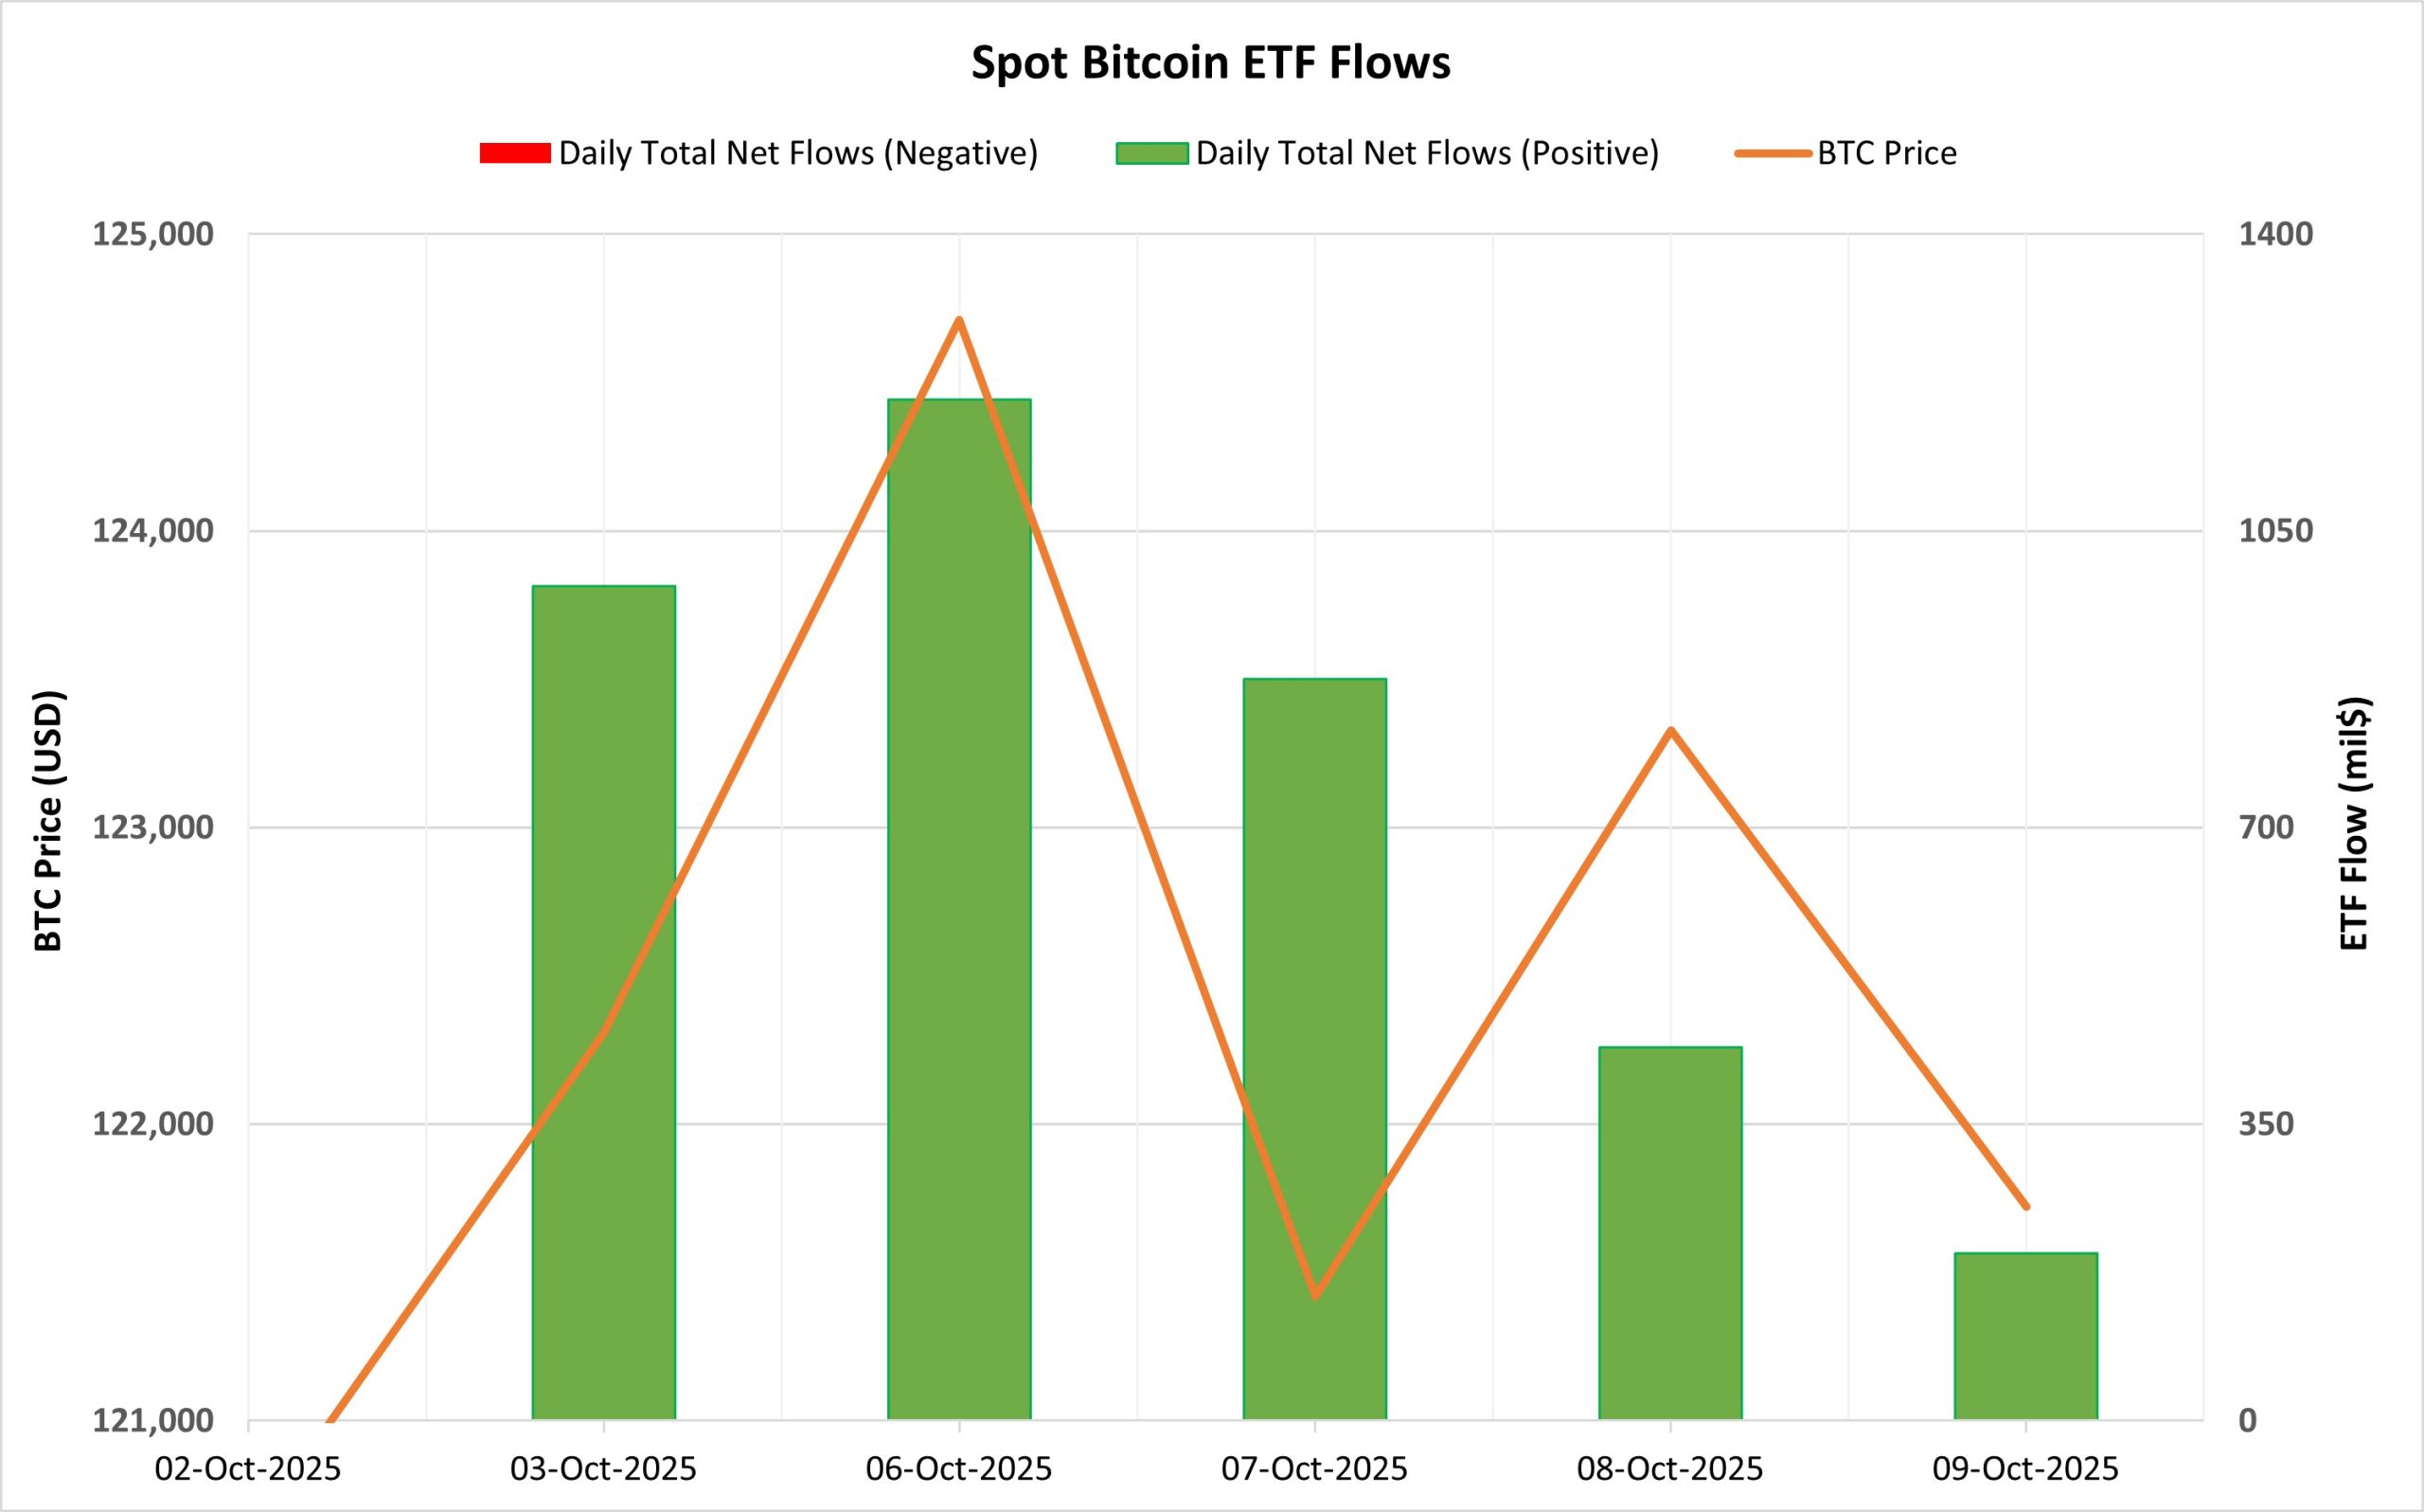
Netflow Status: Between October 03-09, Spot Bitcoin ETFs saw a total net inflow of $3.70 billion. The strongest daily inflow was el October 6 with $1.21 billion. On a fund basis, BlackRock IBIT continued to be the clear leader with a net inflow of $3.34 billion. In this period, the positive net flow series increased to 9 trading days and institutional demand remained strong.
Bitcoin Price: Bitcoin, which opened at $120,604 el October 3, closed at $121,721 el October 9. In this process, the Bitcoin price rose por 0.93%. Despite the limited movement of the price during this period, strong inflows en ETF flows supported market confidence.
Cumulative Net Inflows: By the end of the 438th trading day, cumulative total net inflows into Spot Bitcoin ETFs rose to $62.74 billion.
Bitcoin Spot ETF Flows (03–09 October 2025)
| Date | Coin | Open Price ($) | Close Price ($) | Change (%) | ETF Flow (Million $) |
|---|---|---|---|---|---|
| 03-Oct-2025 | BTC | 120,604 | 122,305 | +1.41% | 985.1 |
| 06-Oct-2025 | BTC | 123,510 | 124,710 | +0.97% | 1,205.2 |
| 07-Oct-2025 | BTC | 124,710 | 121,420 | −2.64% | 875.6 |
| 08-Oct-2025 | BTC | 121,420 | 123,329 | +1.57% | 440.7 |
| 09-Oct-2025 | BTC | 123,329 | 121,721 | −1.30% | 197.8 |
| Total (03–09 Oct 2025) | +0.93% | 3,704.4 |
Note: Values en USD. Positive/negative changes shown as +/−. Data for 03–09 Oct 2025.
The uninterrupted series of positive flows over the last nine trading days revealed that institutional demand en the Bitcoin ETF market has remained steady. Heavy buying, especially el the BlackRock IBIT side, kept the market’s overall risk appetite alive. Although the movements en the Bitcoin price flattened towards the end of this period, the strong fund inflows helped maintain the upward outlook en the short term. If this inflow trend continues, there may be a supportive backdrop for Bitcoin’s market dynamics. However, if there is a slowdown en flows or outflows, profit sales may accelerate en the short term.
Ethereum spot ETF
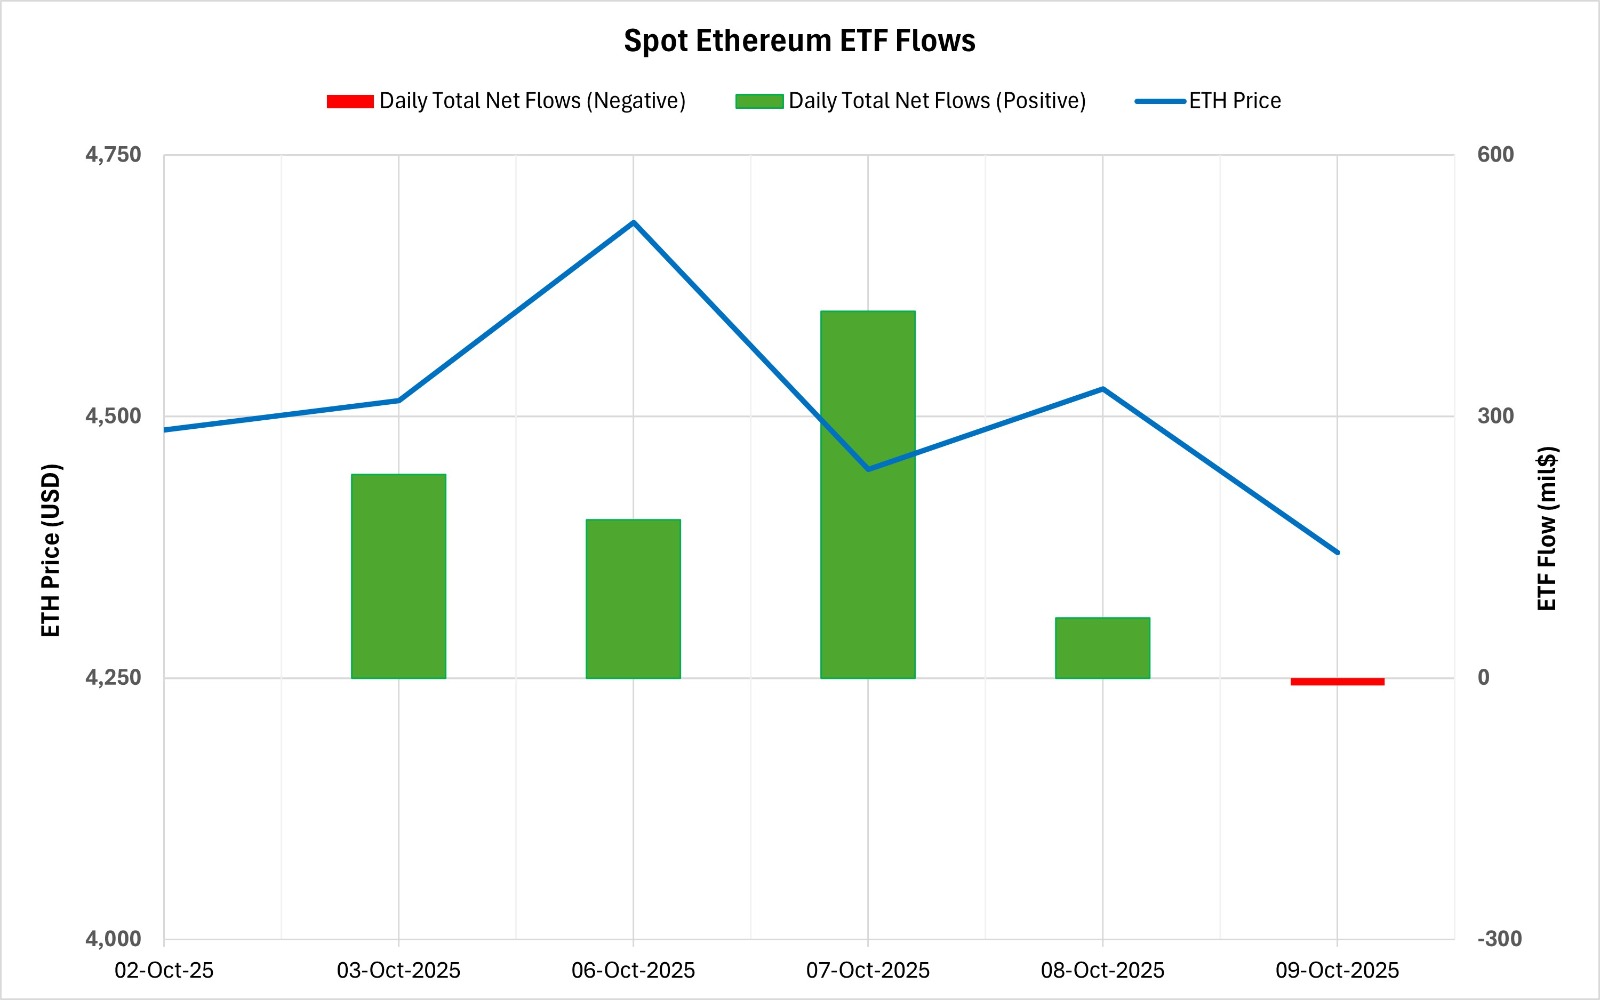
Between October 03-09, 2025, Spot Ethereum ETFs saw a total net inflow of $896.6 million. The strongest inflow el a daily basis was el October 7 with $420.9 million. On a fund basis, BlackRock ETHA stood out with a net inflow of $ 925 million. The positive net flow series, which continued for eight trading days, ended el October 9, 2025. As a result, the cumulative total net inflows of Spot Ethereum ETFs as of the 306th trading day rose to $15.10 billion.
Ethereum Spot ETF Flows (03–09 October 2025)
| Date | Coin | Open Price ($) | Close Price ($) | Change (%) | ETF Flow (Million $) |
|---|---|---|---|---|---|
| 03-Oct-2025 | ETH | 4,487 | 4,515 | +0.63% | 233.5 |
| 06-Oct-2025 | ETH | 4,515 | 4,686 | +3.78% | 181.8 |
| 07-Oct-2025 | ETH | 4,686 | 4,449 | −5.04% | 420.9 |
| 08-Oct-2025 | ETH | 4,449 | 4,526 | +1.73% | 69.1 |
| 09-Oct-2025 | ETH | 4,526 | 4,370 | −3.46% | −8.7 |
| Total (03–09 Oct 2025) | −2.62% | 896.6 |
Note: Values en USD. Positive/negative changes shown as +/−. Data for 03–09 Oct 2025.
Ethereum price started at $4,487 el October 3 and closed at $4,370 el October 9, down 2.62% during this period. Although fund inflows supported the price, the decreasing demand trend towards the end of this process can be considered as one of the factors that caused a decline en Ethereum price. In general, while the flows continue to remain el the positive side, the Ethereum price closed slightly lower, which can be interpreted as investors turning to short-term profit realization and cautious position purchases are effective. If fund flows regain strength, this could restore investor confidence and support Ethereum’s medium-term positive outlook.
Bitcoin Options Distribution
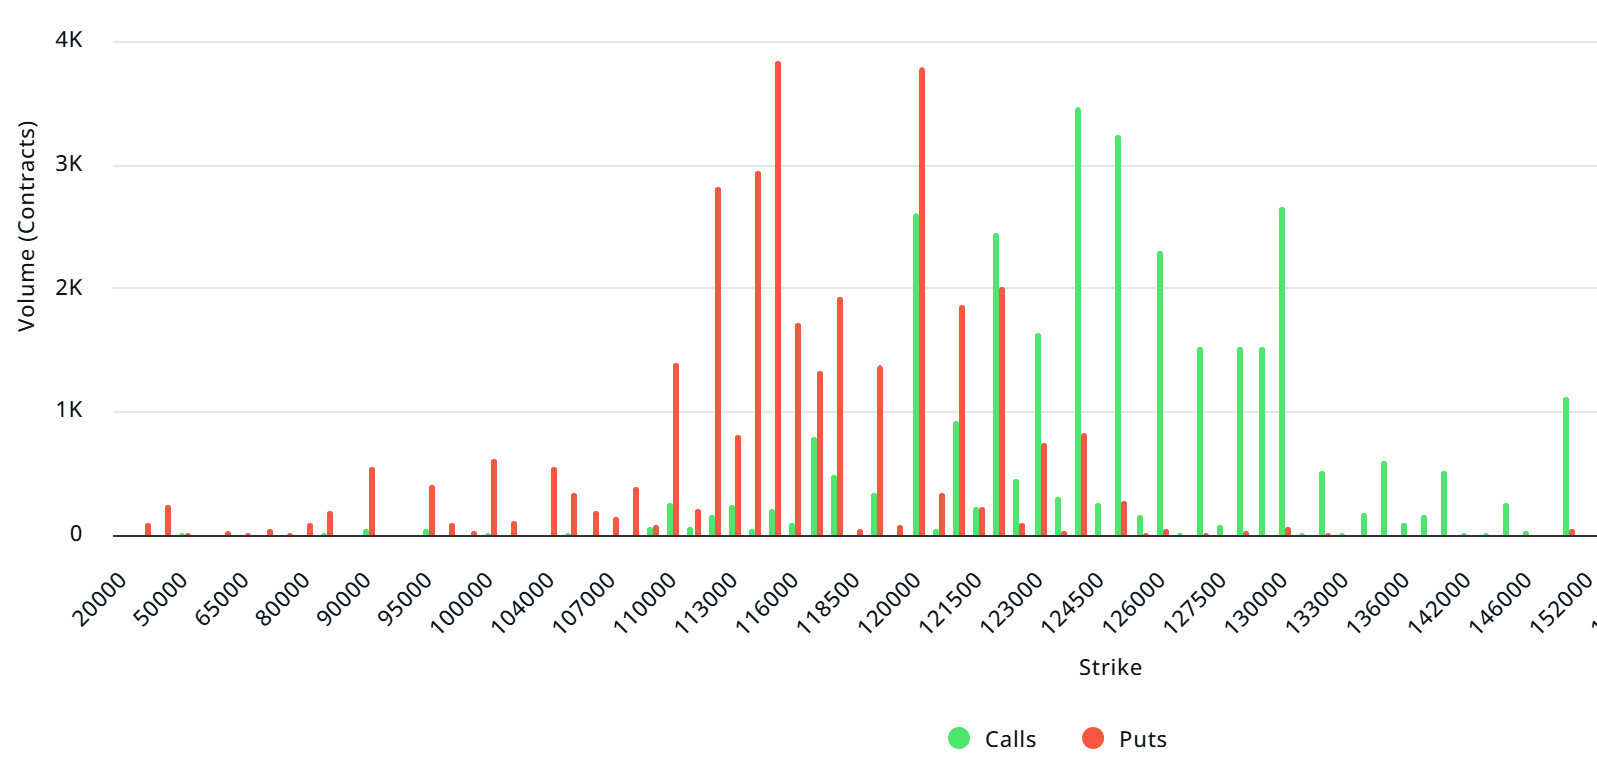
Source: Laevitas
BTC: Notional: $4.3B | Put/Call: 1.12 | Max Pain: $117K
Deribit Data: Deribit data shows that BTC options contracts with a notional value of approximately $4.3 billion expired today. At the same time, according to the data en the last 24 horas, if we look at the risk conversion en the next 1 week, put options are the dominant side en hedging more than call options. When we examine the expected volatility (IV), it is below the realized volatility (RV). On the other hand, the negative course of the spread metric indicates that the market’s risk appetite has decreased. Skew values are bearish today and next week.
Laevitas Data: When we analyze the chart, it is seen that put options are concentrated en a wide band between 104,000 – 122,000 dollars. Call options are concentrated between the levels of 120,000 – 130,000 dollars and the concentration decreases towards the upper levels. At the same time, the $ 115,000 level is seen as support and the $ 124,000 level as resistance. On the other hand, there are 3.85K put options at the $ 115,000 level, where there is a peak and there is a decrease en put volume after this level. However, it is seen that 3.47K call option contracts peaked at $ 124,000. When we look at the options market, we see that put contracts are dominant el a daily and weekly basis.
Option Maturity:
Put/Call Ratio and Maximum Pain Point: If we look at the options en the last 7 days data from Laevitas, the number of call options increased por about 50% compared to last week and amounted to 166.72K. In contrast, the number of put options increased por 43% compared to last week to 128.08K. The put/call ratio for options was set at 1.12. This indicates that call options are less en demand among investors than put options. Bitcoin’s maximum pain point is seen at $117,000. BTC is currently priced at $119,500 and it can be predicted that the rises will continue if it does not break the $117,000 level, which is the pain point.
Ethereum Options Distribution
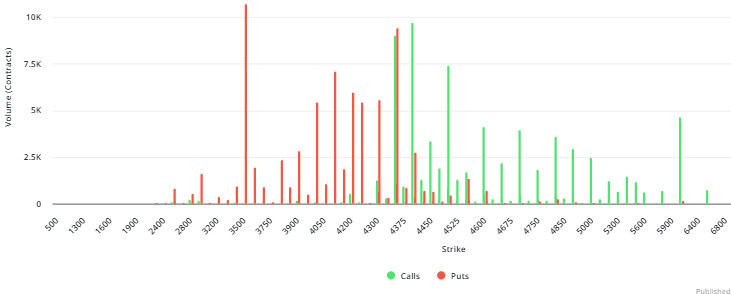
Source: Laevitas
ETH: $947.8 M notional | Put/Call: 0.90 | Max Pain: $4,400
Laevitas Data: Looking at the data en the chart, we see that put options are particularly concentrated at the price levels between $4,100 and $4,350. The highest put volume is at $4,100 with around 7K contracts and this level can be considered as a possible support zone. On the other hand, call options are concentrated between $4,350 and $4,400. Especially the $4,400 level stands out with a high call volume of about 10K contracts. This level can be considered as an important resistance zone en the market.
Deribit Data: ATM volatility is at 45.33% and has fallen 22.23% en the last 24 horas. This tells us that the market’s short-term risk appetite is decreasing while option premiums are under pressure. The 25 delta risk reversal (RR) is en negative territory at -0.47%, down 0.47% el a daily basis. In other words, the demand for put options is slightly stronger than for calls.
On the volume side, calls and puts were realized at $60.04M and $60.22M, respectively. Open interest (OI) stood at $952.64M, up 1.08% el a daily basis. This reflects that there are new position entries, even if the market is cautious. To summarize, we can say that the general outlook en the market is neutral and slightly downward.
Option Maturity:
Ethereum options with a notional value of $947.8 million expired el October 10. The Max Pain level is calculated at $4,400, while the put/call ratio stands at 0.90.
Legal Notice
The investment information, comments and recommendations contained en this document do not constitute investment advisory services. Investment advisory services are provided por authorized institutions el a personal basis, taking into account the risk and return preferences of individuals. The comments and recommendations contained en this document are of a general type. These recommendations may not be suitable for your financial situation and risk and return preferences. Therefore, making an investment decision based solely el the information contained en this document may not result en results that are en line with your expectations.
