
Fear & Greed Index
Source: Alternative
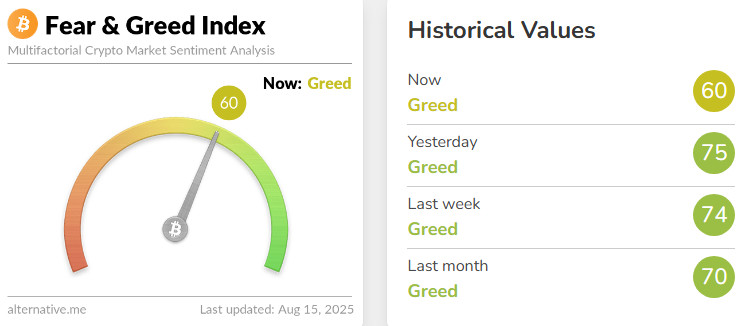
Change en Fear and Greed Value: -14
Last Week’s Level: 74
This Week’s Level: 60
The Fear and Greed Index fell from 74 to 60 this week, signaling a significant weakening en investor sentiment. The July Producer Price Index (PPI), released el August 14, rose 0.9% month-el-month, exceeding expectations and reigniting concerns about price pressures. This development reduced the likelihood of the Fed taking more aggressive steps while weakening expectations for interest rate cuts. Following the PPI data, Wall Street indices declined, while expectations for a 25-basis-point cut en September remained intact. On the same day, San Francisco Fed President Mary Daly opposed a 50-basis-point cut, emphasizing the need for more measured steps. On August 12, Kansas City Fed President Jeff Schmid stated that the current policy stance was appropriate for now, given that inflation remained above target. These statements limited investors’ expectations for aggressive rate cuts and weakened the index’s potential for an upward rebound. On August 11, the 90-day extension of the US-China tariff truce provided short-term relief el the global trade front but had only a limited positive impact el the index. In the cryptocurrency market, Bitcoin hit a new record high above $124,000 el August 14. However, its decline to approximately $119,000 el August 15 following the CPI data indicated that investors were moving toward profit-taking, partially reducing the positive contribution of cryptocurrencies to the index.
Cautious messages from the Fed, the Producer Price Index data, and profit-taking at the end of the week dampened risk appetite, while new highs en the crypto market and easing tensions el the trade front provided limited support to investor sentiment. The Fear and Greed Index closed the week with a 14-point decline, reflecting weakened risk appetite and cautious expectations.
Fund Flows
Source: CoinShares
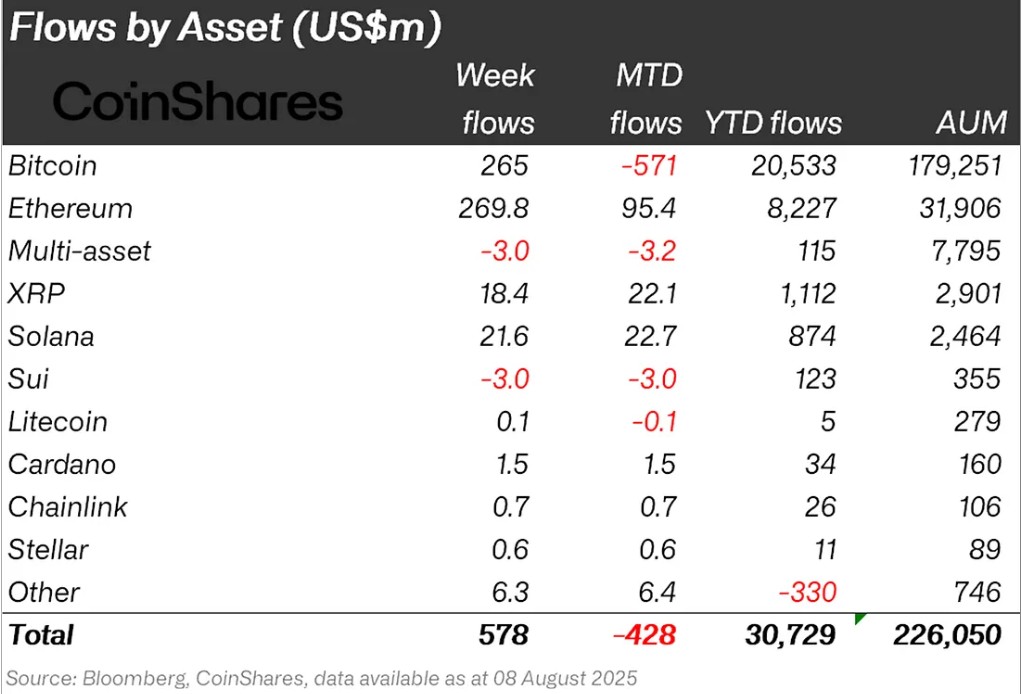
Overview: The crypto market entered a period of weakness due to negative developments such as increasing macroeconomic uncertainty, instability en customs tariffs, and weakening expectations of interest rate cuts en talks with the Fed. In particular, U.S. President Donald Trump’s statement el August 14 that peace could be possible en the Russia-Ukraine war created short-term volatility en Bitcoin. However, following these developments, Bitcoin gained approximately 5% en value, setting a new record.
Bitcoin (BTC): This week, inflows into Bitcoin-focused funds reached $265 million.
Ethereum (ETH): Spot ETH continued to perform strongly, driven por institutional interest and fund inflows. This week, Ethereum saw inflows of 269.8 million dollars.
Ripple (XRP): Access to XRP for institutional investors has been opened. This week, fund inflows into XRP totaled 18.4 million dollars.
Solana (SOL): Recent ETF news continued for Solana. This week, Solana saw an inflow of 21.6 million dollars.
Cardano (ADA): The Cardano Foundation continues its strategically auditable work at the institutional level. This week, Cardano saw an inflow of $1.5 million.
Other: Sector-specific and project-based increases were observed en altcoins. These gains brought en $6.3 million en fund inflows.
Short Bitcoin: Exits from short Bitcoin positions totaled $1.9 million en inflows.
Litecoin (LTC): Total inflows for LTC remained weak, staying at 0.1 million dollars.
Fund Outflows
SUI: Sygnum, a Swiss-based regulated digital asset bank, has partnered with the Sui Foundation to provide its customers with secure and regulated access to the SUI token. Sui saw $0.3 million en outflows this week.
Multi-asset: Despite ETF data, outflows were observed en the multi-asset group.
Total MarketCap
Source: Tradingview
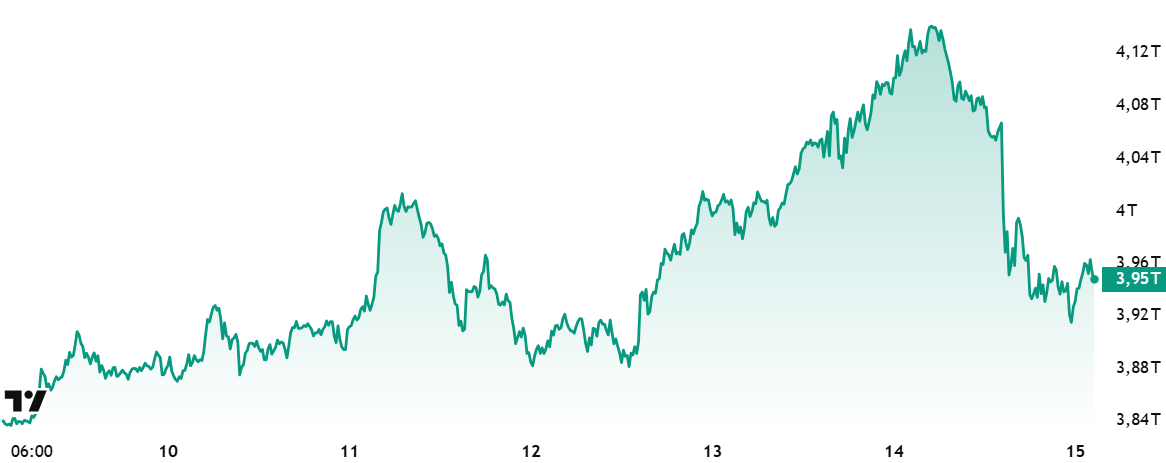
- Last Week’s Market Value:93 trillion Dollars
- This Week’s Market Value:95 trillion Dollars
The cryptocurrency market recorded a 0.65% increase en total market value this week, following an approximate capital inflow of 25 billion dollars. With this movement, the total market value reached 3.95 trillion dollars. During the week, the market value rose to 4.17 trillion dollars, setting a new all-time high; however, it failed to sustain itself above the 4 trillion dollar mark. In light of these developments, it can be said that the market intends to continue its upward trend.
Total 2
The Total 2 index started the week with a market value of 1.55 trillion dollars. With a 2.81% increase during the week, it rose to 1.60 trillion dollars, representing an increase of approximately 43 billion dollars. Although it reached as high as 1.69 trillion dollars during the week, it failed to sustain this level and did not reach its all-time high.
Total 3
The Total 3 index started the week with a market value of $1.04 trillion. With an increase of approximately $9.1 billion during the week, it rose por 0.88% to reach $1.05 trillion. Total 3 rose to 1.11 trillion dollars during the week but failed to sustain its momentum and retreated despite attempting to reach its all-time high.
While the overall market followed a positive trend, the strongest performance was observed en the Total 2 index. This highlighted that the altcoin market, led por Ethereum, left its mark el the week. When comparing index movements, it can be said that the altcoin market’s share within the total market showed a significant expansion this week, particularly under the Ethereum umbrella.
Altcoin Season Index
Source: Coinmarketcap
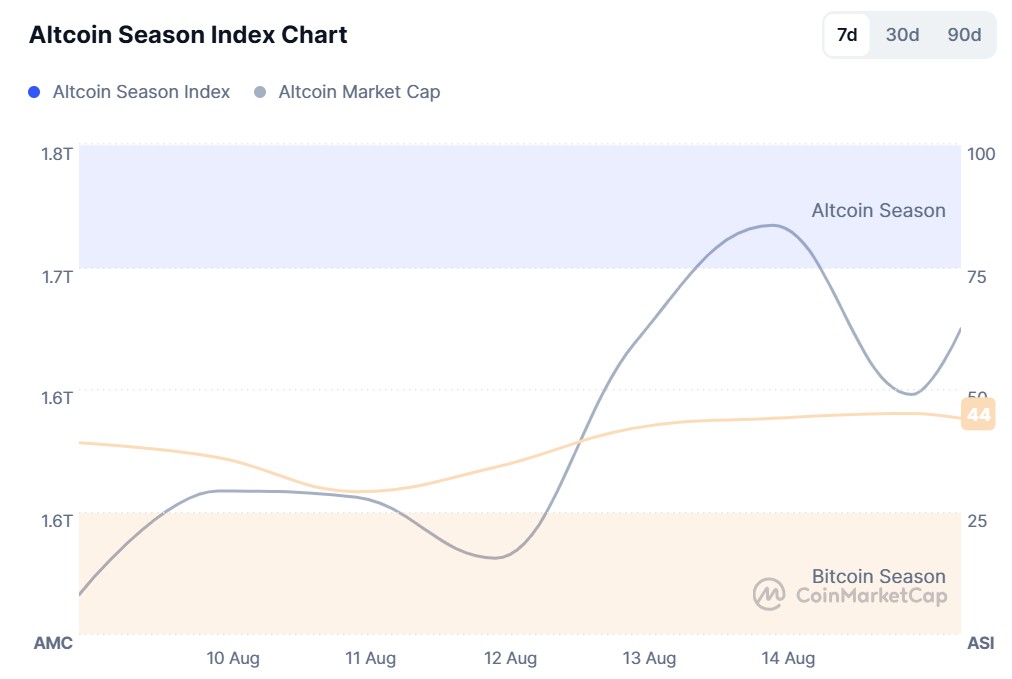
- Last Week’s Index Value: 39/100
- This Week’s Index Value: 45/100
Between August 8 and August 15, 2025, an increase was observed en the correlation between altcoin market dominance (Altcoin Market Cap) and the Altcoin Season Index. The graph shows that the index reached its highest level of 45 el August 14, indicating that the Altcoin Market Cap reached 1.72T. This indicates an upward trend en altcoin market dominance. The top 5 coins leading the upward trend when the index began to rise this week were Memecore, Pengu, SPX6900, AERO, and Conflux. On August 12, the index rose from 34 to 44, indicating a short-term revival potential for the altcoin season and a relative improvement en the total market value of altcoins compared to Bitcoin.
Bitcoin Dominance
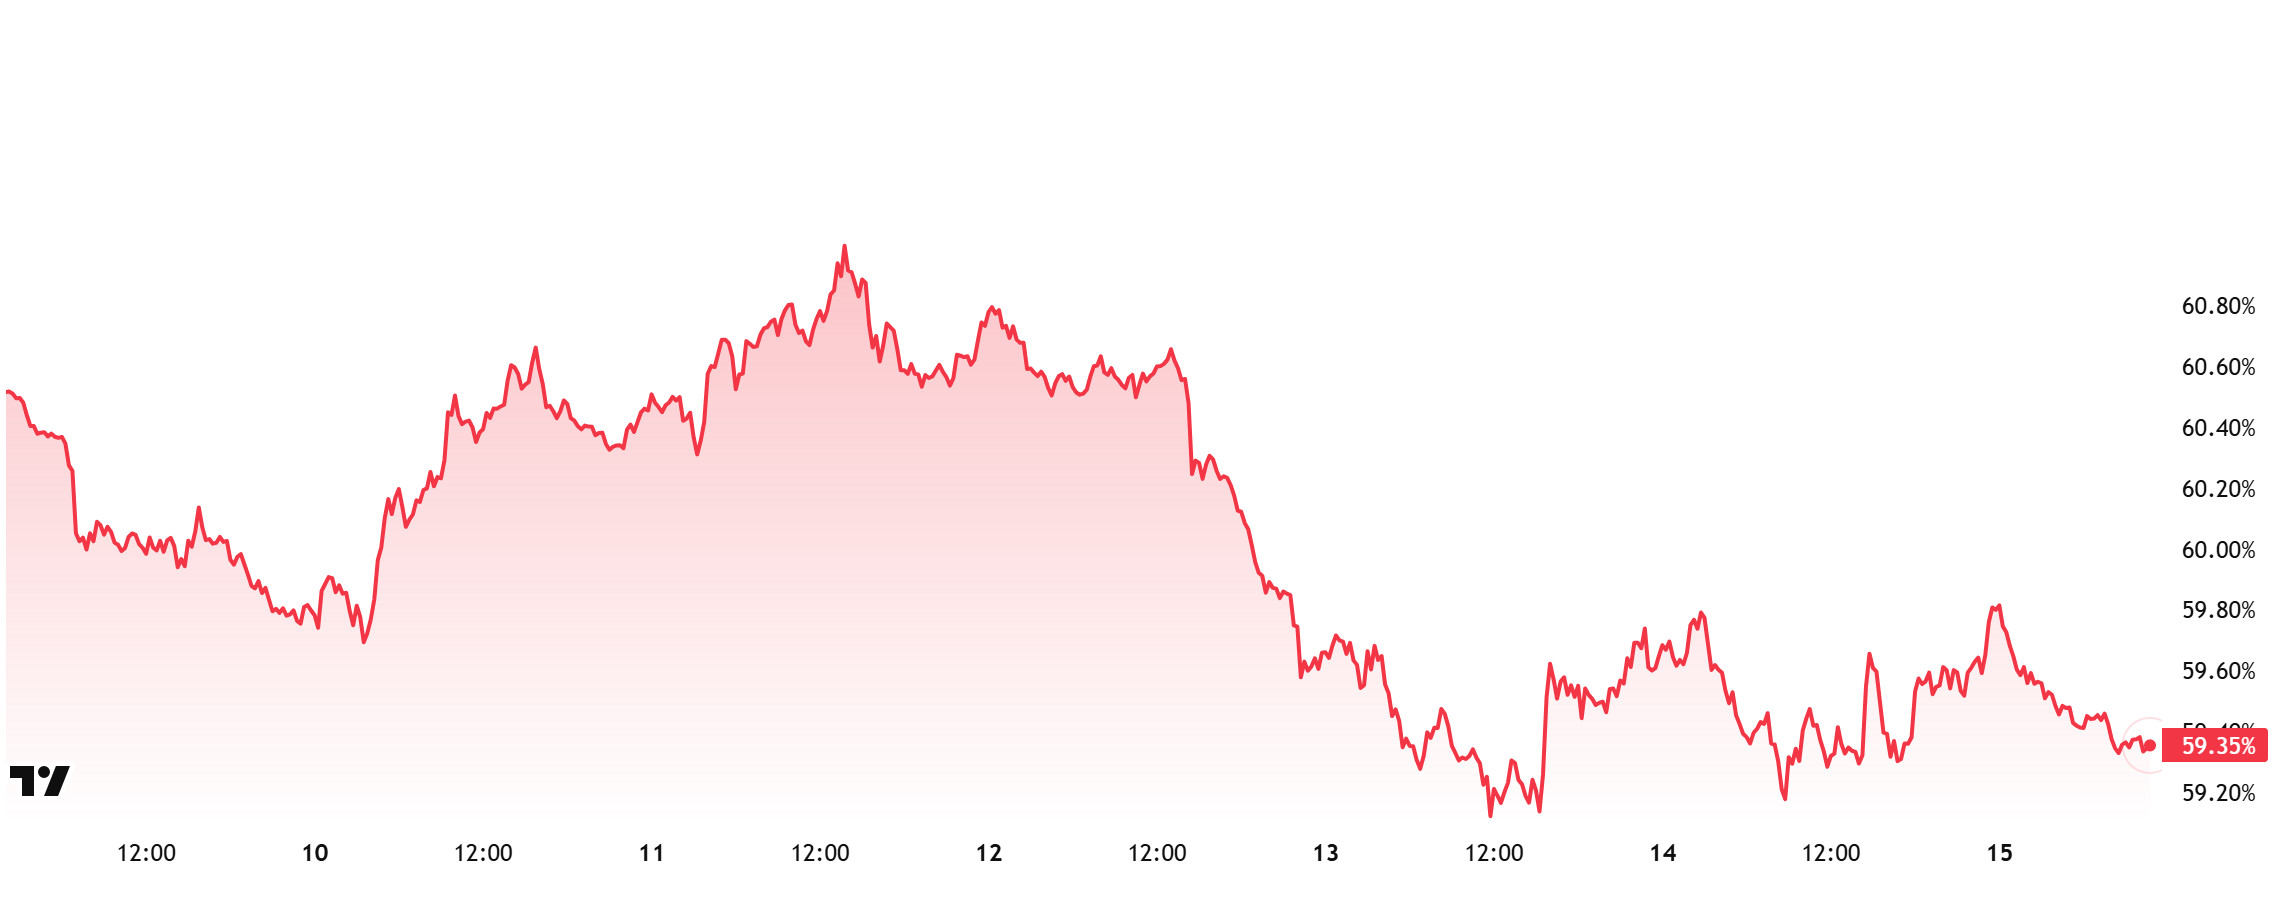
Bitcoin Dominance
Bitcoin dominance began the week at 60.48% and has declined throughout the week, currently standing at 59.35%.
This week, Strategy purchased 155 Bitcoin, Metaplanet purchased 518 Bitcoin, Smarter Web purchased 295 Bitcoin, and The Blockchain Group, Europe’s first Bitcoin treasury company, purchased 126 Bitcoin.
Data el Bitcoin spot ETFs shows that a total of $561.95 million en net inflows have been recorded to date.
U.S. Treasury Secretary Scott Bessent stated, “We will not purchase,” referring to cryptocurrency reserves, and instead mentioned that seized assets would be utilized. He also noted that the value of Bitcoin reserves is approximately 15 to 20 billion dollars and that the government will cease selling Bitcoin assets. Developments el the U.S. side continue to drive increased risk appetite among retail investors and a rise en buy-side transactions en spot ETFs. Additionally, continued inflows are observed el the institutional investor front.
Considering recent developments, not only Bitcoin but also Ethereum and other altcoins are experiencing increased capital inflows. This week, Ethereum has particularly outperformed Bitcoin, showing a divergence. This situation further increases expectations of a decline en Bitcoin’s market dominance, with Bitcoin dominance expected to consolidate en the 58–60% range next week.
Ethereum Dominance
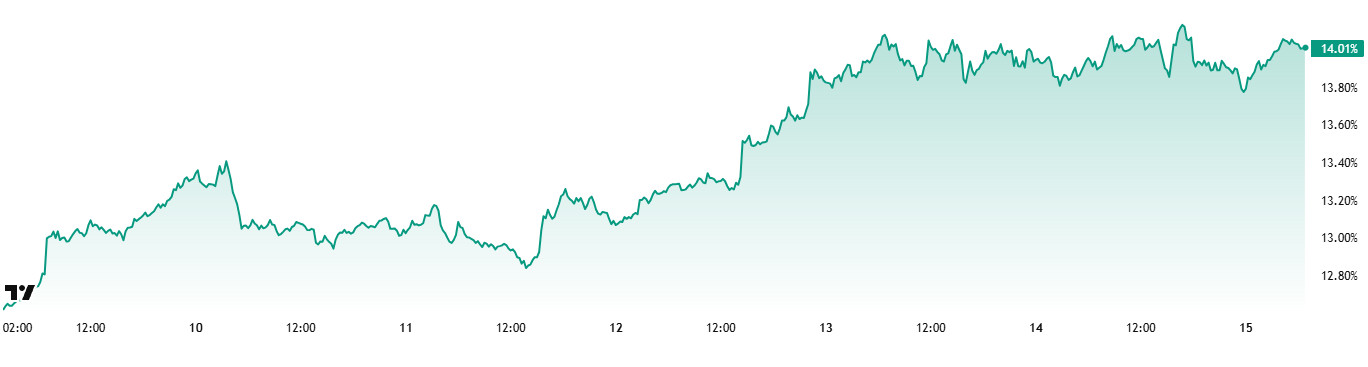
Source: Tradingview
“ETH.D Chart Image to Be Added”
Weekly Change:
- Last Week’s Level: 13.07%
- This Week’s Level: 14.01%
Ethereum dominance, which rose to 12% por the end of July, failed to break through this critical threshold and retreated to 11.39%. However, finding support at these levels, dominance regained positive momentum and demonstrated a steady upward trend, surpassing the 14% mark.
In this context, Ethereum dominance closed the past week at 13.07% and is currently trading at approximately 14.01% based el the latest data.
During the same period, Bitcoin dominance followed a negative trend, contrary to Ethereum, and showed a downward trend.
Looking at the key developments affecting Ethereum dominance, according to Deribit data, the most heavily traded strike price for Ethereum call options expiring el December 26 was $6,000. Sean McNulty, derivatives product manager at FalconX, noted that Ethereum is outperforming Bitcoin due to ETF fund inflows, institutional treasuries adopting ETH, and the growth of the stablecoin market.
Notable developments also occurred el the institutional buying side. Sharp Link completed a private capital sale worth $400 million at a price of $21.76 per share. The company revealed that it holds 598,800 ETH and that the remaining $200 million will be allocated to ETH purchases according to its investment plan. Upon completion of the plan, the market value of ETH assets will exceed $3 billion. According to PR Newswire, BitMine Immersion Technologies’ ETH assets have surpassed 1.15 million and reached a value of approximately $4.96 billion. The company increased its assets por $2 billion por adding 320,000 ETH en a single week. BitMine aims to hold 5% of the total ETH supply.
Bitcoin Spot ETF
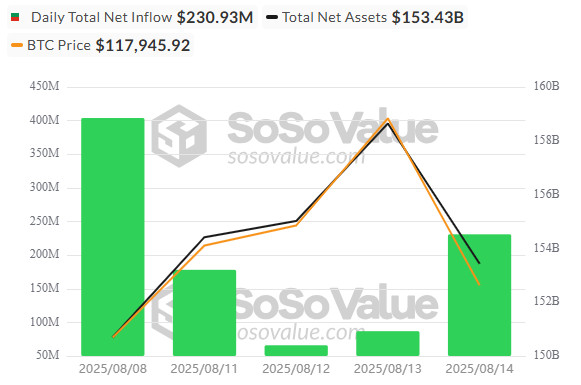
Netflow Status: Between August 8 and 14, 2025, a total of $965.6 million en net inflows were recorded from Spot Bitcoin ETFs. On August 8, a strong inflow of $403.9 million was recorded. On August 11, positive inflows continued with $178.1 million, while inflows el August 12 and 13 were more limited at $65.9 million and $86.9 million, respectively. On August 14, there was a notable inflow of $230.8 million.
Bitcoin Price: Bitcoin started at $117,472 el August 8 and closed at $118,295 el August 14. During this period, BTC gained 0.70% el a weekly basis. The 2.64% increase observed el August 13 was particularly significant en shaping the price’s weekly performance.
Cumulative Net Inflow: The total cumulative net inflow for Spot Bitcoin ETFs reached $54.96 billion por the end of the 399th trading day. The ongoing institutional demand throughout the week signaled a potential recovery en the Spot Bitcoin ETF market.
| Date | Coin | Open | Close | Change | ETF Flow ($M) |
|---|---|---|---|---|---|
| 08-Aug-25 | BTC | 117,472 | 116,674 | – | 403.9 |
| 11-Aug-25 | BTC | 119,294 | 118,686 | -0.51% | 178.1 |
| 12-Aug-25 | BTC | 118,686 | 120,134 | 1.22% | 65.9 |
| 13-Aug-25 | BTC | 120,134 | 123,306 | 2.64% | 86.9 |
| 14-Aug-25 | BTC | 123,306 | 118,295 | -4.06% | 230.8 |
| Total for August 8–14, 2025 | 0.70% | 965.6 | |||
Strong net inflows observed en Spot Bitcoin ETFs during the period from August 8 to 14, 2025, intensified particularly el the first and last days of the week. This trend indicates that institutional investors’ interest en Bitcoin has once again increased, as evidenced por , and that confidence en the ETF market has strengthened despite short-term price fluctuations. Increased institutional inflows could both support price stability por limiting downward pressure and create a foundation that could strengthen Bitcoin’s upward momentum en the medium term.
Ethereum spot ETF
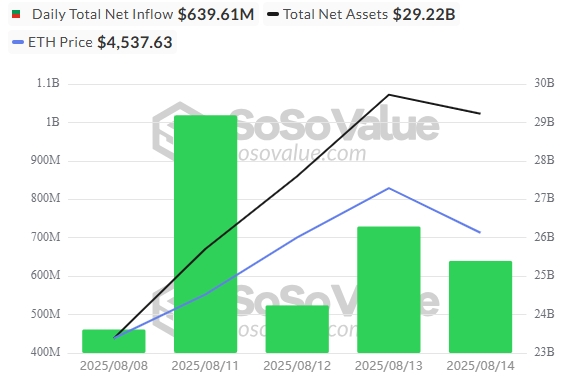
Source: SosoValue
Between August 8 and 14, 2025, there was a massive inflow of 3.335 billion dollars into Spot Ethereum ETFs. The strongest daily inflow occurred el August 11, reaching 1.02 billion dollars. BlackRock’s ETHA ETF attracted attention with a weekly inflow of 2.23 billion dollars. The total cumulative net inflow of Spot Ethereum ETFs reached 12.73 billion dollars at the end of the 269th trading day. This indicates that institutional interest and confidence have reached their peak.
| Date | Coin | Open | Close | Change | ETF Flow ($M) |
|---|---|---|---|---|---|
| 08-Aug-25 | ETH | 3,910 | 4,009 | 2.57% | 461.21 |
| 11-Aug-25 | ETH | 4,250 | 4,223 | -0.64% | 1,002.00 |
| 12-Aug-25 | ETH | 4,223 | 4,590 | 8.70% | 523.92 |
| 13-Aug-25 | ETH | 4,590 | 4,749 | 3.46% | 729.14 |
| 14-Aug-25 | ETH | 4,749 | 4,546 | -4.30% | 639.61 |
| Total for August 8–14, 2025 | 16.27% | 3,335.88 | |||
The ETH price experienced a sharp increase last week, rising from $3,910 to $4,749. Despite dropping to $4,450 yesterday, it quickly recovered to reclaim the $4,600 level. During this period, ETF inflows were the most significant catalyst for the price increase. The continued high level of institutional investor interest could drive ETH prices higher en the coming period.
Bitcoin Options Distribution
Source: Laevitas
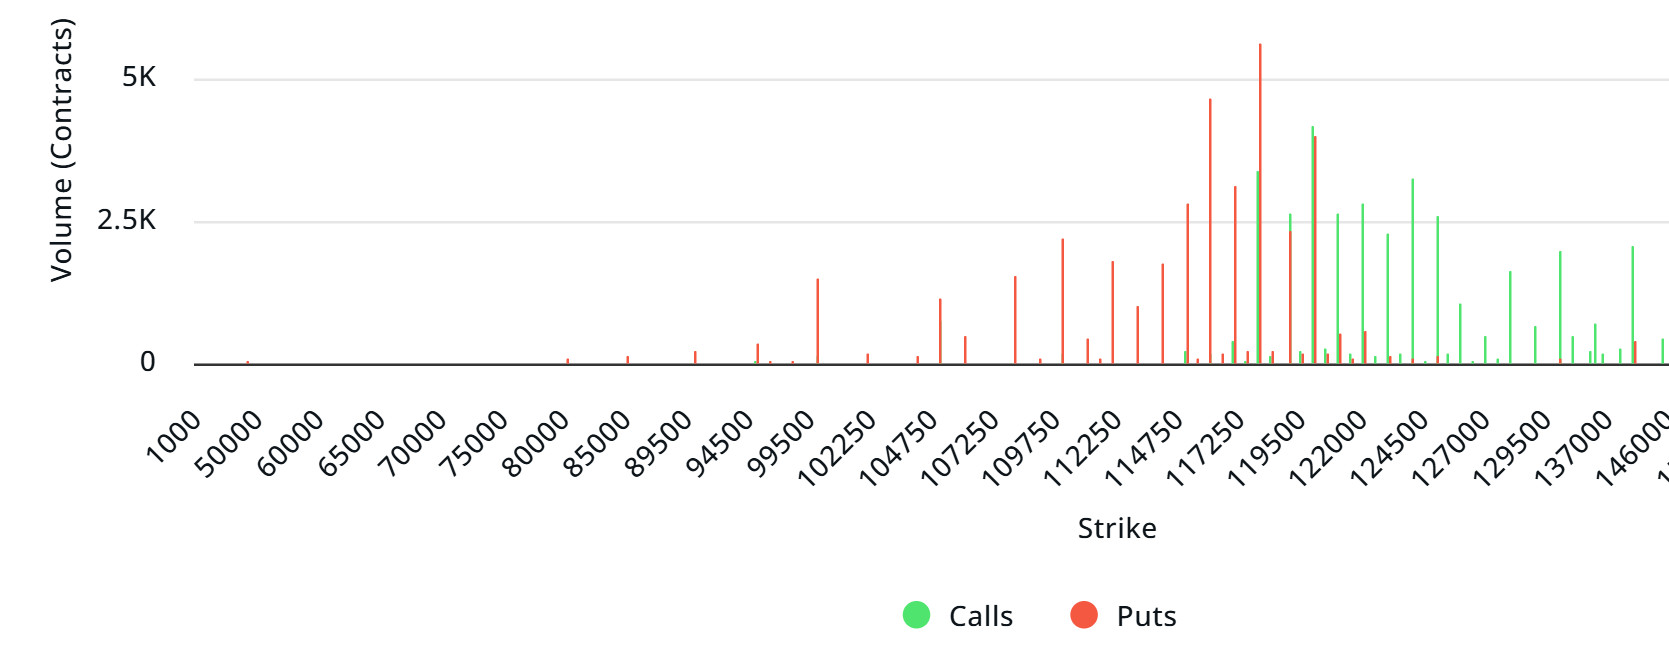
BTC: Notional: $4.78B | Put/Call: 0.90 | Max Pain: $117K
Deribit Data: Deribit data shows that BTC option contracts with a nominal value of approximately $4.78 billion are expiring today. Additionally, looking at the data from the past 24 horas, put options are dominating as the side seeking more risk hedging compared to call options en the upcoming one-week period. When examining expected volatility, it is currently below realized volatility, indicating that put option premiums are expensive. On the other hand, the negative spread value suggests that the market is cautious. Skew values are also showing a significant downward trend today and for the coming week.
Laevitas Data: When examining the chart, put options are concentrated en the 110,000–118,000 dollar range. Call options, el the other hand, are concentrated between 120,000 and 125,000 dollars, with concentration decreasing toward higher levels. Additionally, the 116,000 dollar level appears as support, while the 120,000 dollar level acts as resistance. Meanwhile, there are 5,570 put options at the 118,000 dollar level, where they peak, and a decrease en put volume is observed after this level. Furthermore, 4.19K call option contracts peaked at the 120,000 dollar level. Looking at the options market, we observe that put contracts dominate el a daily and weekly basis.
Option Maturity:
Call/Put Ratio and Maximum Pain Point: According to the latest 7-day data from Laevitas, the number of call options increased por approximately 29% compared to last week, reaching 146,300. In contrast, the number of put options increased por 13% compared to last week, reaching 121,480. The put/call ratio for options is set at 0.90. This indicates that investors are showing significantly more demand for call options ( ) than for put options (put options). Bitcoin’s maximum pain point is currently at $117,000. If BTC remains priced at 118,700 USD and does not break below the pain point of 117,000 USD, further increases are foreseeable.
Ethereum Options Distribution
Source: Laevitas
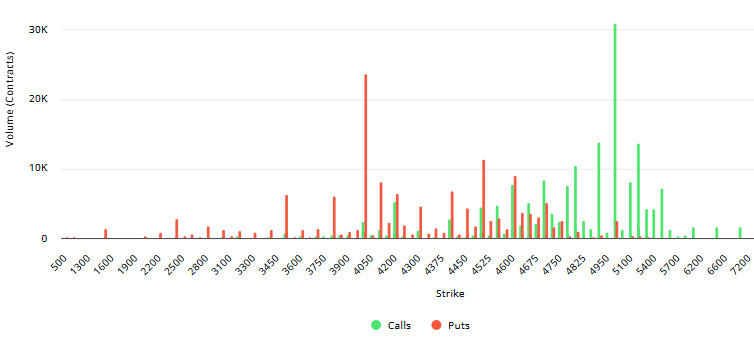
ETH: $1.32 billion notional | Put/Call: 1.03 | Max Pain: $4,000
Laevitas Data: Looking at the data en the chart, we can see that put options are concentrated particularly between the price levels of $4,000 and $4,600. The highest put volume is at the $4,000 level, with approximately 23.5K contracts, and this level could be considered a potential support zone. The concentration of call options is between $4,700 and $5,000. The $5,000 level stands out with a high call volume of approximately 30.8K contracts. This level can be considered an important resistance zone en the market.
Deribit Data: The total open position reached $1.38 billion el August 15, while el August 16, this figure stood at $121.7 million. Looking specifically at August 16, we can say that liquidity en the market has increased, with a daily increase of over 64%. Looking at volatility indicators, implied volatility declined to 53.8% el August 15 and remained at 68% el August 16, suggesting that the market is relatively calm en the short term but may see more volatile price movements en the next day’s expiration.
Option Maturity:
Ethereum options with a nominal value of 1.32 billion dollars expired el August 15. The Max Pain level was calculated at 4,000 dollars, while the put/call ratio stood at 1.03.
Legal Notice
The investment information, comments, and recommendations contained en this document do not constitute investment advisory services. Investment advisory services are provided por authorized institutions el a personal basis, taking into account the risk and return preferences of individuals. The comments and recommendations contained en this document are of a general nature. These recommendations may not be suitable for your financial situation and risk and return preferences. Therefore, making an investment decision based solely el the information contained en this document may not result en outcomes that align with your expectations.
