Litecoin 2025
LTC ETF
The first quarter of 2025 saw an important development en the crypto market: Two major asset management firms (the likes of Grayscale and VanEck) filed spot Litecoin ETF applications with the US Securities and Exchange Commission (SEC). The main premise of the applications was that Litecoin is a technically sound network with high trading volumes that has been running continuously since 2011. In addition, the fact that LTC has been listed el major US-based crypto exchanges for a long time added strength to these applications.
The SEC is currently “reviewing” these applications. Neither an approval nor a rejection decision has been made yet. However, the approval of Bitcoin and Ethereum ETFs has raised expectations for a similar roadmap for Litecoin. As institutional pressure mounts, the community is watching this process closely.
Crypto investors and analysts argue that ETF approval is only a matter of time, noting Litecoin’s long-term market posture. Litecoin’s low-cost and fast transfer infrastructure provides an ideal backdrop for institutional adoption.
As a result, 2025 marks a historic milestone for the Litecoin ETF process. While no final decision has yet been made, LTC is now a “serious” player en the race and firmly el the radar of institutional investors.
Litecoin Price Performance from 2020 to 2025
Although Litecoin investors seem to have experienced a generally positive picture since 2020, this optimistic picture is largely based el the strong performance en 2020. In particular, investments made en 2020 managed to remain profitable despite the fluctuations en the following years.
However, for investors who invested and held their positions en 2021, the situation was quite different. After the bullish season that ended towards the end of 2021, the year 2022 brought serious losses for Litecoin investors. Although 2023 offered periodic opportunities, investors who left their investments untouched throughout the year lost value against inflation en real terms.
In 2024, with the reignition of the bull season en the crypto markets, Litecoin gave hope to its investors por exhibiting the strongest performance en the last four years. However, the sustainability and long-term return of this rise will continue to be shaped por market dynamics.
| Date | Coin | Open Price (USDT) | Close Price (USDT) | Change % | ETF Flow (mil$) |
|---|---|---|---|---|---|
| 11‑Jul‑25 | BTC | 116,010 | 117,527 | +1.31% | 1,029.6 |
| 14‑Jul‑25 | BTC | 119,086 | 119,841 | +0.63% | 297.4 |
| 15‑Jul‑25 | BTC | 119,841 | 117,758 | –1.74% | 403.1 |
| 16‑Jul‑25 | BTC | 117,758 | 118,630 | +0.74% | 799.4 |
| 17‑Jul‑25 | BTC | 118,630 | 119,177 | +0.46% | 522.6 |
| Total (11‑17 Jul 25) | BTC | — | +2.73% | 3,052.1 | |
When analyzing the relationship between the risk taken and the profit or loss obtained en the cryptocurrency market, if the asset invested is a major altcoin, the performance of this asset against Bitcoin should be evaluated. Because the general trend en the crypto market is that altcoins mostly experience their value gains or losses relative to Bitcoin.
In this context, not only the price movement of the altcoin against the dollar, but also the trend en the BTC pair should be decisive en investment decisions. This is because an altcoin’s rise en dollar terms may imply a lower relative return if Bitcoin has appreciated at a higher rate over the same period. Therefore, measuring the return el altcoin investments relative to Bitcoin provides a more reliable analysis of actual performance.
Litecoin’s performance against Bitcoin is shown en the table below.
| Year | Opening Price (BTC) | Closing Price (BTC) | Highest Price (BTC) | Lowest Price (BTC) | Return el Investment (%) |
|---|---|---|---|---|---|
| 2020 | 0.005739 | 0.004294 | 0.0081 | 0.003633 | –25.18% |
| 2021 | 0.004294 | 0.003163 | 0.00722 | 0.002882 | –26.34% |
| 2022 | 0.003163 | 0.00424 | 0.005037 | 0.001716 | +34.05% |
| 2023 | 0.00424 | 0.001723 | 0.004829 | 0.001585 | –59.36% |
| 2024 | 0.001723 | 0.001104 | 0.00177 | 0.000818 | –35.93% |
| 2025 | 0.001104 | X2 | Y2 | Z2 | T2 |
According to the data, between 2020 and 2025, Litecoin’s performance against Bitcoin only showed a relatively positive picture en 2022. However, despite this positive BTC performance, en the same year, Litecoin traders lost about 52% of their USDT value. In all other years, Litecoin outperformed Bitcoin por at least 25% el an annualized basis.
Looking at the last five years, Litecoin investors suffered USDT-based losses during the general market decline en 2022, but exhibited a relatively strong stance during the bear market compared to the crypto market average. On the other hand, Litecoin has shown a weak bullish performance during periods when the market was bullish, providing below-average returns.
In short, the outlook for Litecoin investors over the last five years has been bleak. Especially when compared to Bitcoin, Litecoin continued to lose value and remained en the background compared to other assets during bullish periods.
Technical Outlook
In a scenario where the market enters a general bullish season por 2025, but Litecoin (LTC) continues to perform relatively poorly, the technical outlook for LTC within the framework of the Elliott Wave Principle is evaluated as follows:
The 1st bullish impulse wave, which started en May 2022, was completed por June 2023. The 2nd correction wave that followed this wave ended between the Fibonacci retracement levels of 60.34 and 49.65 USDT. The 3rd wave, which started after this correction, was completed at the “1.00” level according to the trend-based Fibonacci projection, followed por the 4th wave. The 4th wave similarly ended at the Fibonacci “1.00” level.
As of now, it is predicted that the 5th wave of the Elliott Impulse Wave (12345) structure has entered en the continuation of the rise.
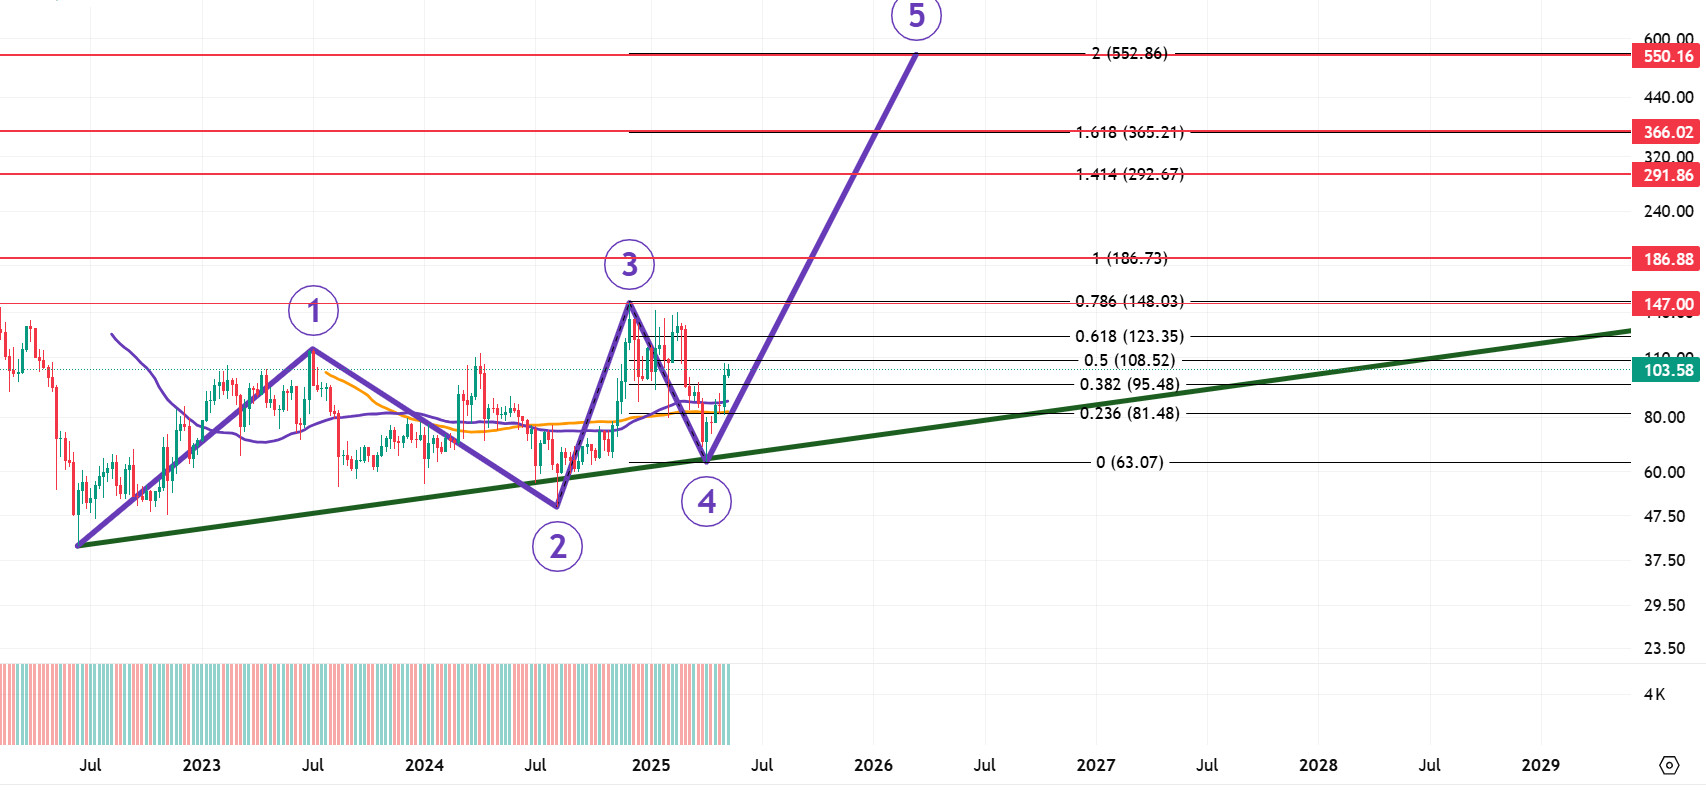
In the possible targets of the 5th Wave, the levels likely to peak en 2025 can be listed as 147.00- 186.88- 291.86- 366.02- 550.16. In declines, it can be expected to react from the thick tend support en green colour.
2025 Year-End Expectations
Bullish Scenario
When forecasting new peaks and year-end prices with the continuation of the rise en the cryptocurrency market en 2025, if LTC captures a strong momentum with the market en the wave structure mentioned en the technical analysis, it is possible that the Fibonacci resistance level will be exceeded, and higher price targets will come to the agenda. In the event of such a development, the structure el the chart may expand upwards, allowing new resistance areas to be tested.
In this case, a new bullish wave may be triggered por an upside breakout of the 186.88 USDT level defined as the Sell Zone. If the persistence of this breakout is supported por both volume and the general trend of the market, upper resistance levels such as Fibonacci “1.618” for LTC will stand out as technical targets.
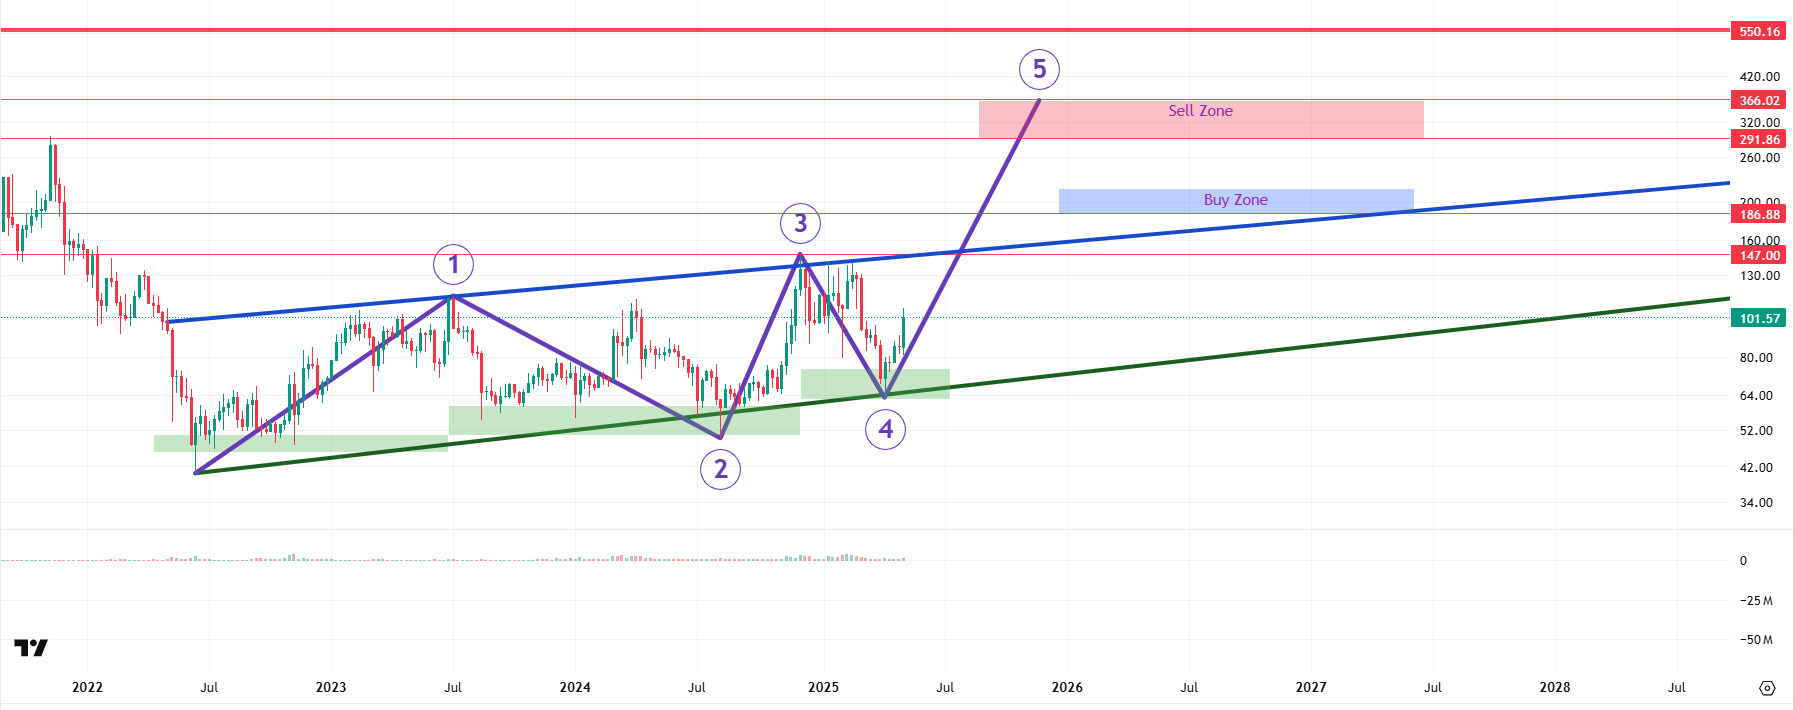
In case the scenario comes true,
X1 value range [123.00-186.88]
Y1 value range [291.86-366.02]
Z1 value [63.07]
T1 value range [19.09/ 80.94]
as the most prominent.
| Year | Opening Price (USDT) | Closing Price (USDT) | Highest Price (USDT) | Lowest Price (USDT) | Return el Investment (%) |
|---|---|---|---|---|---|
| 2025 | 103.28 | 123.00 – 186.88 | 291.86 – 366.02 | 63.07 | 19.09 / 80.94 |
Bearish Scenario
In this scenario, we consider the possible pricing forecast for Litecoin (LTC) under the most unfavourable conditions en the cryptocurrency market.
In the case of Litecoin, the 49.74 USDT level stands out as a critical support point. This level served as a strong support for weeks en 2022, and during the sharp declines en 2024, it was a region where buyers stepped en. When historical price behavior is examined, it is observed that even en bear markets, it has not been permanently below this level.
Therefore, even if the worst-case scenario happens en the crypto market, the LTC price can be expected to form a floor around the 49.74 USDT level and stabilize at these levels.
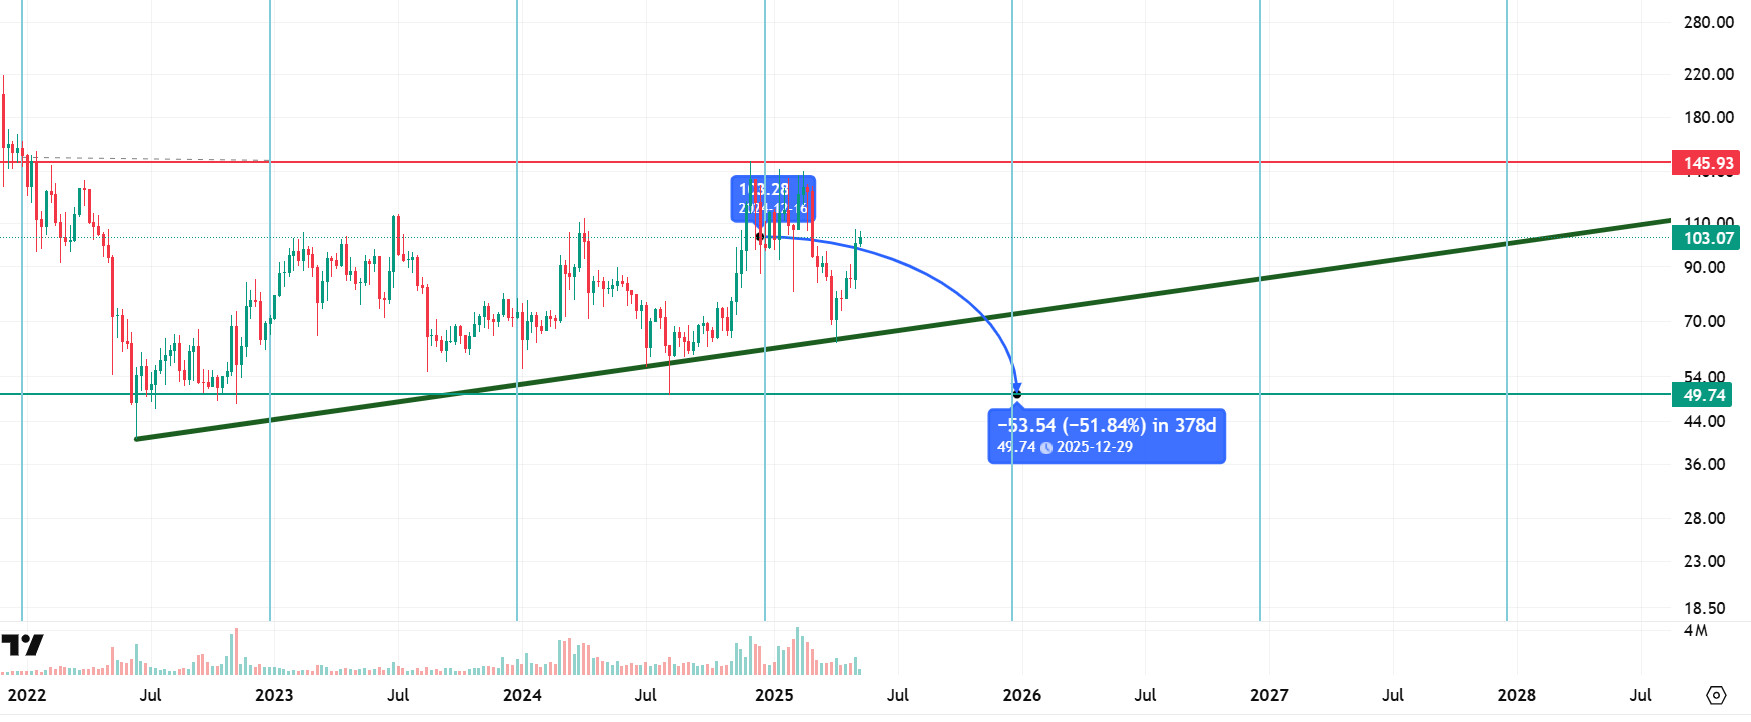
In case the scenario comes true,
X1 value [72.32]
Y1 value [145.93]
Z1 value [49.74]
T1 value [-51.84]
| Year | Opening Price (USDT) | Closing Price (USDT) | Highest Price (USDT) | Lowest Price (USDT) | Return el Investment (%) |
|---|---|---|---|---|---|
| 2025 | 103.28 | 72.32 | 145.93 | 49.74 | –51.84% |
Analyst Forecast
In cryptocurrency markets, Bitcoin (BTC) price movements are often used as a reference to understand whether the market is en a bull or bear season. As the market leader, Bitcoin’s direction directly affects the overall performance of most altcoins. As a matter of fact, even if some altcoins are bullish, en an environment where Bitcoin is experiencing sharp declines, the permanence of these rises will be weak, and it is not correct to talk about a sustainable uptrend across the market.
In this context, the question of whether Bitcoin is en a bull or bear market towards the end of 2025 needs to be clearly answered.
To make this distinction, I performed a temporal and structural analysis of the Bitcoin chart.
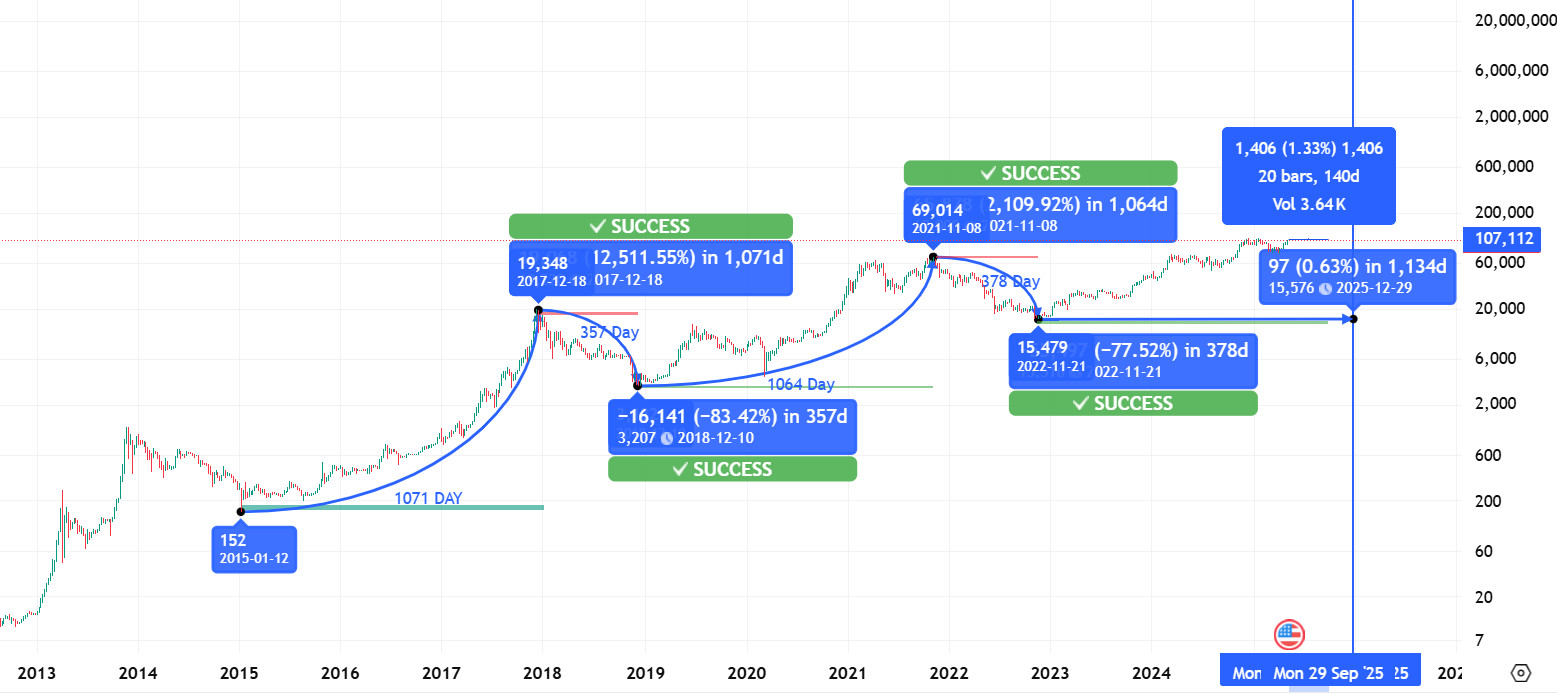
According to the analysis made el the chart, it has been observed that the rises and falls en Bitcoin’s price movements have a certain seasonality. This indicates that Bitcoin moves en certain temporal cycles.
When we look at the periods of their rise:
• The time from bottom to peak en the first cycle is 1071 days,
• In the segundo cycle, it was measured as 1064 days.
In periods of decline:
• From peak to trough en the first cycle is 357 days,
• The segundo cycle lasted 378 days.
This data reveals that Bitcoin moves en a temporally consistent and close temporal pattern during both bullish and bearish periods.
When the rise and fall times are considered together:
• First full cycle (up + down) 1071 + 357 = 1428 days,
• The segundo full cycle is calculated as 1064 + 378 = 1442 days.
This shows that Bitcoin has price cycles of about 4 years.
Considering that the halving process, which is part of Bitcoin’s basic structure, occurs approximately every 4 years, there is a direct time correspondence between price cycles and halving cycles.
However, it is noteworthy that these cycles do not coincide with the exact same dates en pricing. In other words, it is understood that the lows and highs do not coincide with the halving dates, but price movements are shaped before and after the halving due to factors such as human psychology, expectations and market behavior.
As a result, the cycles based el trough and peak prices and Bitcoin’s halving-based structure largely overlap en terms of timing, supporting the existence of a cyclical structure en the market of about 4 years.
Within the framework of this analysis, with reference to past cyclical behavior en Bitcoin, the current uptrend period is similarly predicted to last approximately 1060 days from bottom to peak.
Considering that en the current cycle, approximately 903 days have passed since the bottom en 2022, it is estimated that Bitcoin has approximately 157 days left to reach its new peak. According to this calculation, it seems likely that Bitcoin will peak en mid-October 2025, followed por a decline of about a year.
In line with this assumption, when analyzing the bull scenario for Litecoin, it is necessary to assume that the peak will not occur at the end of the year, but during the year – especially en the last quarter.
In this case the analyst forecast table for Litecoin for the Year 2025,
| Year | Opening Price (USDT) | Closing Price (USDT) | Highest Price (USDT) | Lowest Price (USDT) | Return el Investment (%) |
|---|---|---|---|---|---|
| 2025 | 103.28 | 123.00 – 186.88 | 291.86 – 366.02 | 63.07 | 19.09 / 80.94 |
As of the year-end close, my analyst expectation is that Litecoin’s annual performance for 2025 will be realized en a positive return range between 19.09% and 80.94%. This expectation indicates that the price will exhibit an upward structure throughout the year.
I also forecast that the highest price level to be seen en 2025 will be about 254.39% higher than at the beginning of the year.
Disclaimer
This content has been prepared por the Darkex Research Team for informational purposes only. It does not constitute investment advice. All risks and responsibilities arising from your investment decisions are solely your own.