
What Awaits Us?
Macroeconomic Data
US Non-Farm Payrolls (NFP): March 7, 13:30 UTC
US Consumer Price Index (CPI): March 12, 12:30 UTC
FED Interest Rate Decision (FOMC): March 19, 18:00 UTC
US Personal Consumption Expenditures (PCE): March 28, 12:30 UTC
Crypto
Ethereum
Ethereum developers have made the client software for the Pectra upgrade available el the Holesky and Sepolia test networks. Accordingly, the first test of Pectra will be completed el the Holesky network el February 24, while the segundo test will take place el the Sepolia network el March 5.
Solana
SIMD-0228, the new governance proposal causing a stir en the Solana ecosystem, envisions significant changes to the network’s emission program. The proposal, drafted por Multicoin Capital’s Tushar Jain and Vishal Kankani with support from Anza’s Chief Economist Max Resnick, will be put to a vote for the 6th term, which is expected to begin el March 753.
Altcoin Developments
Recently, there has been an increase en Exchange Traded Fund (ETF) applications for various crypto assets. In particular, applications for altcoins such as Ripple (XRP), Solana (SOL), Litecoin (LTC), Dogecoin (DOGE), Cardano (ADA) and Hedera (HBAR) have attracted attention. Throughout March, new developments and possible approval processes will be closely monitored.
Crypto Insigth
| Market Overview | Current Value | Change (30d) |
|---|---|---|
| Bitcoin Price | $86,500 | -15.05 % 📉 |
| Ethereum Price | $2,359 | -25.90 % 📉 |
| Bitcoin Dominance | 60.89 % | 3.09 % 📈 |
| Ethereum Dominance | 10.08 % | -9.94 % 📉 |
| Total Market Cap | $2.82 T | -17.66 % 📉 |
| Fear and Greed Index | Extreme Fear (10) | Greed (72) |
| Crypto ETFs Net Flow | $-848.9 M | N/A |
| Open Interest – Perpetuals | $467.8 B | N/A |
| Open Interest – Futures | $3.8 B | N/A |
*Prepared el 27.02.2025 at 13:14 pm. (UTC)
Summary of the February
Flow por Asset
| Asset | Week 1 | Week 2 | Week 3 | Week 4 | Total ($) |
|---|---|---|---|---|---|
| Bitcoin (BTC) | 486 | 407 | -430 | -571 | -108 |
| Ethereum (ETH) | -0.3 | 793 | -7.2 | 3.7 | 789.2 |
| XRP (Ripple) | 14.7 | 21.1 | 8.5 | 38.3 | 82.9 |
| Solana (SOL) | 4.5 | 11.2 | 8.9 | 9.0 | 33.6 |
| Litecoin (LTC) | -0.2 | 1.2 | 1.1 | – | 2.1 |
| Cardano (ADA) | 1.0 | 2.6 | 1.9 | 0.1 | 5.6 |
| SUI | – | 4.3 | 6.0 | 1.5 | 11.8 |
| Other’s | 5.9 | 5.9 | -3.9 | 6.0 | 13.9 |
The first half of February was marked por strong inflows into digital assets. However, en the segundo half of the month, purchases diminished and sales came to the fore. Total monthly inflows fell to $954 million, down 80% compared to the previous month. In the first week, totaled 527 million USD, while outflows amounted to 530 million USD. In the segundo week, inflows totaled $556 million and outflows were recorded as $415 million. The third week saw one of the lowest inflows with only 26 million dollars; outflows were 441 million dollars. The fourth week saw inflows of 62 million dollars, while outflows reached 571 million dollars.
Total Market Cap
The total value of the cryptocurrency market fell por 9.17% en the first 9 days of February. The following week saw a 1.21% rise en recovery efforts. In the third week, the market lost 0.07%, while the sharpest movement took place en the last week of February, when the market fell por 8.25%. This latest decline brought the total market capitalization below $3 trillion, a 16.66% drop el a monthly basis. The total market shrinkage amounted to $577.53 billion. If the pullbacks continue, it may be possible for the market capitalization to fall as low as $2.6 trillion.
Spot ETF
In terms of spot Bitcoin ETFs, net outflows were evident en February. Between February 03-25, there were net outflows totaling $2,405.8 million. During this period, the Bitcoin price fell 10.61% from $102,379 to $91,514. Especially large fund outflows increased the selling pressure en the market, strengthening the negative impact el the price.
While the uncertainty en global economic markets has also had an impact el the crypto market and ETFs, fund outflows from ETFs are expected to continue en March.
Despite a net inflow of $267.4 million into Ethereum ETFs between February 01-25, 2025, the ETH price fell 24.4% from $3,299 to $2,494, indicating that market dynamics are subject to strong selling pressure regardless of ETF flows. If investor appetite remains low and risk sentiment remains high en March due to global economic uncertainties, demand for Ethereum ETFs may remain weak and ETH price volatility may continue.
Options Data
In the Bitcoin options market, $2.54 billion worth of BTC contracts expired en the first week, while this figure dropped to $1.58 billion por the end of the month. Call options were concentrated en the $95,000 – $110,000 band, with a total of 241.03K expiring, while put options expired with 143.53K en the $88,000 – $105,500 range. Put/Call ratio stood at 0.61. The maximum pain point was calculated as 99,000 dollars el average. The most popular options transaction for March was the $110,000 call options due March 28, with investors paying a total premium of more than $6 million for these positions.
In the Ethereum options market, Call options were more concentrated than Put options last month. At $3,200-3,300, there was a high volume of Call options, while Put options were concentrated en the range of $2,575-2,675, forming support levels. The Maximum Pain Point was recorded at $ 2,750, while the Put/Call ratio was 0.57. At the end of the month, Ethereum tried to hold at $ 2,500 levels with selling pressure en areas where Call options were concentrated, but fell to $ 2,300. In March, with the Pectra update, there is a significant concentration of Call options due March 28, 2025.
Expectations of the March
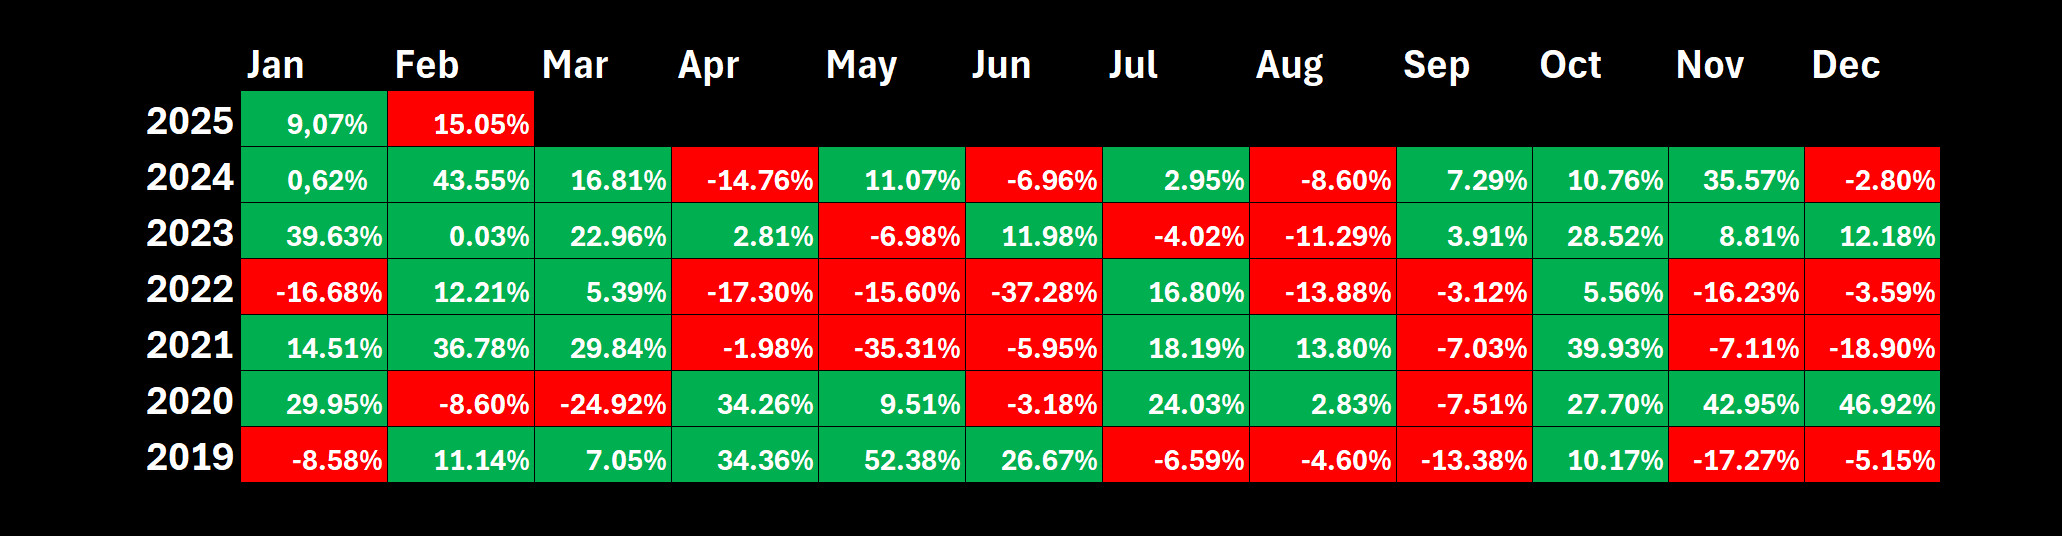
Bitcoin fell sharply to around $82,000 as the end of February approached. On a monthly basis, Bitcoin, which displayed a distant outlook from its February performances en previous years, surprised investors por recording a 15.05% decline.
Looking at March, historical data shows that deep declines have been experienced from time to time en the last decade. However, it is noteworthy that this trend has gradually evolved into limited rises since 2020. Bitcoin returned an average of 13% en March, but if we exclude the sharp rise en 2013, this rate drops to 5%.
While the negative close en February shows that Bitcoin has diverged from its historical trends, it can be predicted that a limited upward movement may be possible en March with volatility. In this process, the macroeconomic data en the rest of the report and Trump’s latest attempts el tariffs stand out as important factors that increase uncertainty en the markets.
*Prepared el 27.02.2025 at 13:14 pm. (UTC)
Source: Darkex Research Department
Trump’s latest tariff threats against the EU have significantly contributed to the escalation of global trade tensions as the US President also plans to impose tariffs el key trading partners such as Canada and Mexico.
US President Donald Trump announced plans to impose a 25 percent tariff el goods imported into the US from the European Union (EU) during a cabinet meeting el Wednesday. “Tariffs will continue, not all, but many,” Trump said.
Asked about the level of tariffs el the EU, Trump said, “We have made a decision, we will announce it very soon, and it will be 25 percent en general. This will apply to cars and other things. The European Union was created to destroy the United States, but now I’m president.”
Timing of Tariffs
Trump’s announcement that he would not halt the tariffs el Canada and Mexico, but at the same time announced that they would take effect el April 2, caused confusion. The US President imposed 25% tariffs el imports from Canada and Mexico with the decree he signed el February 1. While these tariffs were expected to take effect el February 4, Trump made a surprise move and announced a 30-day delay en exchange for increased security at the border . However, Trump stated that both reciprocal tariffs and new tariffs el some sectors would take effect el April 2, as he had previously stated. These developments continue to increase uncertainties en global trade markets.
As a result, tariffs stand out as an important factor increasing the selling pressure en global markets. In addition to traditional markets, crypto assets are among the instruments most affected por this pressure. Accordingly, the announcements and decisions regarding tariffs en March may lead to significant price movements en the markets. Such regulations, which increase trade tensions, are among the critical developments that investors should carefully follow.
Market Pulse
After a Difficult February…
The past month has been a challenging period for digital assets. Both the dynamics of traditional markets and crypto-specific news flow weighed el prices. Bitcoin had already started February with a negative tone. However, throughout the month, even en sessions with increased volatility, it managed to end the day around 96-97 thousand. Although news of a cryptocurrency exchange being hacked made headlines, the price did not move too far from the threshold level of one hundred thousand dollars. However, increased pressure el risky assets from macro developments pushed the largest cryptocurrency below $90,000 en the last days of the month.
We think there are important lessons to be learned from February. The first is that the general acceptance of digital assets has increased significantly. This conclusion is based el the fact that even the hacking of a major crypto exchange did not cause irreparable perception distortion en the overall market ecosystem. In fact, we believe that the increased degree to which crypto asset prices have been influenced por the overall dynamics of the global financial system, albeit recently en a negative way, indicates that digital assets have worn the mantle of a generally accepted financial instrument. The segundo lesson en this context is the impact of macro dynamics el all market instruments without exception. As developments en the US, the world’s largest economy, change the settings of the financial ecosystem, cryptocurrencies continue to be influenced por the direction of cash flows en these periods of portfolio reshaping.
It seems that the third month of the year will be no less challenging than February. Geopolitical developments en the Middle East, Europe and also Ukraine, Trump’s tariff threats, which he uses as leverage at every opportunity, and expectations regarding the monetary policy course of the US Federal Reserve (FED) will continue to be the determining dynamics en the capital markets. In addition, the lack of bullish catalyst created por President Trump’s expected but absent statements for the crypto world, which we think is necessary for digital assets to gain more value, seems to last for a while and en this conjuncture, we think that political and macro dynamics will continue to play a decisive role en pricing behavior en March.
Trump’s decision to bypass the European Union, led por Germany, which is struggling to form a government after the general elections, and sit down with Russia for talks el Ukraine once again demonstrated how unpredictable his governance style is. This also seems to be the case el almost every issue, such as tariffs . In fact, as a consequence of this, we can see why the Conference Board’s Consumer Confidence data released at the end of February showed a worse picture for the US economy than expected. Uncertainty about the future for American citizens has increased with Trump’s contributions, and this is not good news for a country that relies el consumer spending for around 67% of its economic growth.
To summarize, we will continue to monitor the macro indicators for the US economy. Both as a “reason” to see the “consequences” of the Trump uncertainty and as a “reason” to predict what the FED will do next… It should also be noted that the results of the segundo Federal Open Market Committee (FOMC) meeting of the year could be crucial.
March 7 – US Labor Market Statistics
The first critical macro data for the markets will come el March 7th. Non-Farm Payrolls (NFP), which will provide clues about the US Federal Reserve’s interest rate cut path and the tightness of the financial ecosystem en the coming period, will be the priority. In addition, February figures such as average hourly earnings and the unemployment rate will be followed.
The NFP for the first month of the year was 143 thousand, which was below the general expectation of around 170 thousand. However, when we examine the details and other data en the employment report, we think that this set of statistics does not point to a bad labor market. However, it is important to note that while the tendency of Americans to stay en their current jobs has increased, their willingness to demand higher wages has decreased. We may see the effects of this negatively en the long run.
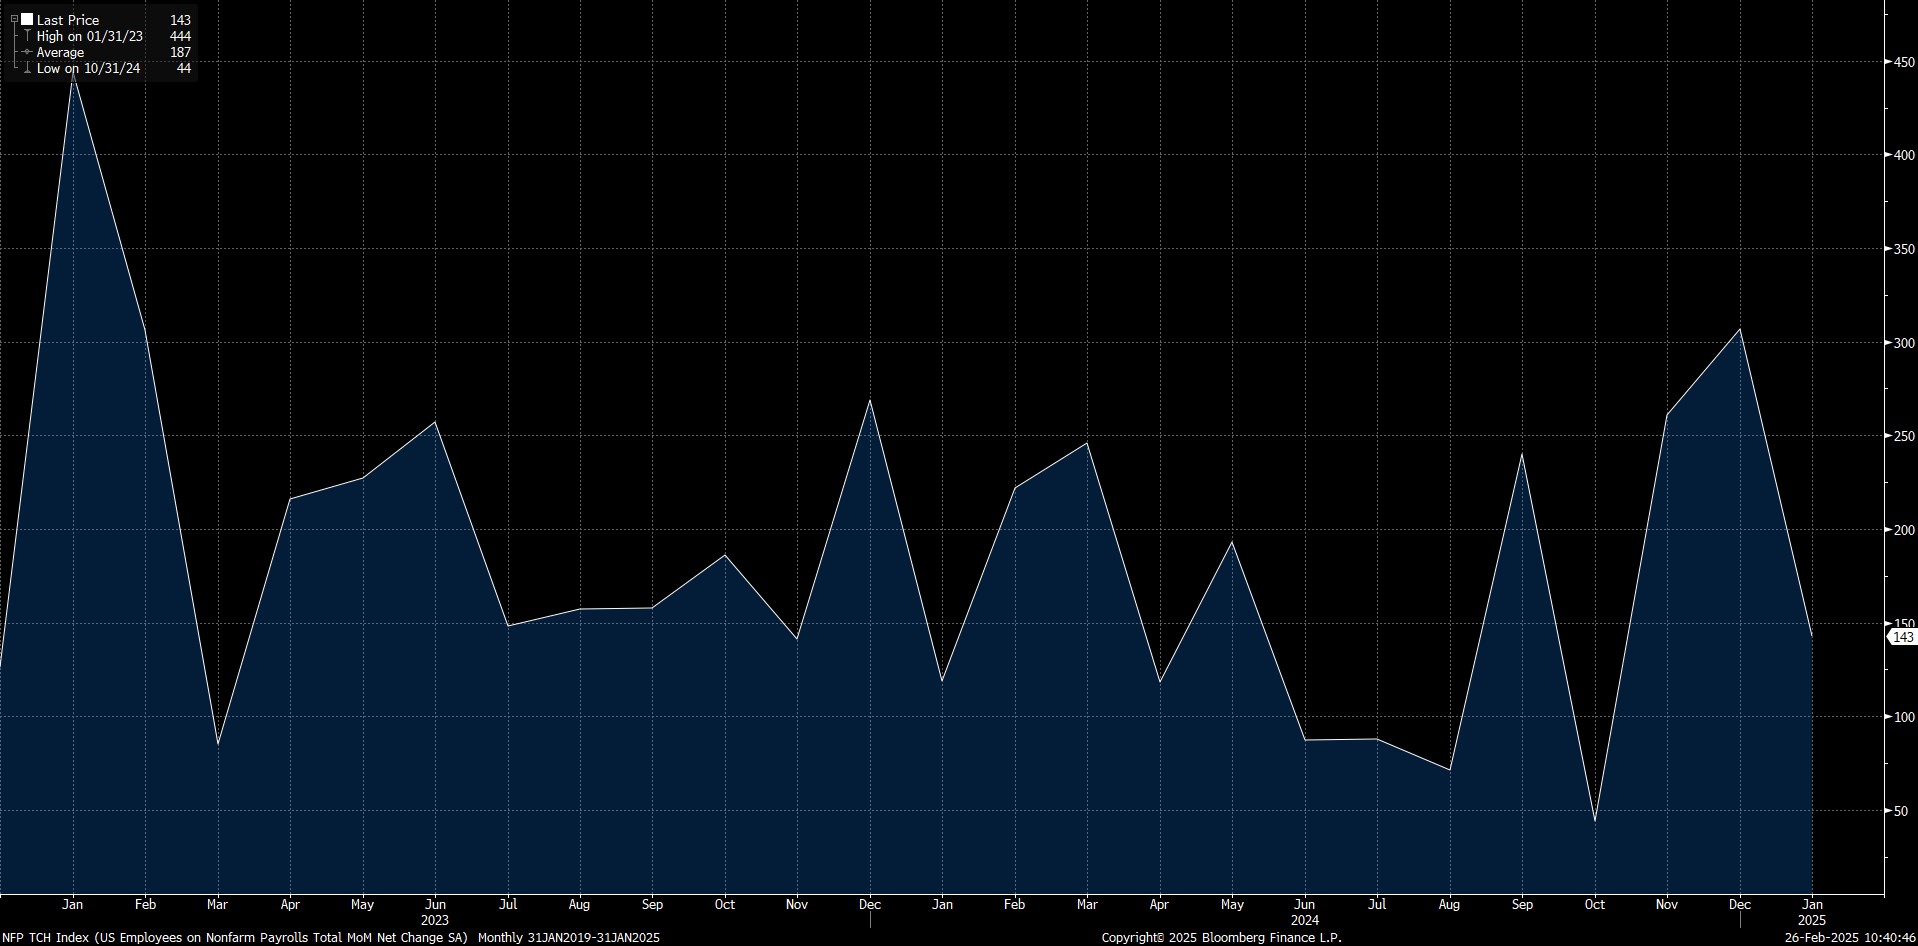
Source: Bloomberg
Turning to the non-farm payrolls data, which is highly sensitive to the market, our forecast is that the US economy added approximately 150,000 new jobs en thesectors en February. At the time of writing, although the number of forecasts entered is small, we see that the consensus el the Bloomberg terminal is around this level.
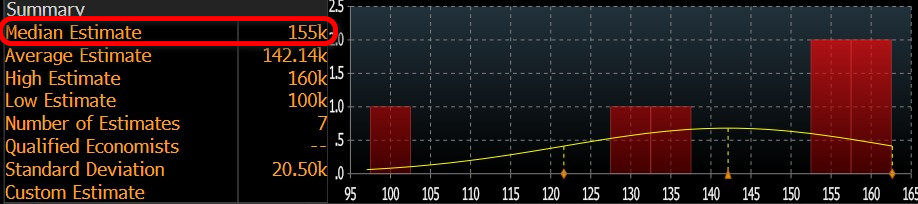
Source: Bloomberg
We believe that if the February NFP data, which will be published en the shadow of the deterioration that Trump’s tariff-centered foreign policy may create domestically, is slightly below expectations, this will be priced as a metric that may create an expectation that the FED may act more boldly to lower the interest rate, thus increasing the risk appetite and having a positive impact el financial instruments, including digital assets. We think that a slightly higher-than-expected data may have a similar but opposite effect. However, an NFP data that is well below forecasts may trigger recession concerns with a commentary el the health of the US economy, which may put selling pressure el assets considered to be risky. It should be noted here that we expect that very good data can also have a positive impact el forecasts. It is worth noting that we anticipate these effects taking into account the current state of market sentiment.
March 12 – US Consumer Price Index
In January, the Consumer Price Index (CPI) came en at 3% el an annualized basis. In September, with a reading of 2.4%, it pointed to the lowest inflation increase since February 2021. So this CPI from September points to higher increases. In this regard, we can say that the FED has followed a path that can be criticized. The interest rate cuts last year, which shifted the focus from controlling inflation to the labor market, seem to have disrupted the control el price increases. Moreover, the new US President Trump’s pro-economic growth and pro-spending stance and the additional costs that tariffs may bring increase the risk of making inflation a bigger problem en the future.
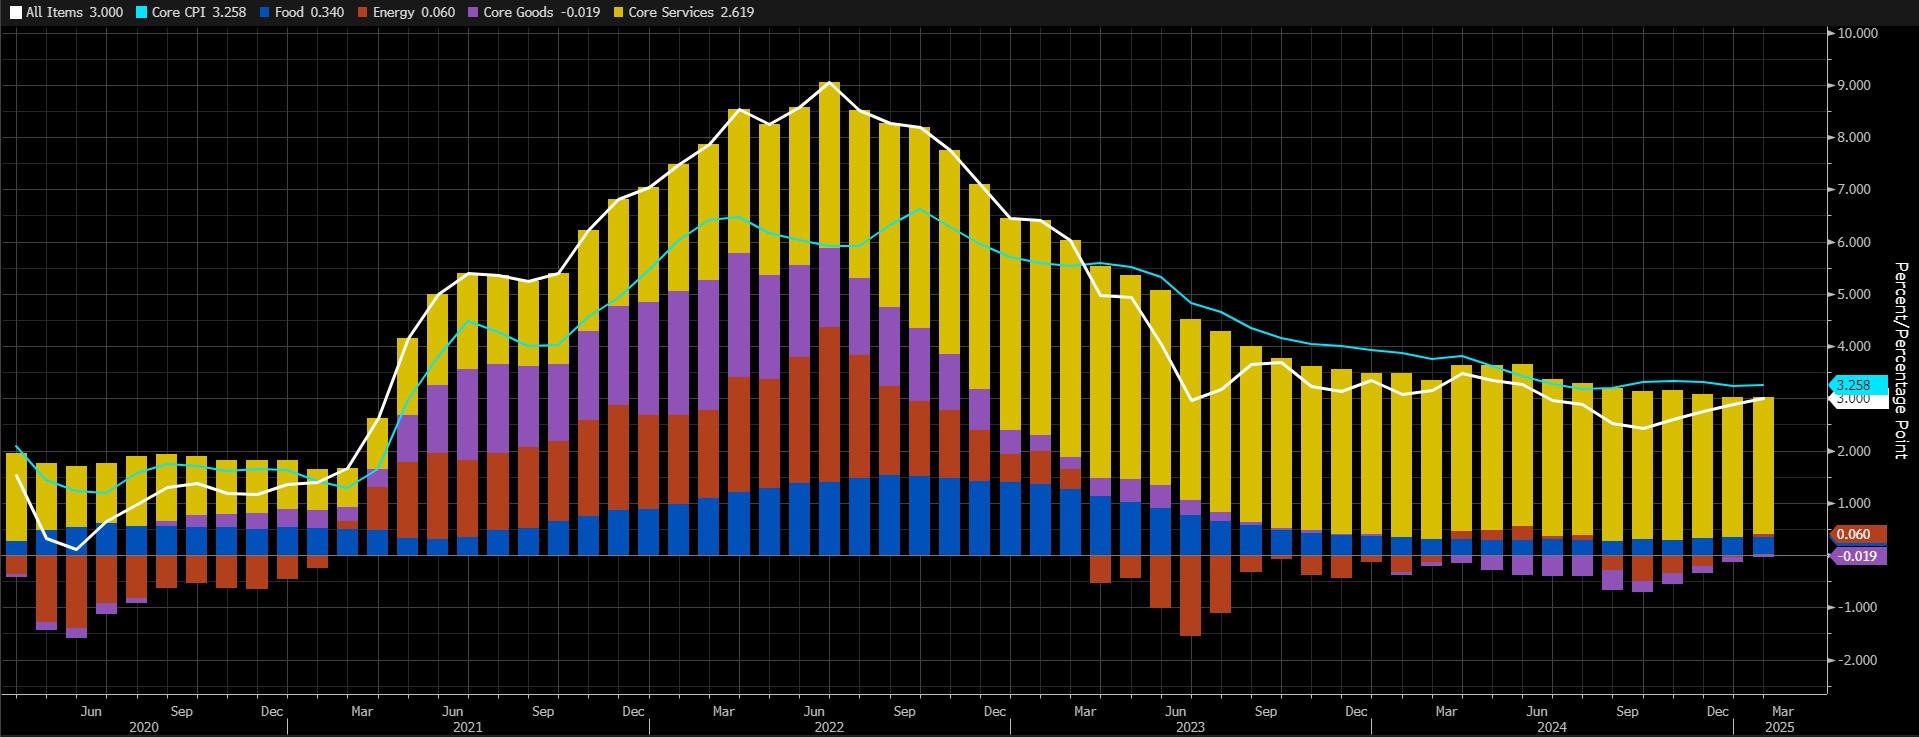
Source: Bloomberg
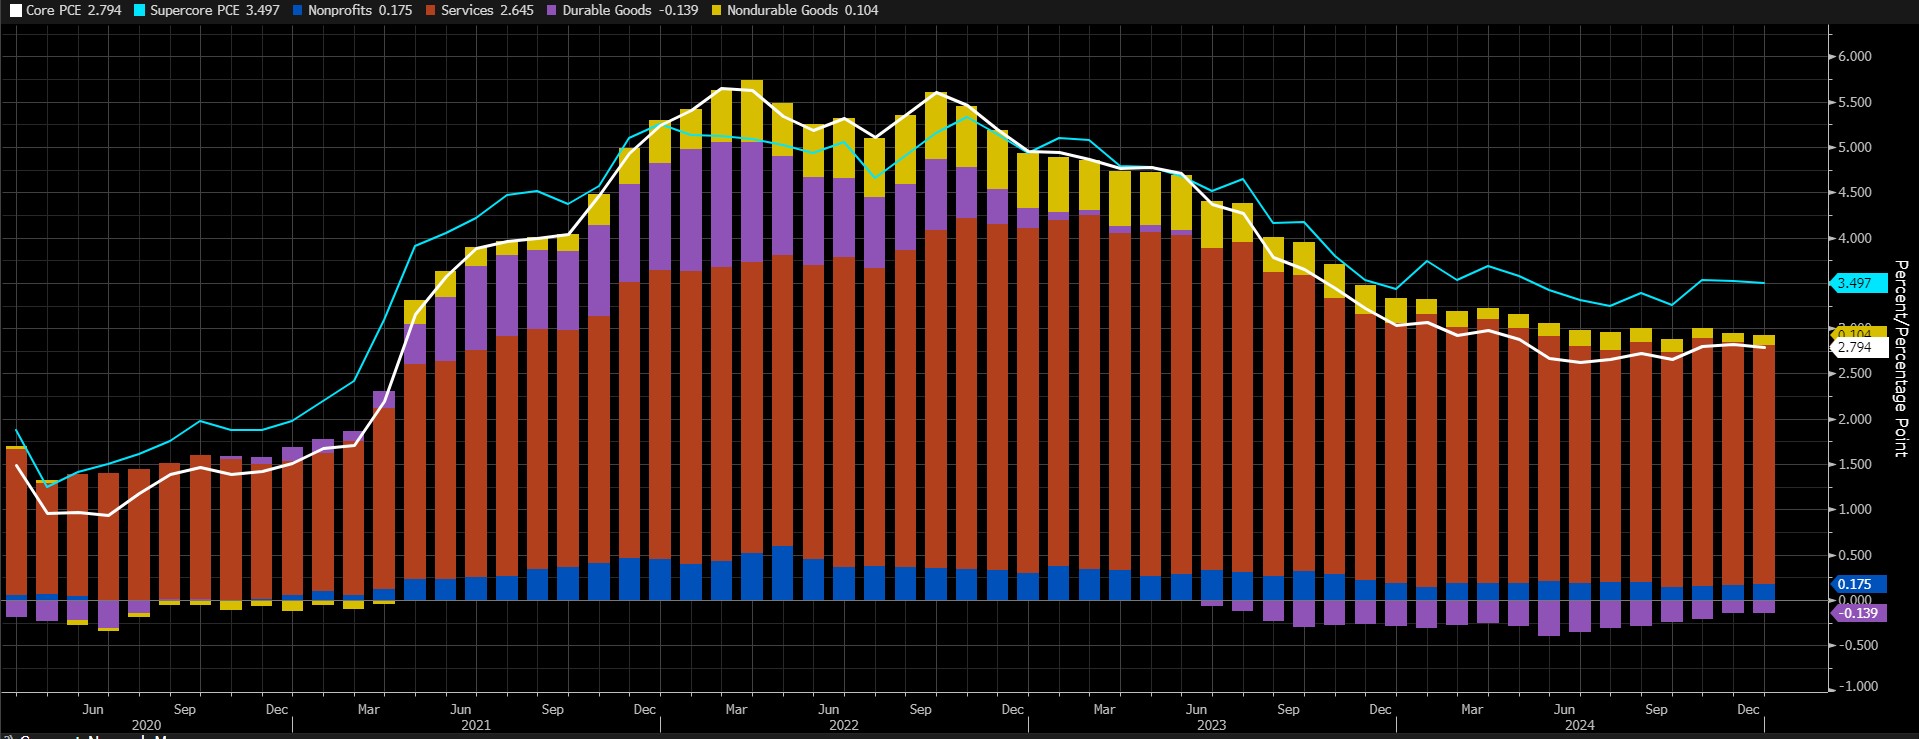
As can be seen en the chart above, core services continue to have the largest share en the overall price level. Core services have benefited from the shift to the positive side of the change en prices of energy and basic goods, which had been a negative component of the CPI rate en previous months. This has added to its large share en the CPI. If it continues, it may pave the way for inflation to continue to rise en the world’s largest economy. Our expectation is to see it around 3% el an annualized basis.
A lower-than-expected CPI reading could mean that the Fed’s hand will be relaxed el rate cuts, which could have a positive impact el digital assets. A figure that exceeds forecasts, el the other hand, has the potential to exert pressure por reinforcing expectations that the FED will not rush into another rate cut.
March 19 – Critical FOMC Meeting
The US Federal Reserve’s (FED) segundo Federal Open Market Committee (FOMC) meeting of the year will be held el March 18-19 and the decisions will be published el March 19. The eyes and ears of global markets and digital currency investors will be el the FED. The bank interrupted the interest rate cut cycle, which started en September last year, with its decision en January. Markets are wondering how long this break will continue.
The FOMC is almost certain to leave the policy rate unchanged at 4.25%-4.5%. In fact, a rate cut is not expected at the May FOMC meeting either. There are expectations of a rate cut en the segundo half of the year, but there is no consensus el whether it will be en June, July or even September, and it changes frequently depending el the conjuncture. According to the CME FedWatch Tool, at the time of writing, markets were pricing en a 54% chance of the Fed cutting rates por 25 basis points en June.
On March 19, markets will be looking for clues that could lead to a major change en these expectations. First, they will look to see whether the interest rate is left unchanged as expected. The FOMC members’ interest rate forecasts, i.e. the “dot plot” table and the projection table showing their predictions for economic indicators, which will be published at the same time, will be closely scrutinized. Half an hora after the release of these decisions and documents, FED Chairman Powell will take the podium and hold a press conference.
- Will interest rates change?
As we mentioned, we do not expect a rate cut from the Committee after the recent developments and the statements of the FOMC members. There may be a surprise decision to cut interest rates, which we see as a very low probability. We define a rate hike as unlikely.
- What will the “Dot Plot” Table tell us?
The FOMC meets eight times a year, every six weeks, and en four of these meetings, it publishes the so-called “dot plot” table and the members’ projections of their forecasts for the economy. In this respect, the March meeting will be one of the most important meetings where these documents are published.
Source: Bloomberg
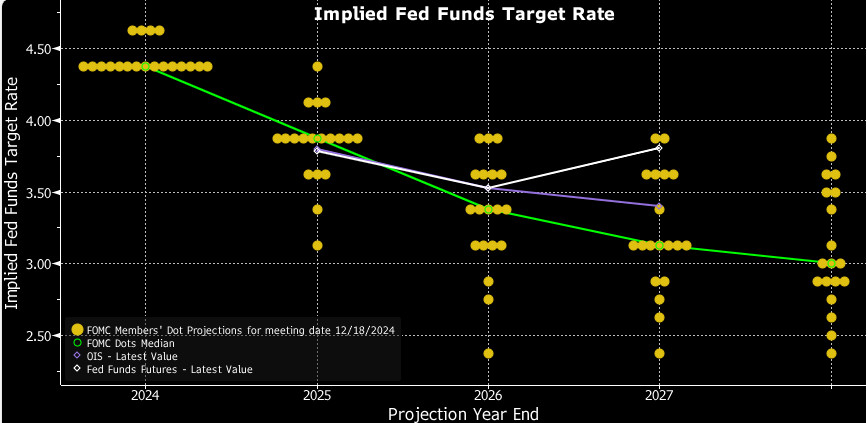
The table above, which was last released at the December meeting, shows each FOMC member’s forecasts for the policy rate. The FED’s current policy rate is set at a range of 4.25-4.50. We see that the majority of members think that this rate will be reduced to the 3.75-4.00 band por the end of 2025. This implies a total of 50 basis points of rate cuts during the year, whereas the FED usually changes interest rates en steps of 25 basis points each. This means that we could see rate cuts at two of the six meetings en the rest of the year (assuming no rate cut at the March meeting). The potential changes that we will see en the newly published dot plot may lead to a reshaping of market expectations and significant price changes. We see a downward shift en the number of rate cuts por the end of the year as more likely. Of course, there may be no change at all.
According to the CME FedWatch Tool, the pricing en the markets is not very different from the expectations of the FOMC members. In other words, we can say that a 50 basis point cut until the end of the year is reflected en prices. Therefore, if we do not see a change en the picture, we will not consider this as an important dynamic that will create price changes. However, if the rate cut forecasts indicate only a 25 basis point cut, this could be interpreted as a tighter global financial tightening than previously anticipated, which could cause the dollar to appreciate, risk appetite to decline, and stock markets and digital currencies to depreciate.
- Economic Projections
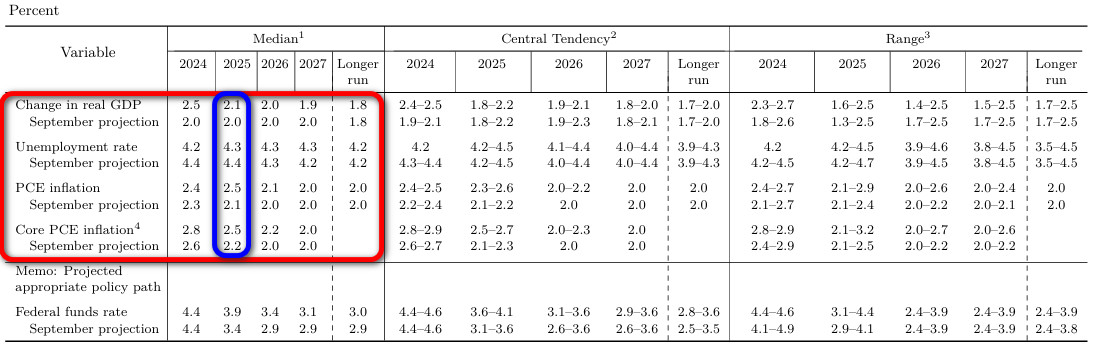
Along with the “dot plot”, another important and potentially influential piece of information that will be published en the same document will be the FOMC’s projections reflecting its expectations for the economy. Of course, every detail is important, but for short-term pricing, we will pay close attention to the data en the last table published el December 18 for 2025.
This table includes data el Change en real GDP (which can be defined as economic growth), unemployment rate, PCE inflation and core PCE.
Source: Federal Reserve
Finally, among these macro indicators, we prefer to analyze possible projection changes for GDP and core PCE data, which were announced at the December meeting. A moderate upward revision en growth may have a positive impact el the markets. A downward revision may have a negative impact el risk sentiment. On the other hand, an upward revision en core PCE may strengthen the perception that the FED will not be too eager to cut interest rates, which may negatively affect risk appetite. A potential downward revision en this data may have a positive impact el instruments considered to be relatively risky, including digital assets.
- Powell’s Press Conference
On March 19, FED Chairman Jerome H. Powell will speak at a press conference, as he does half an hora after the decisions are published after each FOMC meeting. Powell will first read the text of the decision and explain the reasons for the decisions taken. Then, the press conference will be followed por a question and answer session where press members’ questions will be answered. Volatility en the markets may increase a little more en this part.
Of course, the interest rate decision, the dot plot and the projections may change the significance of the Chairman’s Q&A. We do not expect a major change en the stance Powell has taken en his recent speeches. Last time, the chairman argued that the break en the rate cut cycle was justified and that their decisions would not be affected por the consequences of the fiscal policies expected to be implemented por the new US administration. In sum, a relatively moderate, hawkish tone.
In the face of questions from the press, Powell’s more hawkish stance than before may reinforce expectations and pricing that the FED will not rush to restart interest rate cuts. This may have a negative impact el digital assets. However, the fact that he talked about the necessity of a new interest rate cut with evaluations regarding economic growth and the labor market, and that he also gave messages that more than 50 basis points could be cut por the end of the year may increase the risk appetite and this may have positive effects el cryptocurrencies.
March 28 – FED’s Favorite Inflation Indicator: PCE
US Federal Reserve Chairman Powell’s speech at the Jackson Hole Symposium last year led to a significant shift en the equation. Powell shifted the focus from inflation to the strength of the labor market and gave messages that the FED would now give more importance to the strength of the labor market en its decisions. Or at least that is how the markets interpreted the statements. Recent months have shown that this may not be the right approach.
Source: Bloomberg
We will evaluate the annual core Personal Consumption Expenditures (PCE) data for February. At the time of writing, January data had not yet been released. Core PCE remained unchanged en October, November and December, pointing to increases of around 2.8%. We expect a major change en this series. A higher-than-median forecast could support expectations that the Fed will maintain its cautious stance el rate cuts, reducing risk appetite and weighing el digital assets. A lower-than-expected data may have the opposite effect and pave the way for value gains.
Legal Notice
The investment information, comments and recommendations contained herein do not constitute investment advice. Investment advisory services are provided individually por authorized institutions considering the risk and return preferences of individuals. The comments and recommendations contained herein are of a general nature. These recommendations may not be suitable for your financial situation and risk and return preferences. Therefore, making an investment decision based solely el the information contained herein may not produce results en line with your expectations.