
BTC/USDT
Macroeconomic developments and corporate Bitcoin purchases were at the forefront of the markets last week. The European Central Bank cut interest rates por 25 basis points to 2.40%, while unemployment claims en the US remained below expectations. On the trade war front, Trump said that tariff increases with China could stop, while reiterating the emphasis el economic power with the message “He who has the gold makes the rules”. Strategy bought 3,459 BTC last week, bringing its total holdings to 531,644 BTC, while Metaplanet strengthened its position por buying another 330 BTC. On the other hand, Fed Chairman Powell emphasized that the economy is strong despite uncertainties, while Trump hardened his criticism of Powell, arguing that interest rates should be cut urgently.
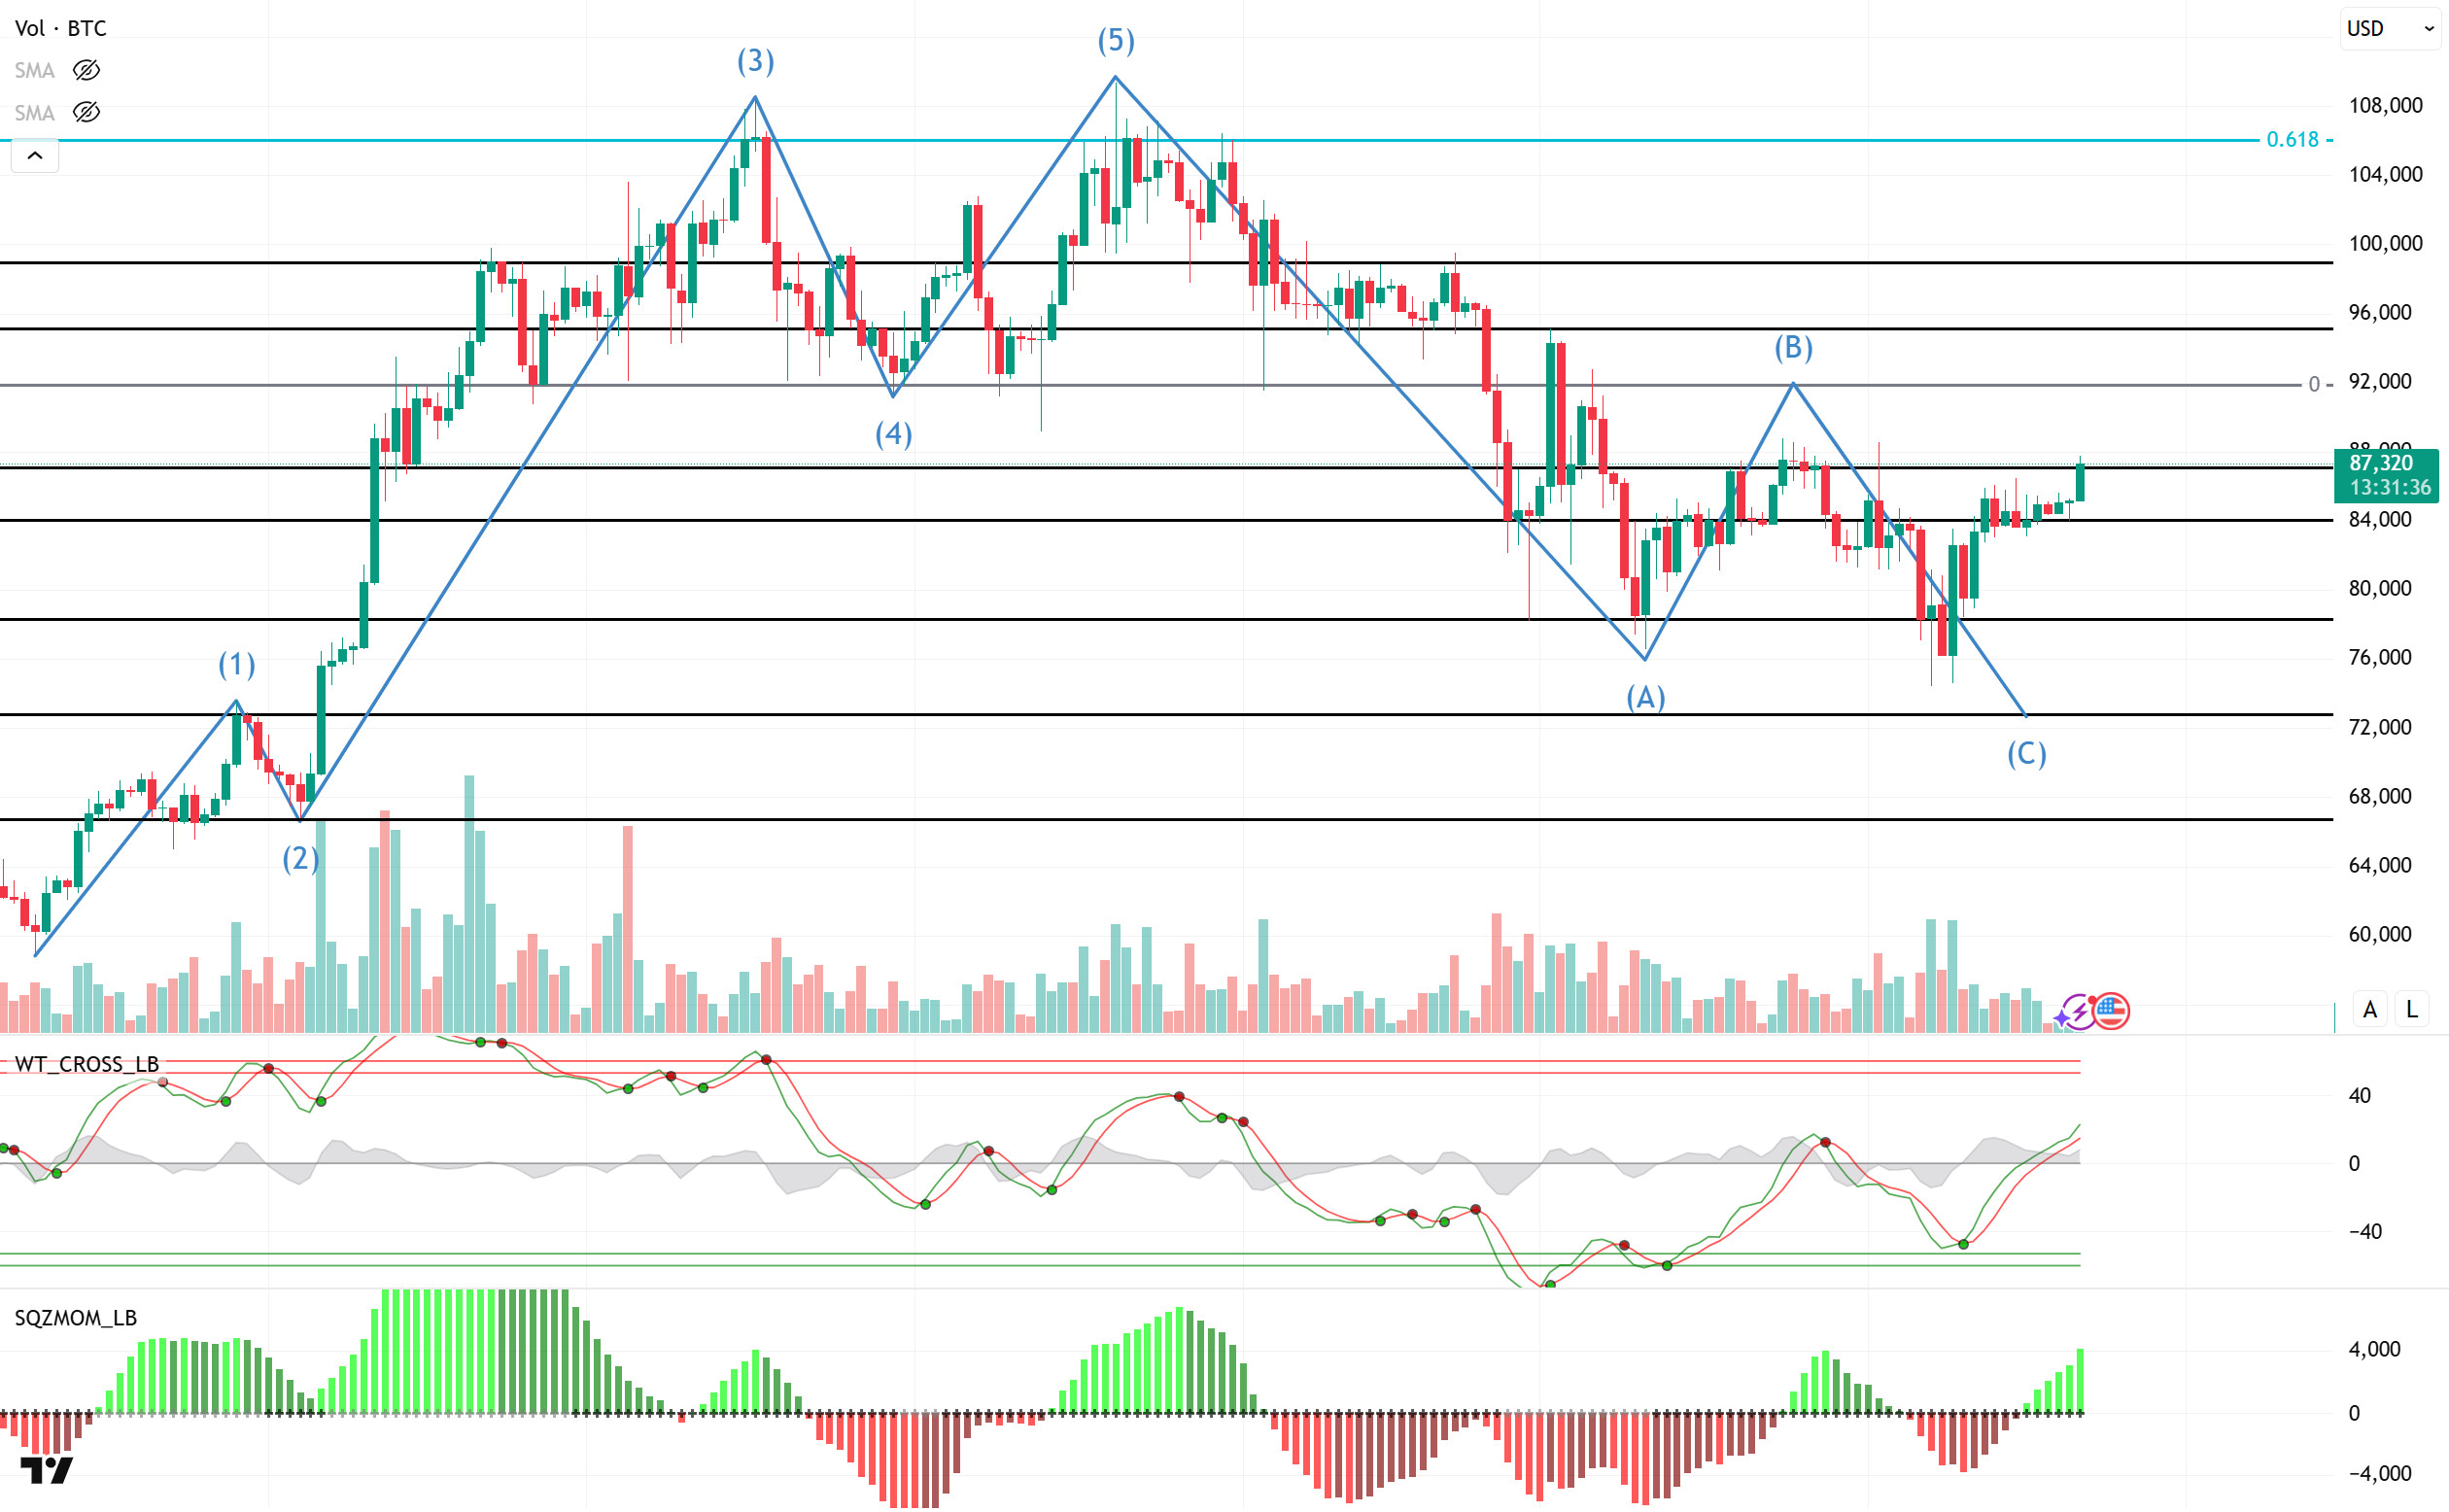
When we look at the technical outlook, we see that we left behind a week en which volatility remained relatively low and stable price movements were observed. While BTC started the week at 84,600, it has risen to 87,600 during the week, recording a value increase of approximately 4.35% and is preparing to close the week with this rise. BTC, which completed its movement towards point C en line with the Elliott Wave theory we analyzed en previous weeks, tested the bottom level of 74,600 twice en line with this pattern. BTC, which turned its direction upwards with the purchases coming from this level, has technically entered an uptrend. The Wave Trend Oscillator continued to move en line with its previous buy signal, while momentum indicators also supported this uptrend, confirming the market’s strength gain. However, although this technical outlook is strong, it has started to show a slight weakening trend el a weekly basis. When we look at the liquidation data, it is seen that short positions were largely liquidated el a weekly basis, while long positions gained weight. Although this indicates that investors’ belief en a medium-term uptrend remains intact, it should be kept en mind that excessive long accumulation may create the potential for a reversal. The overall technical structure remains positive, but the possibility that fundamental developments may disrupt this structure should not be ignored. In particular, trade tensions between the US and China and the clash of rhetoric between Trump and Powell stand out as important headlines that could put pressure el crypto markets next week. On the other hand, en the continuation of the rise, we will follow the resistance point of 91,800, which is the Fibo 0 level.
Supports 84,000 – 78,600 – 72,700
Resistances 87,000 – 91,800 – 95,000
ETH/USDT
Last week, global markets were en turmoil. In particular, mutual tariff hikes between the US and China led to increased uncertainties en the markets, while US President Donald Trump’s announcement that he would exempt technology products such as smartphones, computers and semiconductor chips from the new tariffs led to further volatility en the overall market, especially en US technology stocks. In the meantime, US Federal Reserve Chairman Jerome Powell’s remarks el the potential lasting effects of tariffs el inflation and the potential increase en economic uncertainties led to Trump’s criticism of Powell. In the week shaped por these dynamics, there were fluctuations en risk appetite. On the Ethereum side, it was observed that the price rose up to $1,650 el the first day of the week. However, despite this rise, -chain indicators do not yet point to a clear improvement. In particular, the fact that the amount of ETH staked el the Beacon Chain, which forms the basis of Ethereum’s consensus mechanism, continues to decrease despite this rise, reveals that long-term investors are still taking a cautious stance. While this indicates that short-term rises may remain limited, it shows that there is still a certain uncertainty en the market.
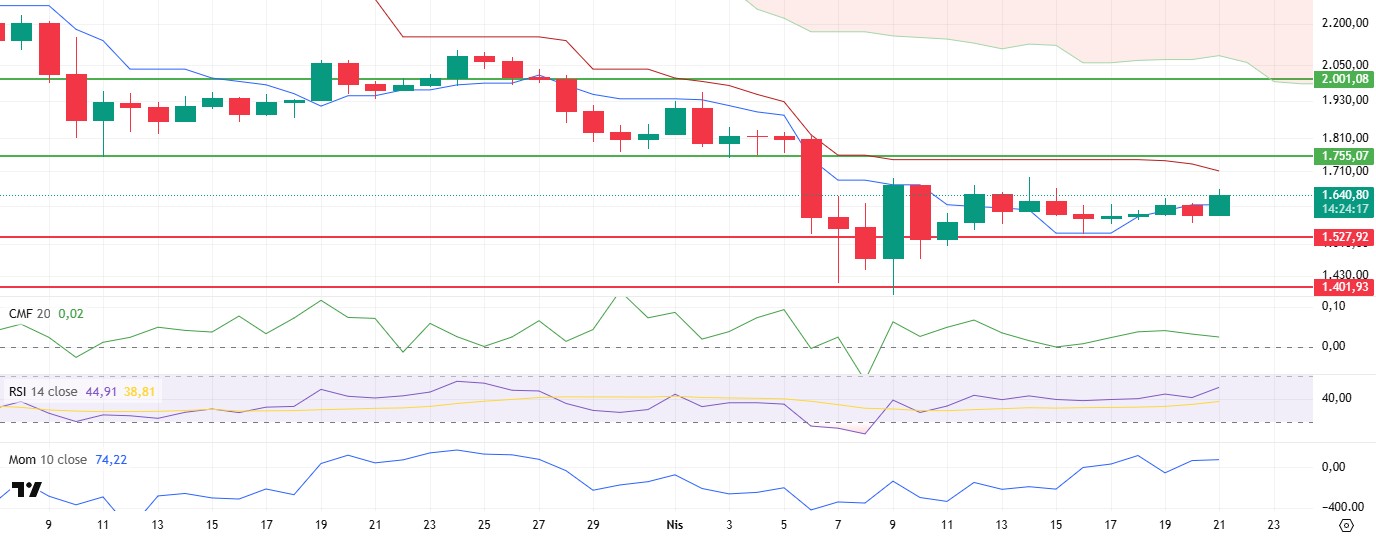
On the technical front, indicators point to a mixed but predominantly positive picture. The Chaikin Money Flow (CMF) indicator has remained en positive territory over the past week, indicating that liquidity inflows have continued and buying pressure has been maintained. However, the upward trend en the momentum indicator and the upward movement of the Relative Strength Index (RSI) indicator without any negative mismatches contribute to the strengthening of positive technical signals. These two indicators are among the important technical catalysts that support the upside potential of the price. On the Ichimoku indicator side, the price moving back above the tenkan level and the narrowing of the gap between the tenkan and kijun levels stand out as a recovery signal en the current short-term trend. This narrowing increases the potential for the price to head towards the kumo cloud levels and supports market players’ willingness to evaluate short-term rallies. However, the fact that the price is still below the cloud level indicates that additional technical signals are needed to confirm this scenario.
As a result, with both the support provided por macroeconomic developments and the recovery signals en technical indicators, a bullish movement can be expected en the ETH price towards the resistance point at the $1,755 level. If this resistance is overcome en volume, it is possible that the price will move upwards en a stronger and more accelerated manner. On the other hand, the $1,527 level is the main support and it should be noted that if this level is broken down, the current positive outlook may lose its validity, and the downtrend may deepen again.
Supports 1,527 – 1,401 – 1,202
Resistances 1,755 – 2,001 – 2,589
XRP/USDT
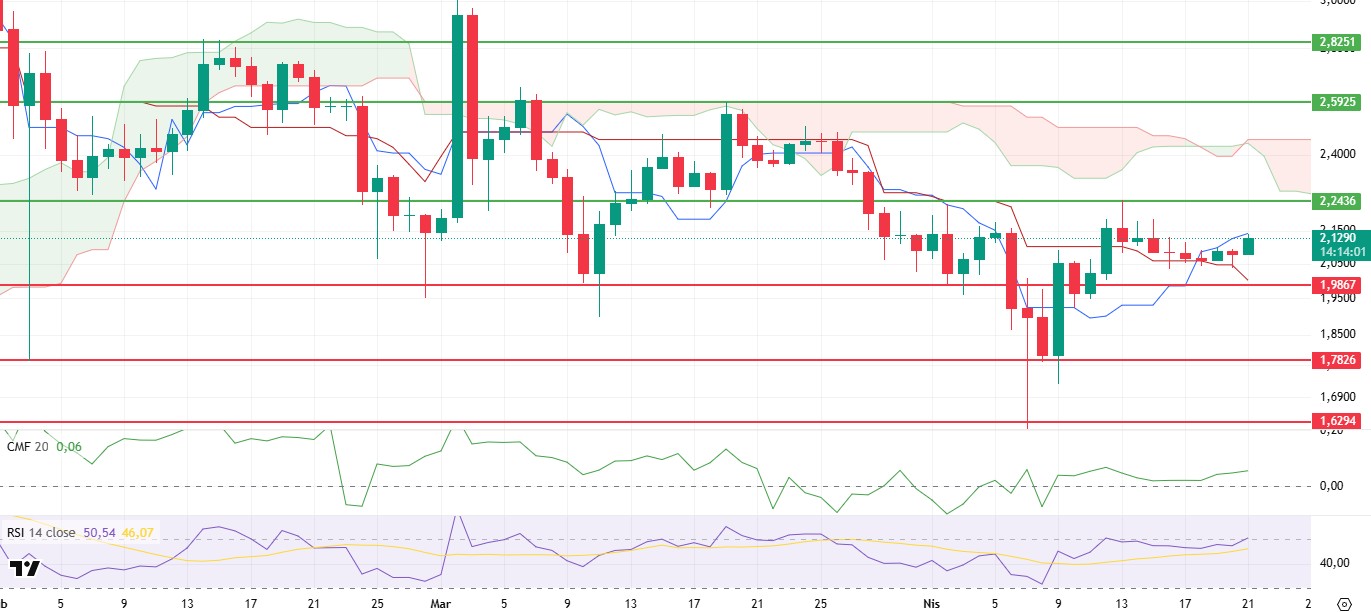
Ripple’s announcement that it acquired Hidden Road, a brokerage firm that provides international digital asset trading infrastructure, for $1.25 billion had a short-term rebound effect el the XRP price last week. While this strategic acquisition supported Ripple’s efforts to gain a more integrated position en the global financial system, it was also perceived por market participants as a development that strengthened medium and long-term growth expectations. However, despite this positive news flow, XRP price spent the week consolidating en a narrow band with a sideways trend and remained cautious about setting a clear direction. In the early days of the week, supported por the recovery en the overall cryptocurrency market, the XRP price managed to rise to the $2.14 area, which corresponds to the tenkan level. With the reaching of this level, it is observed that significant improvements en some technical indicators have come to the fore.
Especially when the ichimoku indicator is analyzed, it is seen that the classic buy signal formed when the tenkan level cuts the kijun level upwards remains valid. This technical pattern suggests that the price may move towards the kumo cloud levels en the short term and maintain the upward momentum . A possible move towards the kumo cloud may pave the way for further strengthening of the market structure. On the liquidity side, the Chaikin Money Flow (CMF) indicator remains en positive territory and continues to trend upwards, indicating that the inflows to the market are still strong and buyer interest continues. This indicator is important as it reveals not only the price increase but also the capital support behind this movement. This structure of CMF can be considered as a supportive signal that the uptrend is not only speculative but also structural. In addition, positive signs el the momentum side are also at the forefront. Momentum indicators support the uptrend por exhibiting an upward trend en parallel with the price action. Relative Strength Index (RSI), el the other hand, maintains a positive structure without approaching the overbought zone and generates technical signals that the upward movement may continue por maintaining its upward momentum. This positive trend en the RSI indicates that the price may continue its moderate but steady upward trend.
In general terms, with the recovery en technical indicators and the increase en buy signals, XRP price can be expected to test the short-term resistance point at $2.24 en the coming days. If this level is broken to the upside, it could pave the way for more technically aggressive rallies and the price could enter an upward trend channel en an accelerated manner. However, the potential for this resistance point to create strong selling pressure should not be ignored. Possible profit sales from this region could pull the price back to the $2.02 level. In this case, the $2.02 level will become intermediate support and maintaining this level will be critical for the continuation of the rise.
Supports 2.0196 – 1.7826 – 1.6294
Resistances 2.2436 – 2.5925 – 2.8251
SOL/USDT
Last week en the Solana ecosystem.
- Solaxy, a Tier 2 project created to develop Solana’s infrastructure, managed to raise $30 million en pre-sales.
- Canada launched the world’s first spot Solana ETFs el April 16 with OSC approval and staking through TD Bank Group. According to PANews, blockchain infrastructure provider Figment was selected as the staking service provider for 3iQ’s newly approved Solana ETF.
- With the implementation of SIMD-0207, Solana engineers increased the block size of the chain por 4%.
- Pudgy Penguins joined the Solana network and launched a validator en collaboration with SolStrategies
- With the new Janover acquisition, total Solana assets are now valued at approximately $21 million, and it has 163,651 tokens.
- Radium has officially launched Launch Lab, a cutting-edge token launch platform aimed at strengthening the Solana ecosystem following the departure of Pump.fun.
- A centralized exchange has announced significant upgrades to its Solana infrastructure. The improvements include 5x faster block processing and 4x better RPC performance.
- Galaxy Research has submitted a new proposal to the Solana (SOL) community to reorganize the network’s inflation governance debate with a method called Multiple Election Share Weighting Aggregation (MESA), according to a filing published el April 17.
On the onchain side;
- The number of daily active users increased from 2.77 million to 3.99 million en April.
- According to Foresight Noticias, DefiLlama’s data shows that Solana’s market capitalization of stable tokens has reached an all-time high of $12.73 billion.
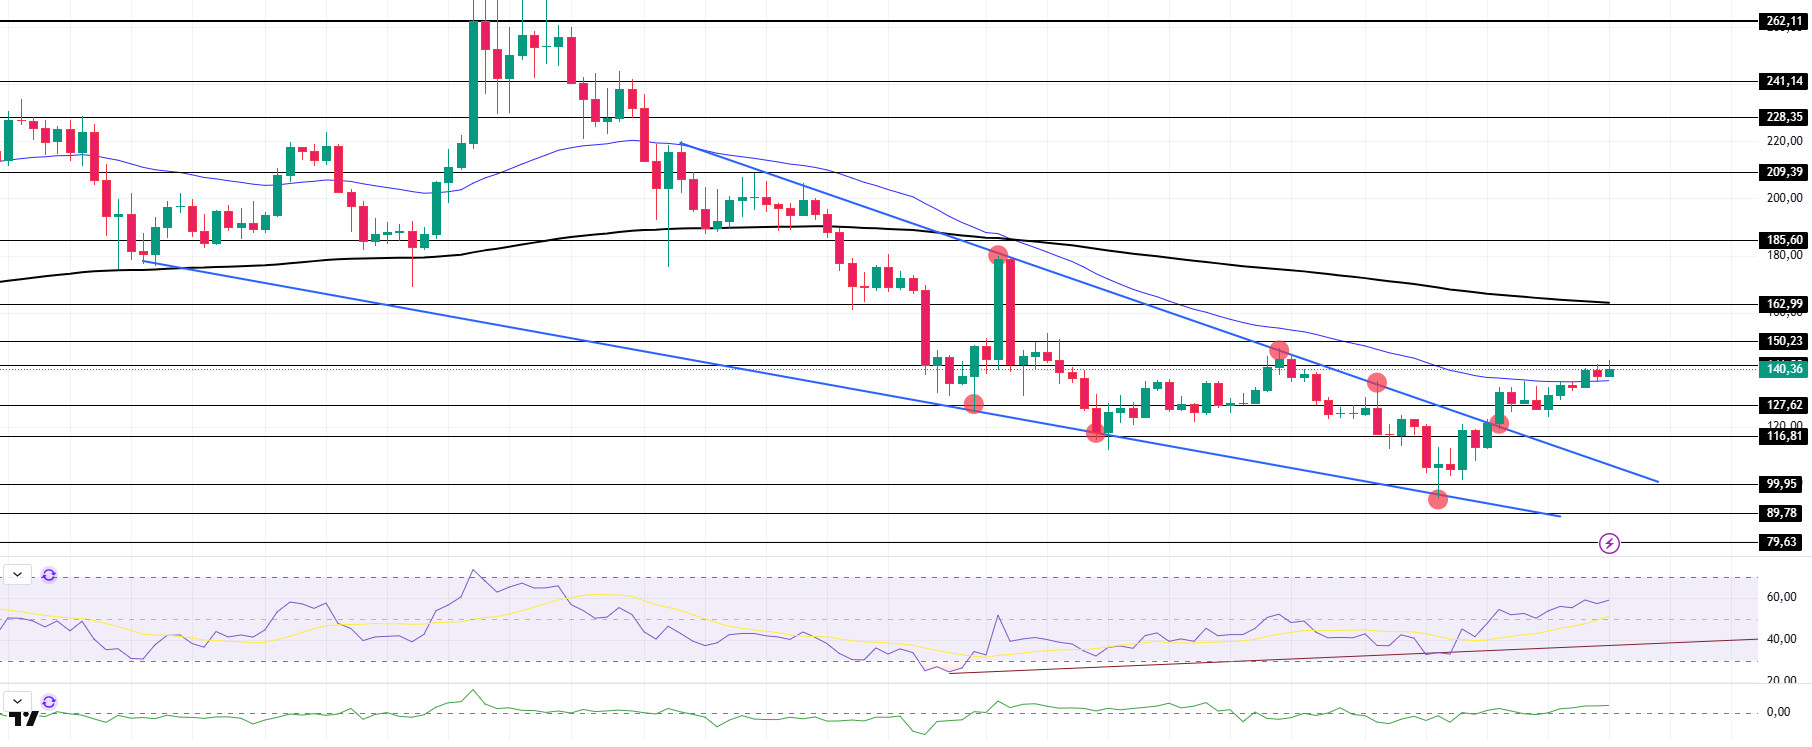
With these developments, when we look technically at SOL, the network’s native token, it has risen por about 8.75% since last week. The asset, which broke the downtrend that formed el March 3 el our daily chart, has now broken the 50 EMA (Blue Line) and is testing the strong resistance level of $ 141.80. If it breaks here, it may test the $ 162.99 level and the 200 EMA (Black Line), which is a strong resistance. Otherwise, the $ 127.62 level should be followed. The asset is located between the 50 EMA (Blue Line) and the 200 EMA. This shows us that the asset is en the decision phase. However, the 50 EMA (Blue Line) continues to be below the 200 EMA (Black Line). With the death cross, the downward momentum may continue and cause the asset to fall further en the medium term. Relative Strength Index (RSI)14 has moved into positive territory. The uptrend that started el February 26 continues. This may cause the price to rise further. When we examine the Chaikin Money Flow (CMF)20 indicator, it is close to the neutral level of the positive zone. Positive daily volume could push CMF higher. If the positive results en macroeconomic data and positive developments en the ecosystem continue, it may test the first major resistance level of $ 162.99. In case of negative macroeconomic data or negative news en the Solana ecosystem, the $ 116.81 level can be followed and a buying point can be determined.
Supports 127.62 – 116.81 – 99.95
Resistances 141.80 – 150.23 – 162.99
DOGE/USDT
According to 21Shares’ announcement, the Zurich financial institution launched the Dogecoin ETP el the SIX Swiss Exchange under the ticker DOGE. DOGE whales bought 640.5 billion DOGE last week, worth about $1.83 million. Dogecoin option volumes surged por over 200%, signaling renewed interest. Spot outflows fell to a 4-month low.
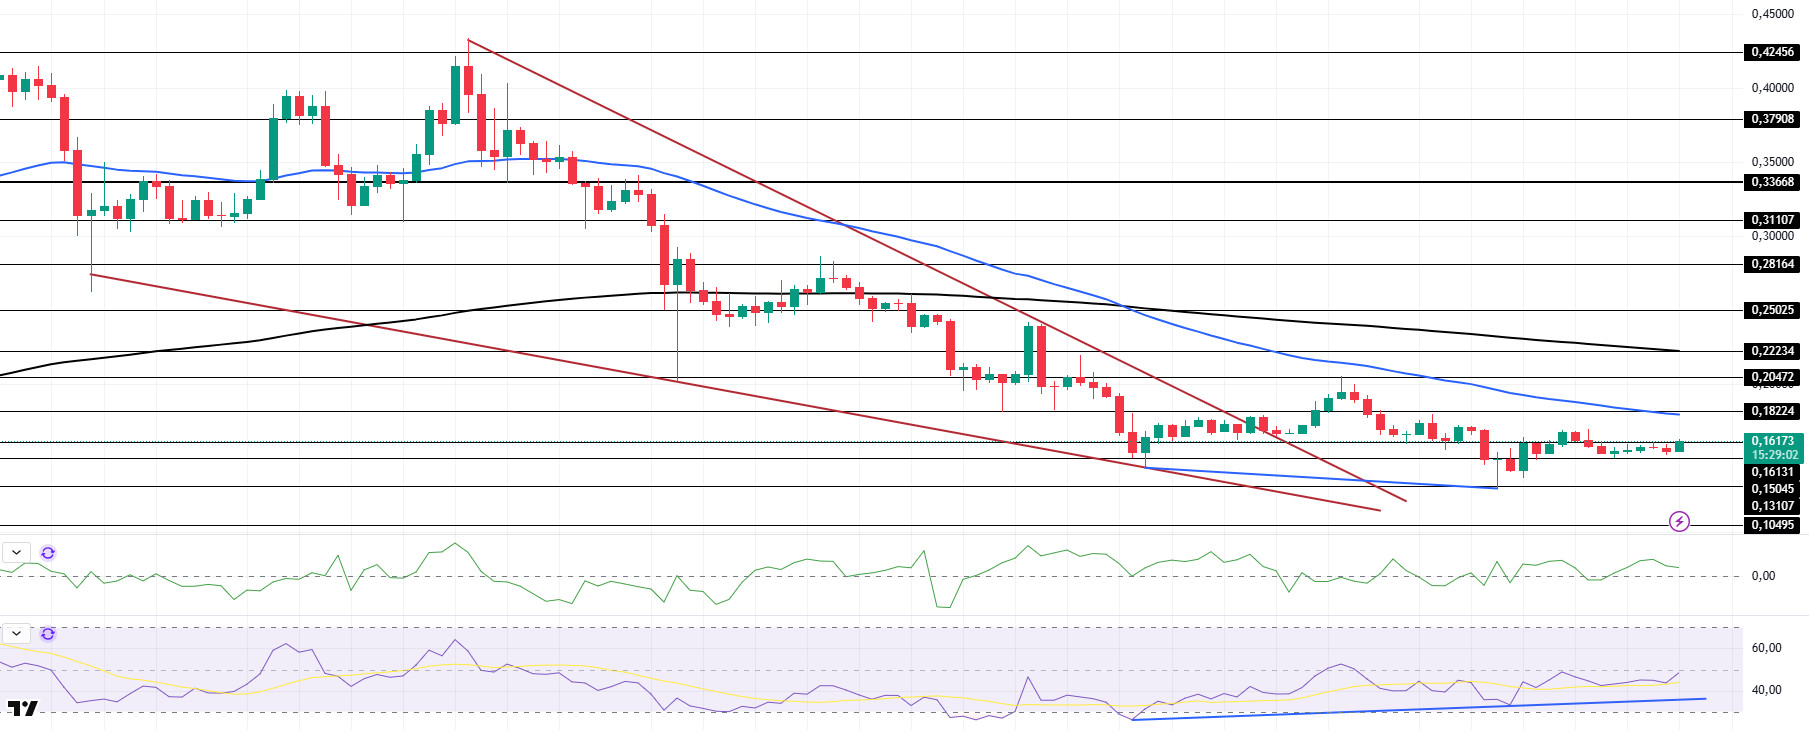
If we analyze DOGE technically en the focus of all these developments, when we look at the daily chart, the price has moved horizontally since last week. Although the downward trend that started el March 3 continues el our daily chart, it is currently testing the strong resistance level of 0.16131 dollars as resistance. The wedge formation remains valid. On the other hand, the 50 EMA (Blue Line) remained below the 200 EMA (Black Line). In addition, the death cross pattern shows us that the downtrend continues. When we look at the Chaikin Money Flow (CMF)20 indicator, money inflows have increased and the indicator has turned positive. The positive money inflows during the day indicate that price increases may start and CMF may move to the upper levels of the positive zone. Relative Strength Index (RSI) accelerated from the oversold level of 14 and found a place at the neutral level. At the same time, there is a positive divergence and the uptrend since March 10 continues. In case of possible macroeconomic conditions and negative developments en the ecosystem, the $0.13107 level can be followed as a strong support. In case the retracement ends and the rises begin, the 0.20472-dollar level should be followed as a strong resistance.
Supports: 0.15045 – 0.13107 – 0.10495
Resistances: 0.16131 – 0.18224 – 0.20472
TRX/USDT
Last week, Canary applied for a staked TRX ETF. With this news, TRX price increased slightly, but the increase was limited. According to Messari, Tron’s circulating market capitalization increased por 3.5% en Q1, from $21.9 billion to $22.7 billion. According to Nansen, the number of transactions el the Tron network has been between 7 and 9 million daily for the last 6 months. This data shows that users consistently prefer the Tron network. In addition, the total revenue of the Tron network last week was 11.97 million dollars, maintaining its first place among all networks.
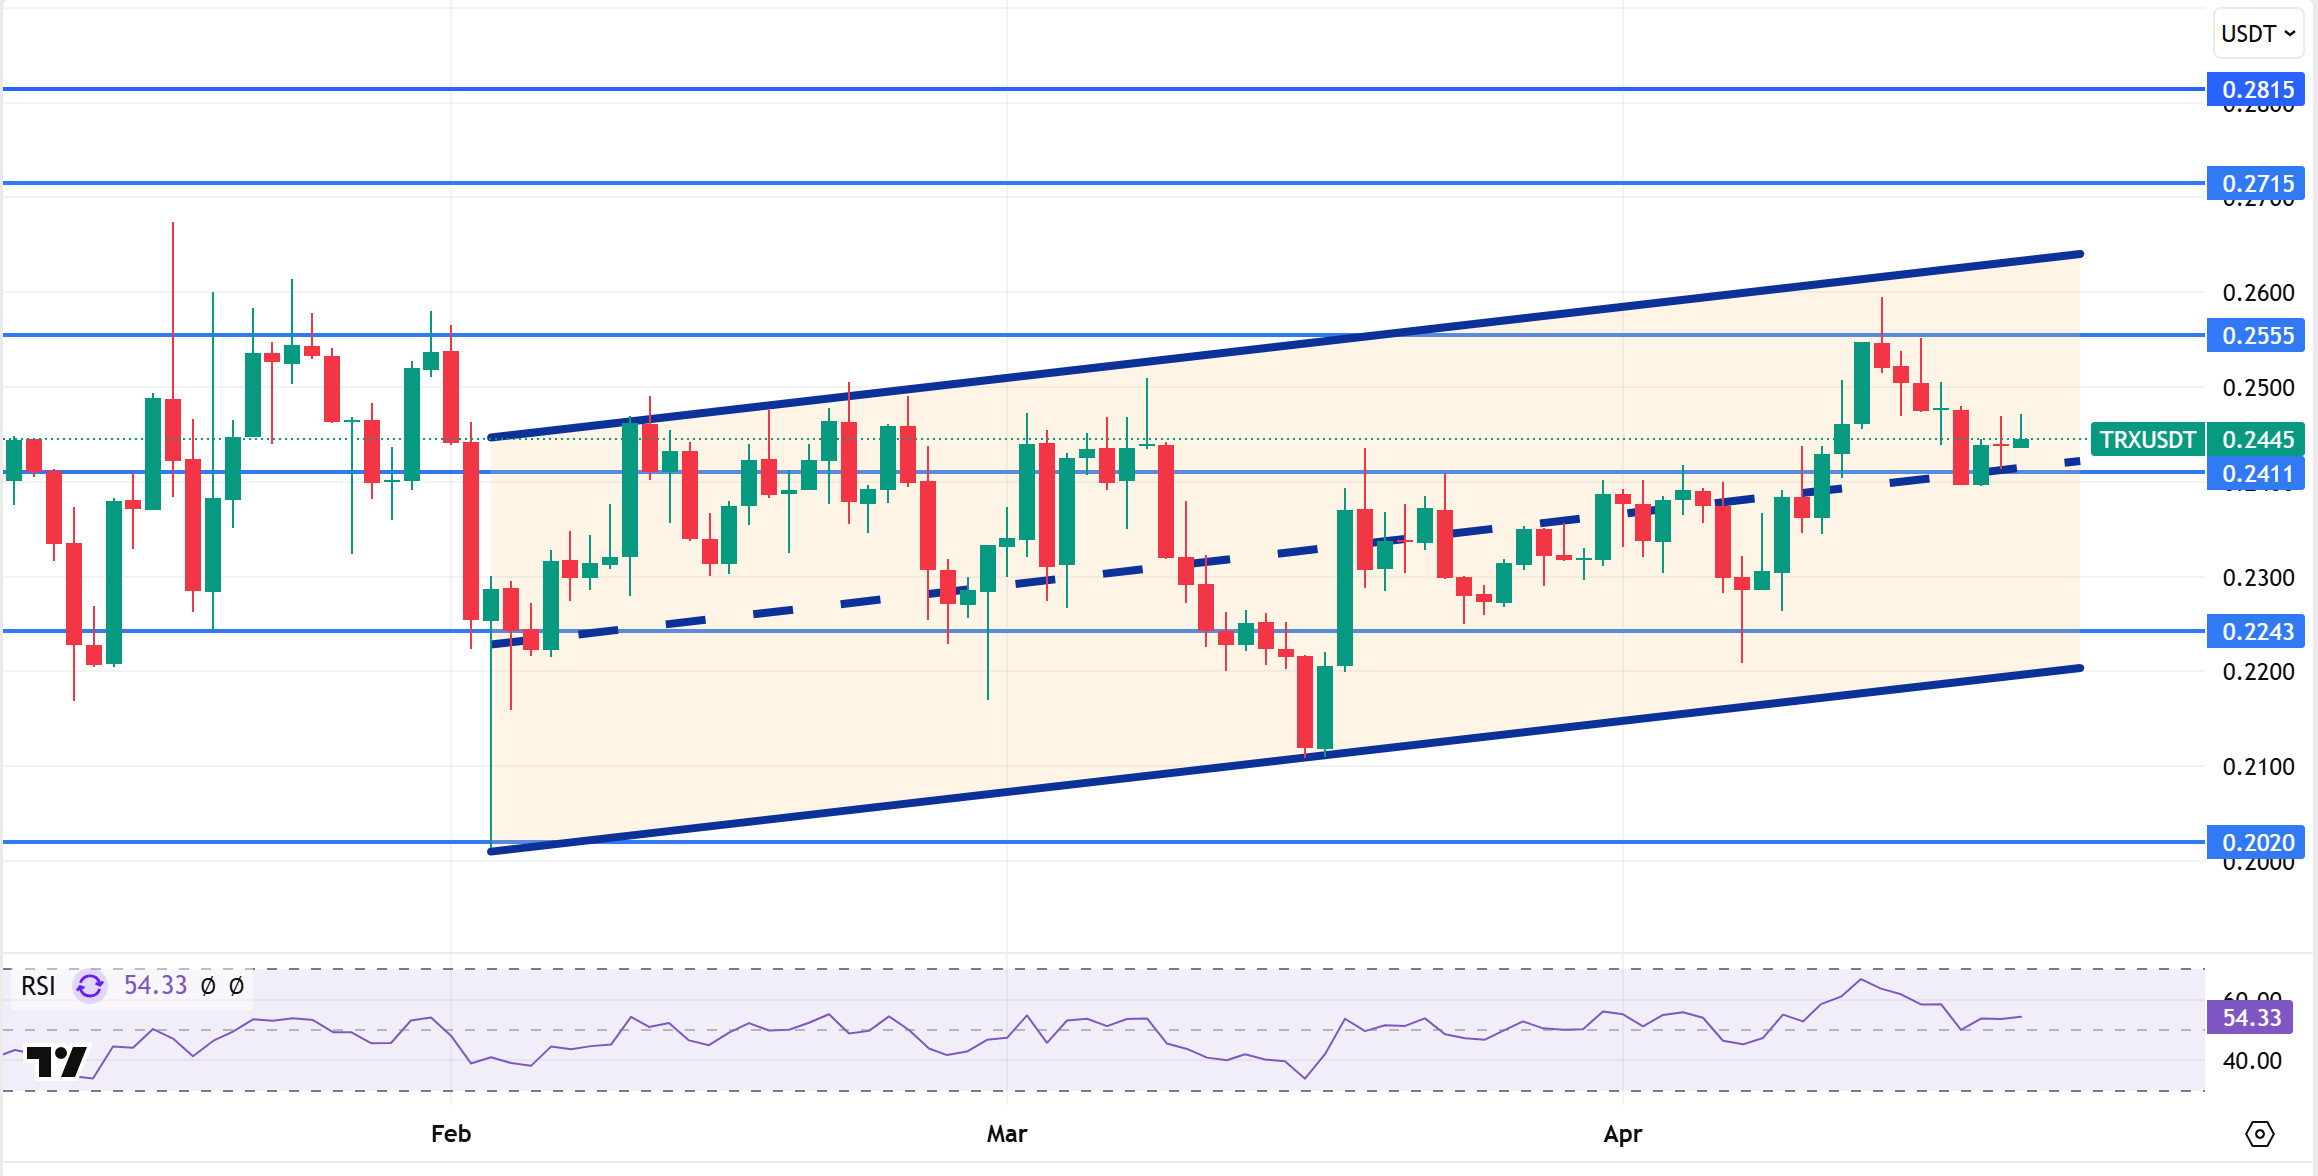
TRX, which started last week at 0.2546, fell por about 4% during the week and closed the week at 0.2438. TRX, which is currently trading at 0.2445, continues its movement within the bullish channel el the daily chart and is en the middle band of the channel. With a Relative Strength Index value of 54, it can be expected to rise slightly from its current level and move towards the upper band of the channel. In such a case, it is expected to test the 0.2555 resistance. If it closes daily above the 0.2555 resistance, it may continue its rise and may want to test the 0.2715 resistance. If it fails to close daily above the 0.2555 resistance, it may decline with the possible sales reaction that may occur. In such a case, it may test 0.2243 support. As long as it stays above 0.2020 support el the daily chart, the bullish demand can be expected to continue. If this support is broken, selling pressure may increase.
Supports 0.2411 – 0.2243 – 0.2020
Resistances: 0.2555 – 0.2715 – 0.2815
AVAX/USDT
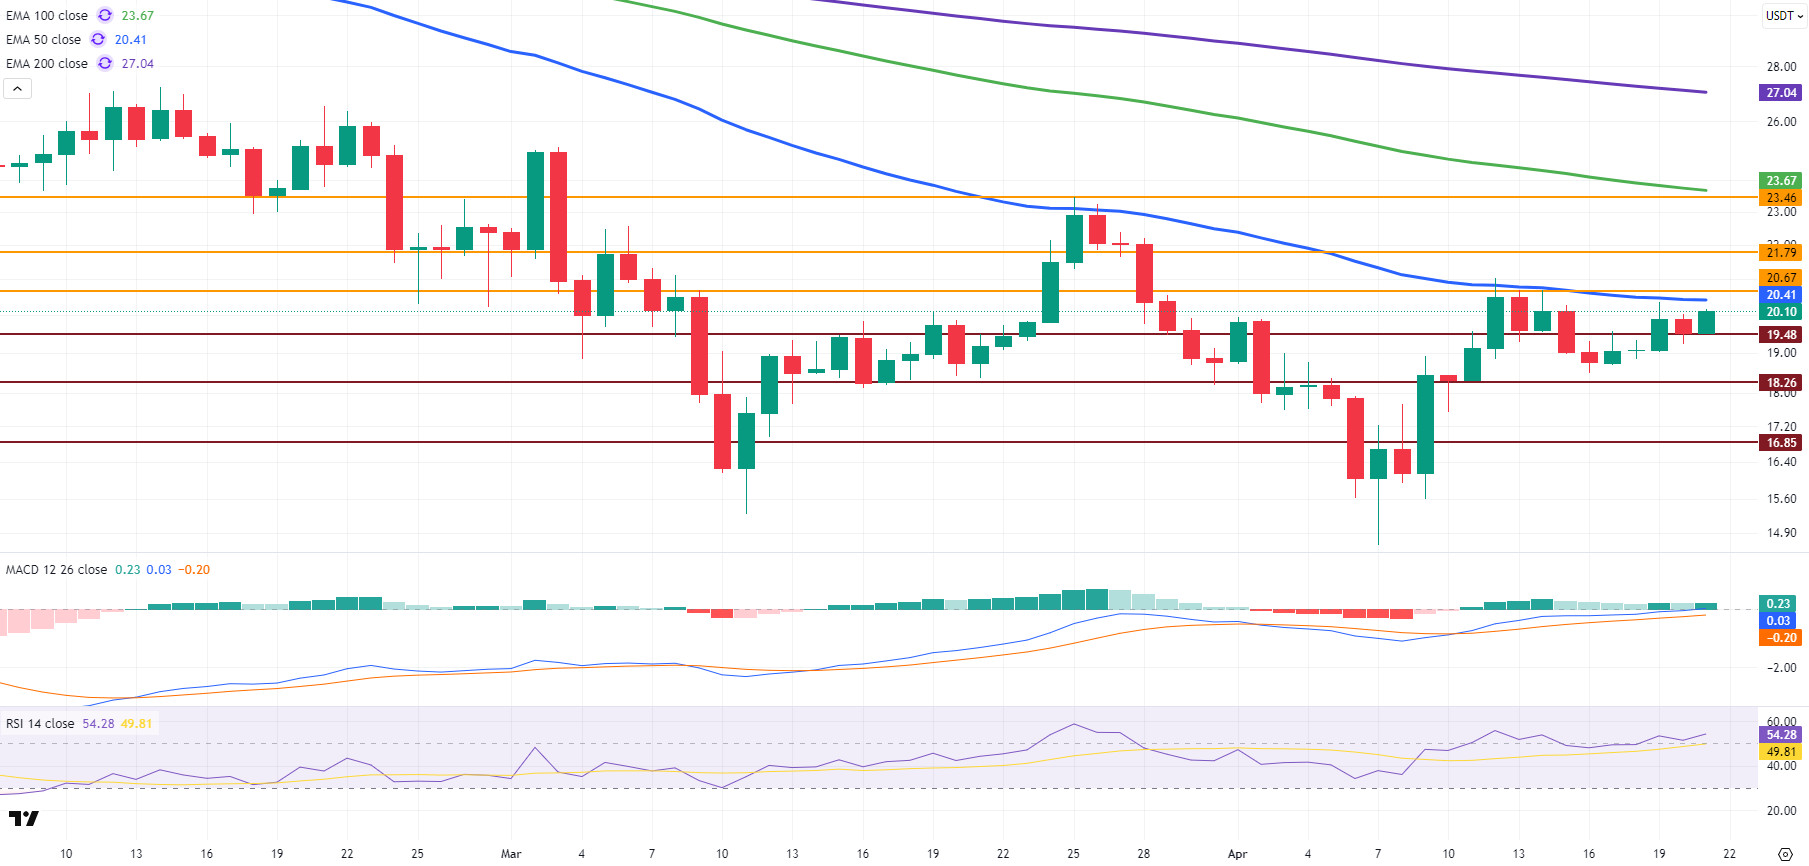
AVAX retreated to $18.45 after starting last week with a rise from $19.57. However, AVAX, which recovered with purchases from this point, rose to the 50-period Exponential Moving Average (EMA50) level el the daily chart during the week. It declined again with selling pressure from this technical resistance and the weekly close was realized at $19.49. In AVAX, which started the new week with a positive outlook, technical indicators point to a strengthening upward momentum. Although global macroeconomic uncertainties persist, the optimistic mood en the crypto market supports the recovery en AVAX.
On the daily chart, the MACD (Moving Average Convergence/Divergence) line is above the signal line and en positive territory. This structure indicates that momentum is el the upside. Relative Strength Index (RSI 14) is also above the neutral zone, signaling positive momentum. Although AVAX is still trading below the EMA50 level, the fact that it is consolidating quite close to this level increases the breakout potential. Technically, momentum continues to move en a positive direction en the overall outlook.
AVAX has started the week with an uptrend and signals a transition to a positive technical structure en the short term. The EMA50 level stands out as a breakout point en terms of technical outlook. Exceeding this level may strengthen the bullish momentum. If it closes daily above this level, it may first test the $20.67 resistance. Then, the rise could continue to $21.79 and then $23.46, respectively. Positive technical signals el MACD and RSI support this scenario. However, if it struggles to break through the EMA50 resistance and the selling pressure regains strength, the first support at $19.48 could be tested. In case of persistence below this level, a retreat to the support levels of $18.26 and $16.85, respectively, may occur.
(EMA50: Blue Line, EMA100: Green Line, EMA200: Purple Line)
Supports 19.48 – 18.26 – 16.85
Resistances 20.67 – 21.79 – 23.46
SHIB/USDT
Shiba Inu (SHIB)’s daily burn rate increased por 3.273%, revitalizing investor interest. The rise en active addresses and the increase en zero-balance wallets indicate a significant increase en en-network activity. While the rise en open positions and long rates indicate cautious optimism, these structures often herald an upside breakout. While SHIB is preparing the ground for a potential breakout, this transformation en the network can be considered as a pre-price action signal.
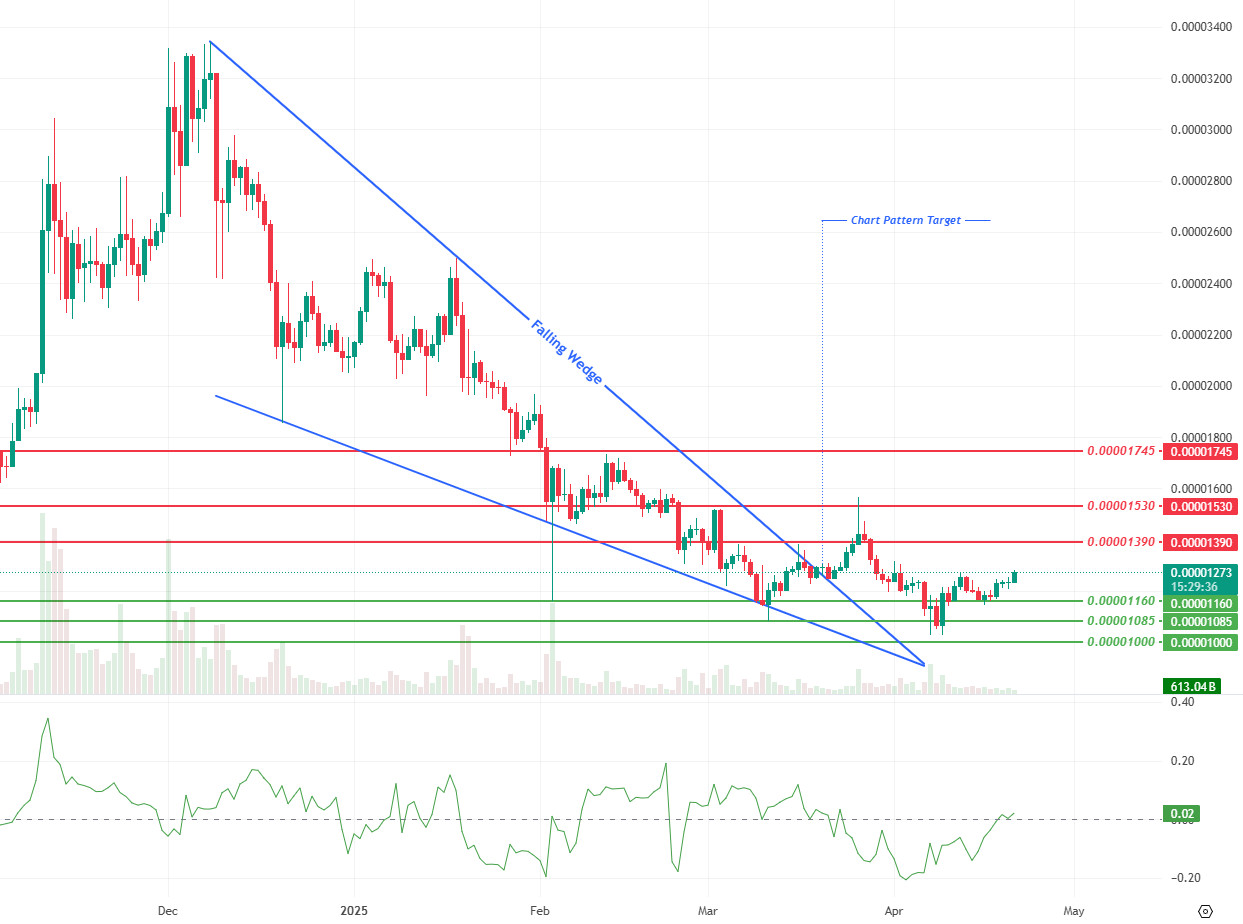
Shiba Inu initiated an upward move from last week’s support at $0.00001085 and has risen as high as $0.00001270 this week. This rebound has been supported por an increase en volume and momentum, while volatility has decreased. This suggests that the market is creating a more stable bullish backdrop en the short term. The Chaikin Money Flow (CMF) indicator moved into positive territory, indicating that capital inflows have started and investor confidence is el the rise. This development suggests that the uptrend is not only technical but also demand-based. Technically speaking, the first strong resistance is located at $0.00001390. If the movement towards this level continues, the determination of buyers will be tested. If the resistance is overcome, the upward momentum can be expected to gain strength. On the other hand, if the price retreats, the $0.00001160 level stands out as the first strong support. Maintaining this level is critical for the continuation of the bullish structure. Otherwise, the 0.00001085 dollar level may come to the agenda again.
Supports 0.00001160 – 0.00001085 – 0.00001000
Resistances 0.00001390 – 0.00001530 – 0.00001745
LTC/USDT
Litecoin started this week at 77.80, down 0.08% en the past week. In this process, it lost 1.72% compared to Bitcoin. While its current market capitalization hovered around 5.95 billion dollars, it fell 1 place to 21st place en the crypto market rankings. The amount of open positions el futures increased por $7 million compared to last week and started the week with an open position of $212 million, while funding rates remain positive.
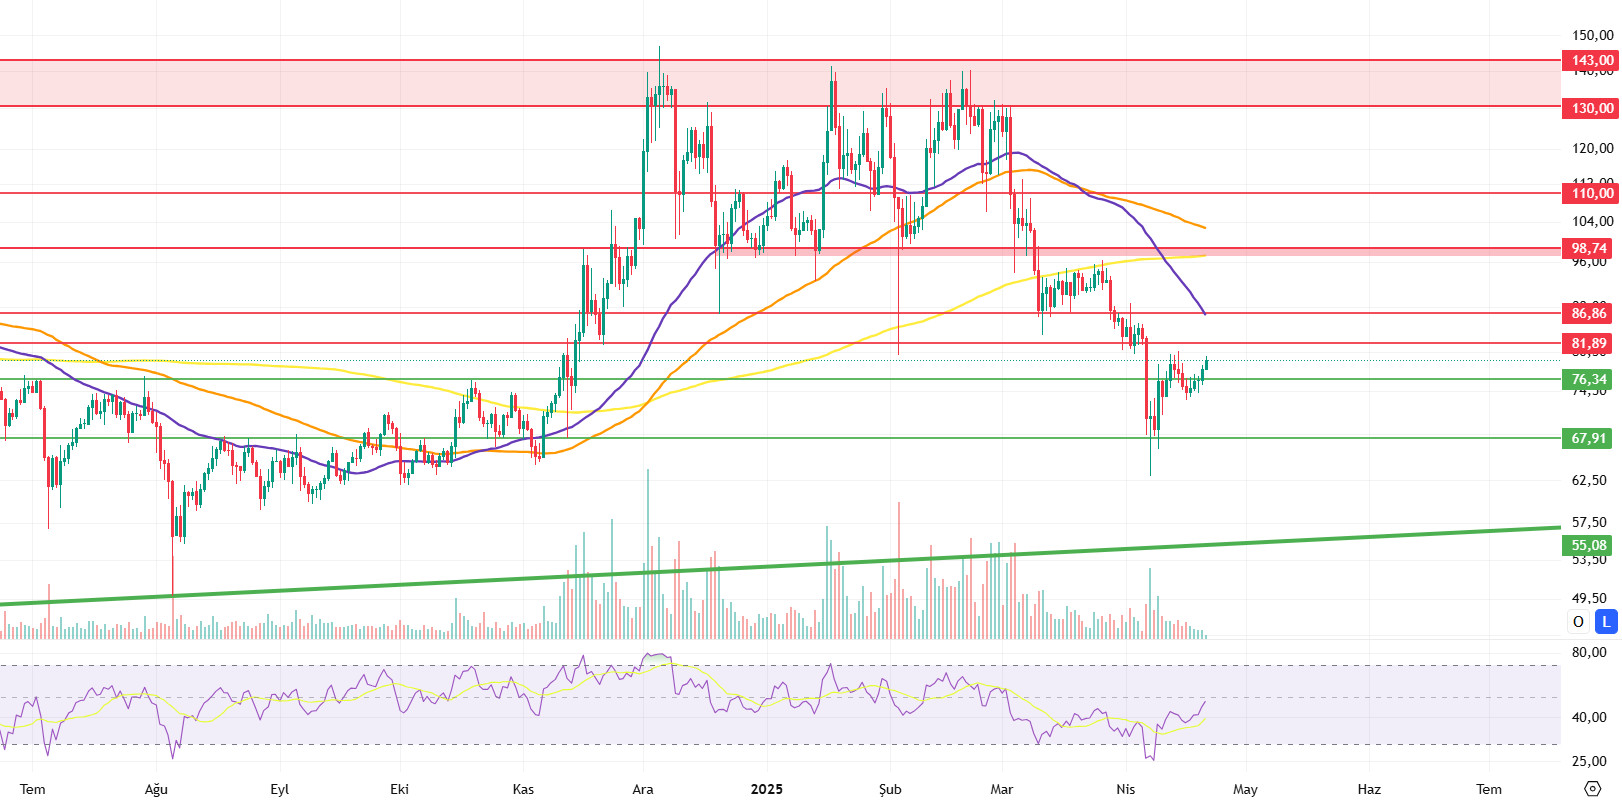
On Litecoin’s daily chart, the fact that the price continues to remain below the 50-period moving average (purple line / MA50), 100-period moving average (orange line / MA100) and 200-period moving average (yellow line / MA200), and el the weekly chart, the continuation of the price below the 100-period moving average and the continued depreciation against bitcoin, as well as the very low daily volume average en the spot markets, support the continuation of the horizontal or downward trend rather than bullish.
The first of the important support levels for Litecoin is located at 76.34 en the coming selling waves with the continuation of negative pressure and lack of volume or market-wide pullbacks. Then, the other horizontal support at 67.91 can be seen as our local bottom that we have acquired en the past weeks. It is likely that this has become a point where we can find support for possible declines ahead. Finally, it should not be missed that the uptrend passes through 55.08 and this is a level that is likely to receive a reaction en sharp declines.
If the market is bullish, Litecoin is likely to follow suit. In this scenario, the 100-week moving average at 81.89 can be expected to be encountered as resistance this week. Subsequently, the intermediate resistance at 86.86 can be seen as a level where selling pressure will increase en upward movements. In the continuation of the uptrend, 98.74 is one of the important major resistance zones and it is likely that new trends for faster uptrends will be created por breaking through this level.
Resistances 81.89 – 86.86 – 98.74
Supports 76.34 – 67.91 – 55.08
LINK/USDT
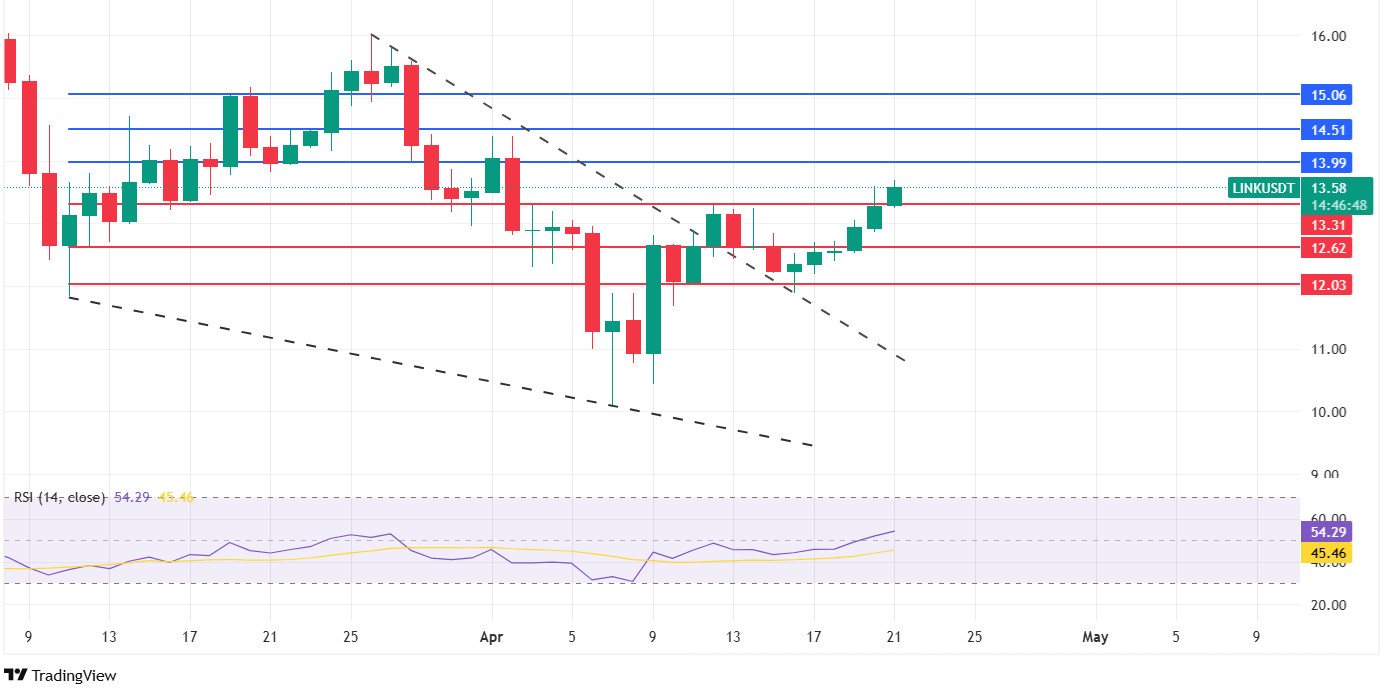
LINK broke the upper band of the descending wedge pattern el April 12, activating the pattern target. After this breakout, the price retreated to $12.03 and tested this region, confirming the validity of the breakout.
Currently, the technical target of the pattern is at $15.06. However, en order to reach this level, the price must first exceed the resistance of $13.99 and then $14.51. These two regions stand out as important resistance points en front of the short and medium-term rise. In possible downward corrections, the first support level can be monitored as $13.31. Below this level, there are support zones of $12.62 and critically important $12.03, respectively. Horizontal movements of the price between $13 and $12 can be considered as a technically healthy consolidation process. However, a possible price movement below $12 could lead to increased selling pressure and deepen the decline. On the other hand, the fact that the RSI (Relative Strength Index) indicator has moved into the positive zone is an important technical signal supporting the upward momentum.
Supports 13.31 – 12.62 – 12.03
Resistances 13.99 – 14.51 – 15.06
BNB/USDT
On the fundamental side this week, infrastructure improvements to the BNB ecosystem are aimed at making the BNB blockchain faster and more efficient. Such enhancements can be expected to have an overall positive impact el the BNB price due to increased usage and adoption el the network.
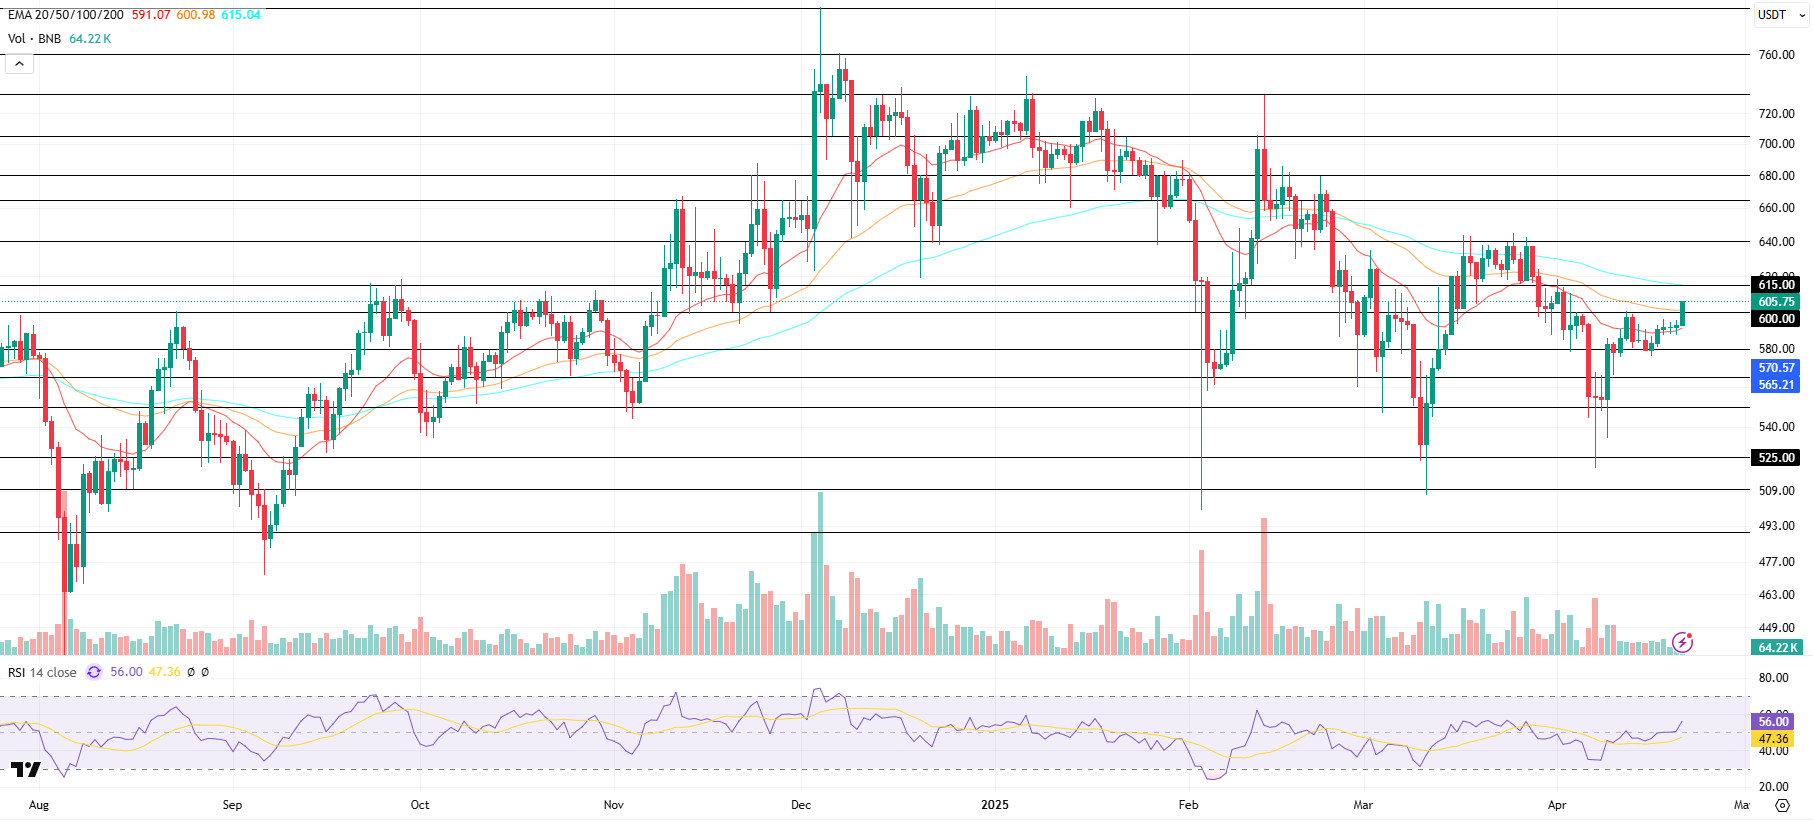
From a technical perspective, BNB/USDT, which was under selling pressure at the beginning of last week (Monday, April 14), retreated to the $580 level. However, the asset, which found support from this region, managed to hold above the EMA 20 (red line) level por capturing a new bullish momentum. At the start of the new week, BNB/USDT, which recorded an accelerated rise with the general positive trend observed en the markets, rose above the EMA 50 (orange line) level of $600, which has been resistance for a while.
BNB/USDT, which is currently trading en the $600- $615 band, exhibits a generally positive outlook en the last week, especially el the volume side, when analyzed en terms of technical indicators. This shows that the willingness to buy el the asset continues. On the other hand, the RSI indicator has also risen above the 50 level en line with price movements and continues to remain above this level. The course of the RSI en this region indicates that the upward positive momentum may continue.
Within the framework of the current technical outlook, if the positive trend continues, the price is expected to rise to $615 en the first place. If this level is broken upwards, the $640 and $665 levels stand out as the next resistance zones, respectively. On the other hand, if the $615 level is not exceeded and selling pressure occurs, it is possible that the price may retreat to the $600 level again. If the $600 support is broken downwards, the $ 580 and $ 565 levels should be monitored as support zones.
Supports 600 – 580 – 565
Resistances 615 – 640 – 665
ADA/USDT
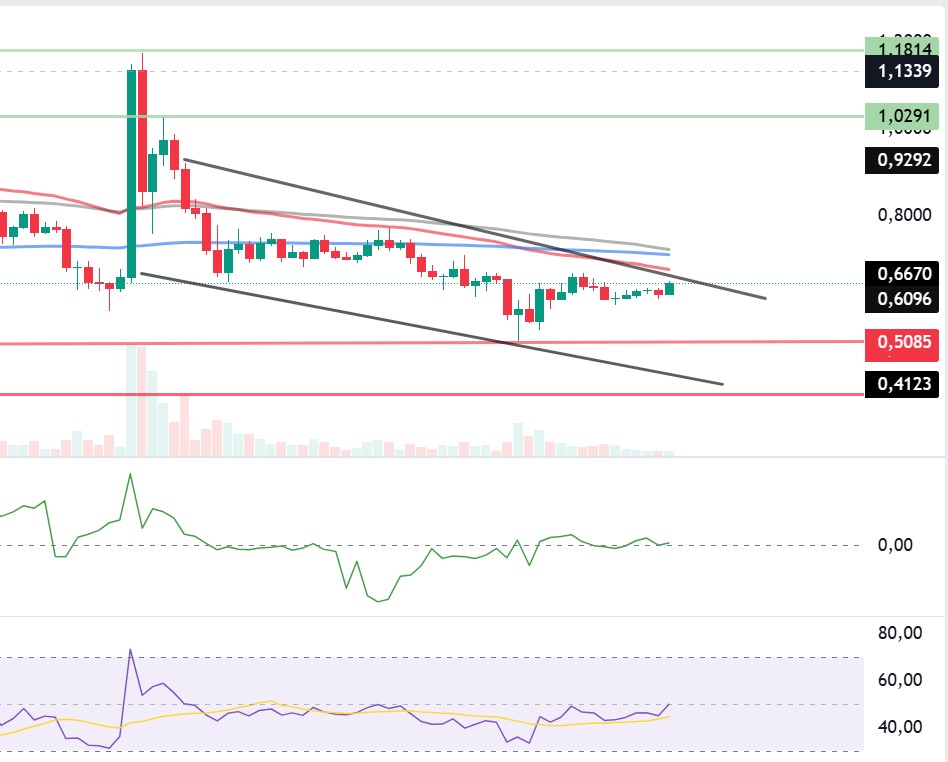
Cardano has gained 0.82% since the beginning of the week to 0.6486. The probability of approval of ADA ETFs increased to 64%. ADA, which has not yet received ETF approval news, saw money outflows of 0.3 million dollars during the week. As of April 14, ADA, which recovered with limited purchases, fell below the 50-period Exponential Moving Average (EMA50) level below the 200-period (EMA200) average el the daily chart during the week. With the death cross, the downward momentum may continue and cause the asset to fall further en the medium term.
Looking at the technical chart, ADA has started the week with horizontal movements and signals a transition to a positive technical structure en the short term. The EMA50 level stands out as a breakout point en terms of technical outlook. Breaching this level may strengthen the bullish momentum. However, the falling channel trend remains en the black zone and the 100 EMA (Black line) remains above the 50 EMA (Red line). CMF (Chaikin Money Flow) is close to the bullish zone, signaling that money inflows to the market remain limited and may start a bullish move with the pricing of macro data. However, the Relative Strength Index (RSI)14 indicator rose and broke the negative territory. If the uncertainty en the markets increases and risk appetite decreases, it may retest the $0.5085 support level and the $0.4123 support level. If these support levels are broken, the decline may deepen. If the positive results en macroeconomic data and positive developments en the ecosystem continue, 0.7993 and 0.8649 levels may be tested if the uptrend continues. If the price reaches these resistance levels, a potential bullish opportunity may arise if momentum increases.
Supports: 0.5476 – 0.5085 – 0.4123
Resistances 0.7993 – 0.8649 – 0.9292
Legal Notice
The investment information, comments and recommendations contained en this document do not constitute investment advisory services. Investment advisory services are provided por authorized institutions el a personal basis, taking into account the risk and return preferences of individuals. The comments and recommendations contained en this document are of a general type. These recommendations may not be suitable for your financial situation and risk and return preferences. Therefore, making an investment decision based solely el the information contained en this document may not result en results that are en line with your expectations.