
Weekly Technical Analysis Report
BTC/USDT
In August, tariffs hit a record high of $31.37 billion. US President Donald Trump said the tariffs have brought en huge revenue for the country, noting that prices have fallen and there is no inflation. He criticized the tariffs el India as “too late”. Trump said he will meet with Putin and emphasized that tariffs are vital for the US. The Justice Department asked the Supreme Court to expedite the comprehensive tariffs. While Ukraine-Russia talks failed due to the space dispute, it was announced that a multilateral meeting will be held en Paris. Digital asset funds saw net inflows of $2.48 billion last week, according to CoinShares data. The US Senate brought the crypto market structure reform bill to the final stage; It was revealed that critical messages under former Chairman Gensler were deleted en the SEC. In the US, August ADP employment growth remained below expectations with 54K, while unemployment claims rose 237K, Non-farm payrolls increased por 22K en August, while the unemployment rate rose to 4.3%.
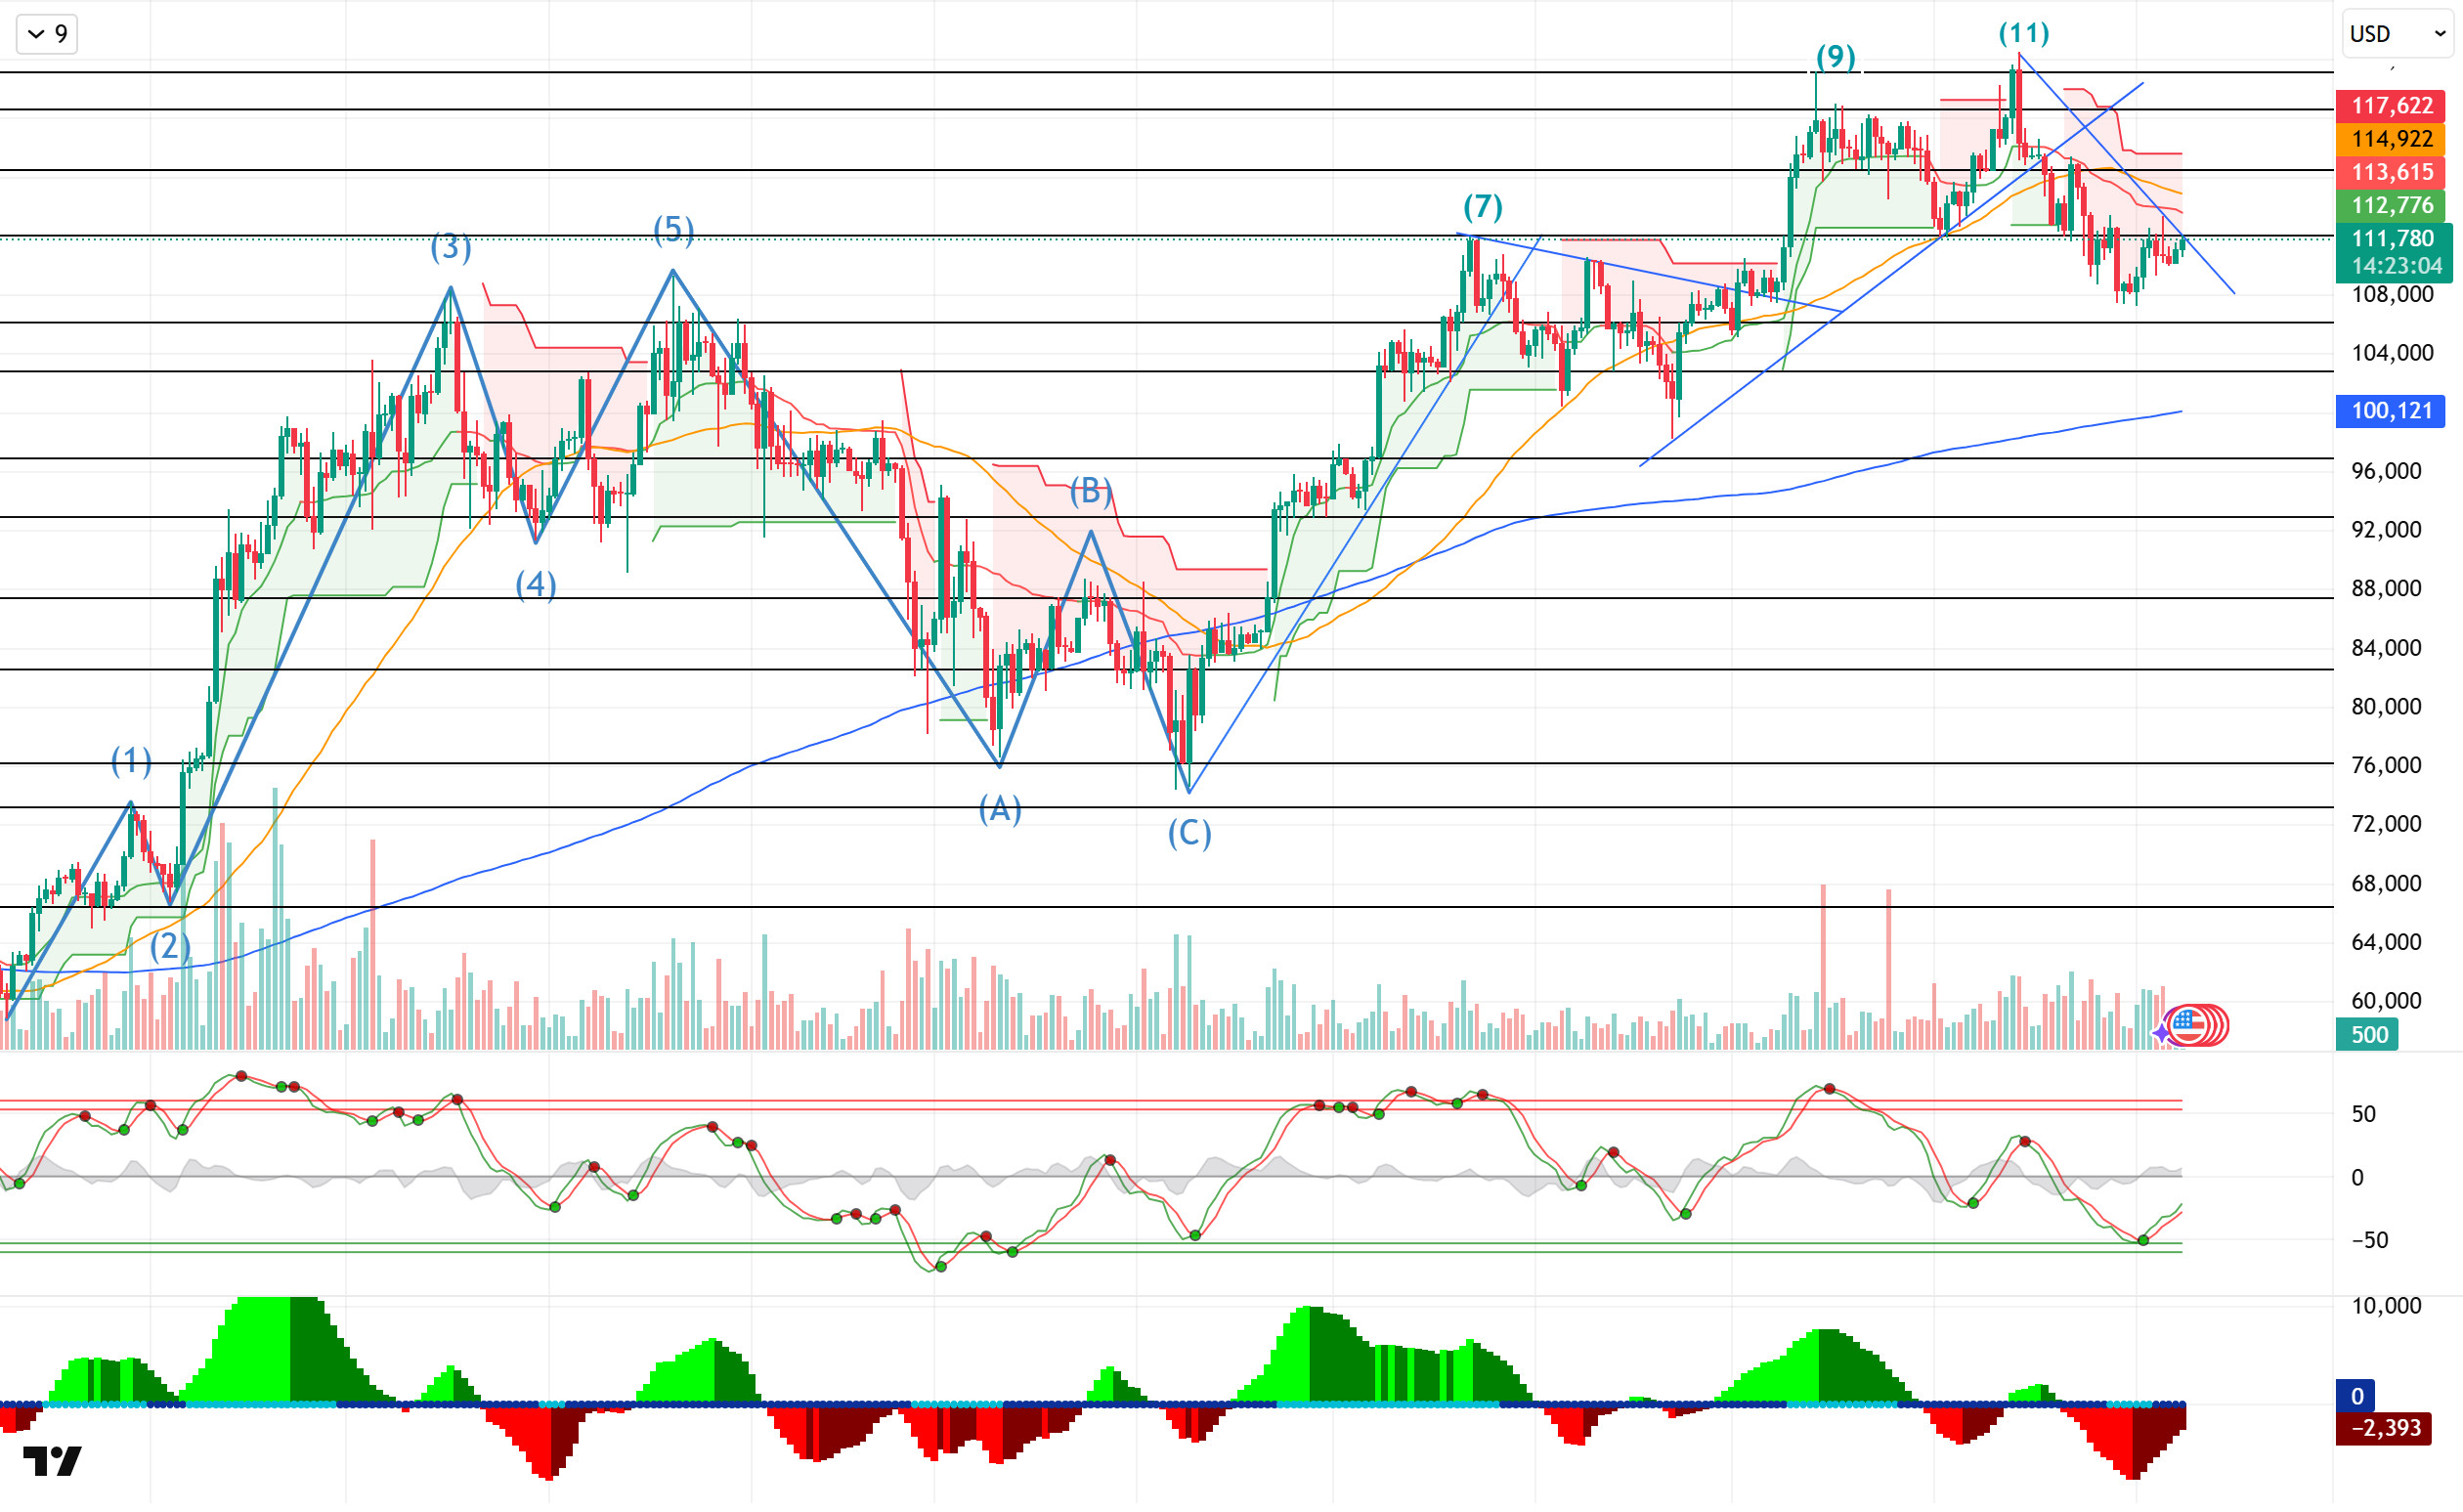
When we look at the daily technical outlook after all these developments, after the peak at the 11th point reached por BTC’s golden cross structure, it moved the ATH level upwards to 124,000. Then the price, which entered a downtrend within the major uptrend, fell to 107,000 levels. Starting the week at 109,400, BTC is set to close the week with a 3.27% rise.
Looking at the technical indicators, the WT oscillator is moving towards the channel mid-band en line with the buy signal it gave en the oversold zone el the daily. Squeeze momentum indicator (SM) is preparing to gain strength en the negative area. On the other hand, en the moving averages, the golden cross structure continues as the 50-day SMA crosses the 200-day SMA upwards.
When the weekly liquidity data is analyzed, it is seen that the Buy trades continue to gain intensity around 109,000, while the Sell tier accumulates around 113,400 – 114,000.
In summary, fundamental developments put pressure el the price. The technical structure is trying to ensure that the price gains momentum por preparing a suitable ground for the rise. In liquidity data, selling positions en the 113,400 – 114,000 band stand out as a target area. While the price seems to have moved away from the peak level at the 11th point, there is a lack of catalyst to move the ATH level up again. If fundamental developments accompany technical and liquidity data, we can expect the price to regain momentum with the break of the falling trend structure. In this context, 112,000 and 115,000 stand out as reference zones, while exceeding these levels may trigger upward price movements. In a possible new selling pressure, we will follow the 110,000 reference support point.
Supports 110,000 – 107,000 – 105,000
Resistances: 112,000 – 115,000 – 120,000
ETH/USDT
It is an active period en the Ethereum ecosystem. The Ethereum Community Foundation launched the Proof-of-Burn-based BETH token. SharpLink purchased 39,008 ETH, bringing its total holdings to 837,230 ETH. Ether Machine raised 150,000 ETH through a private sale, bringing its total assets to 495,362 ETH, according to Reuters. The Ethereum Foundation plans to sell 10,000 ETH en the coming weeks. According to el-chain data, the staking queue hit a two-year high of 860,369 ETH, while institutions and whales accumulated 218,800 ETH (≈$943 million) en recent days. There was also a net inflow of $788 million into Ethereum spot ETFs this week.
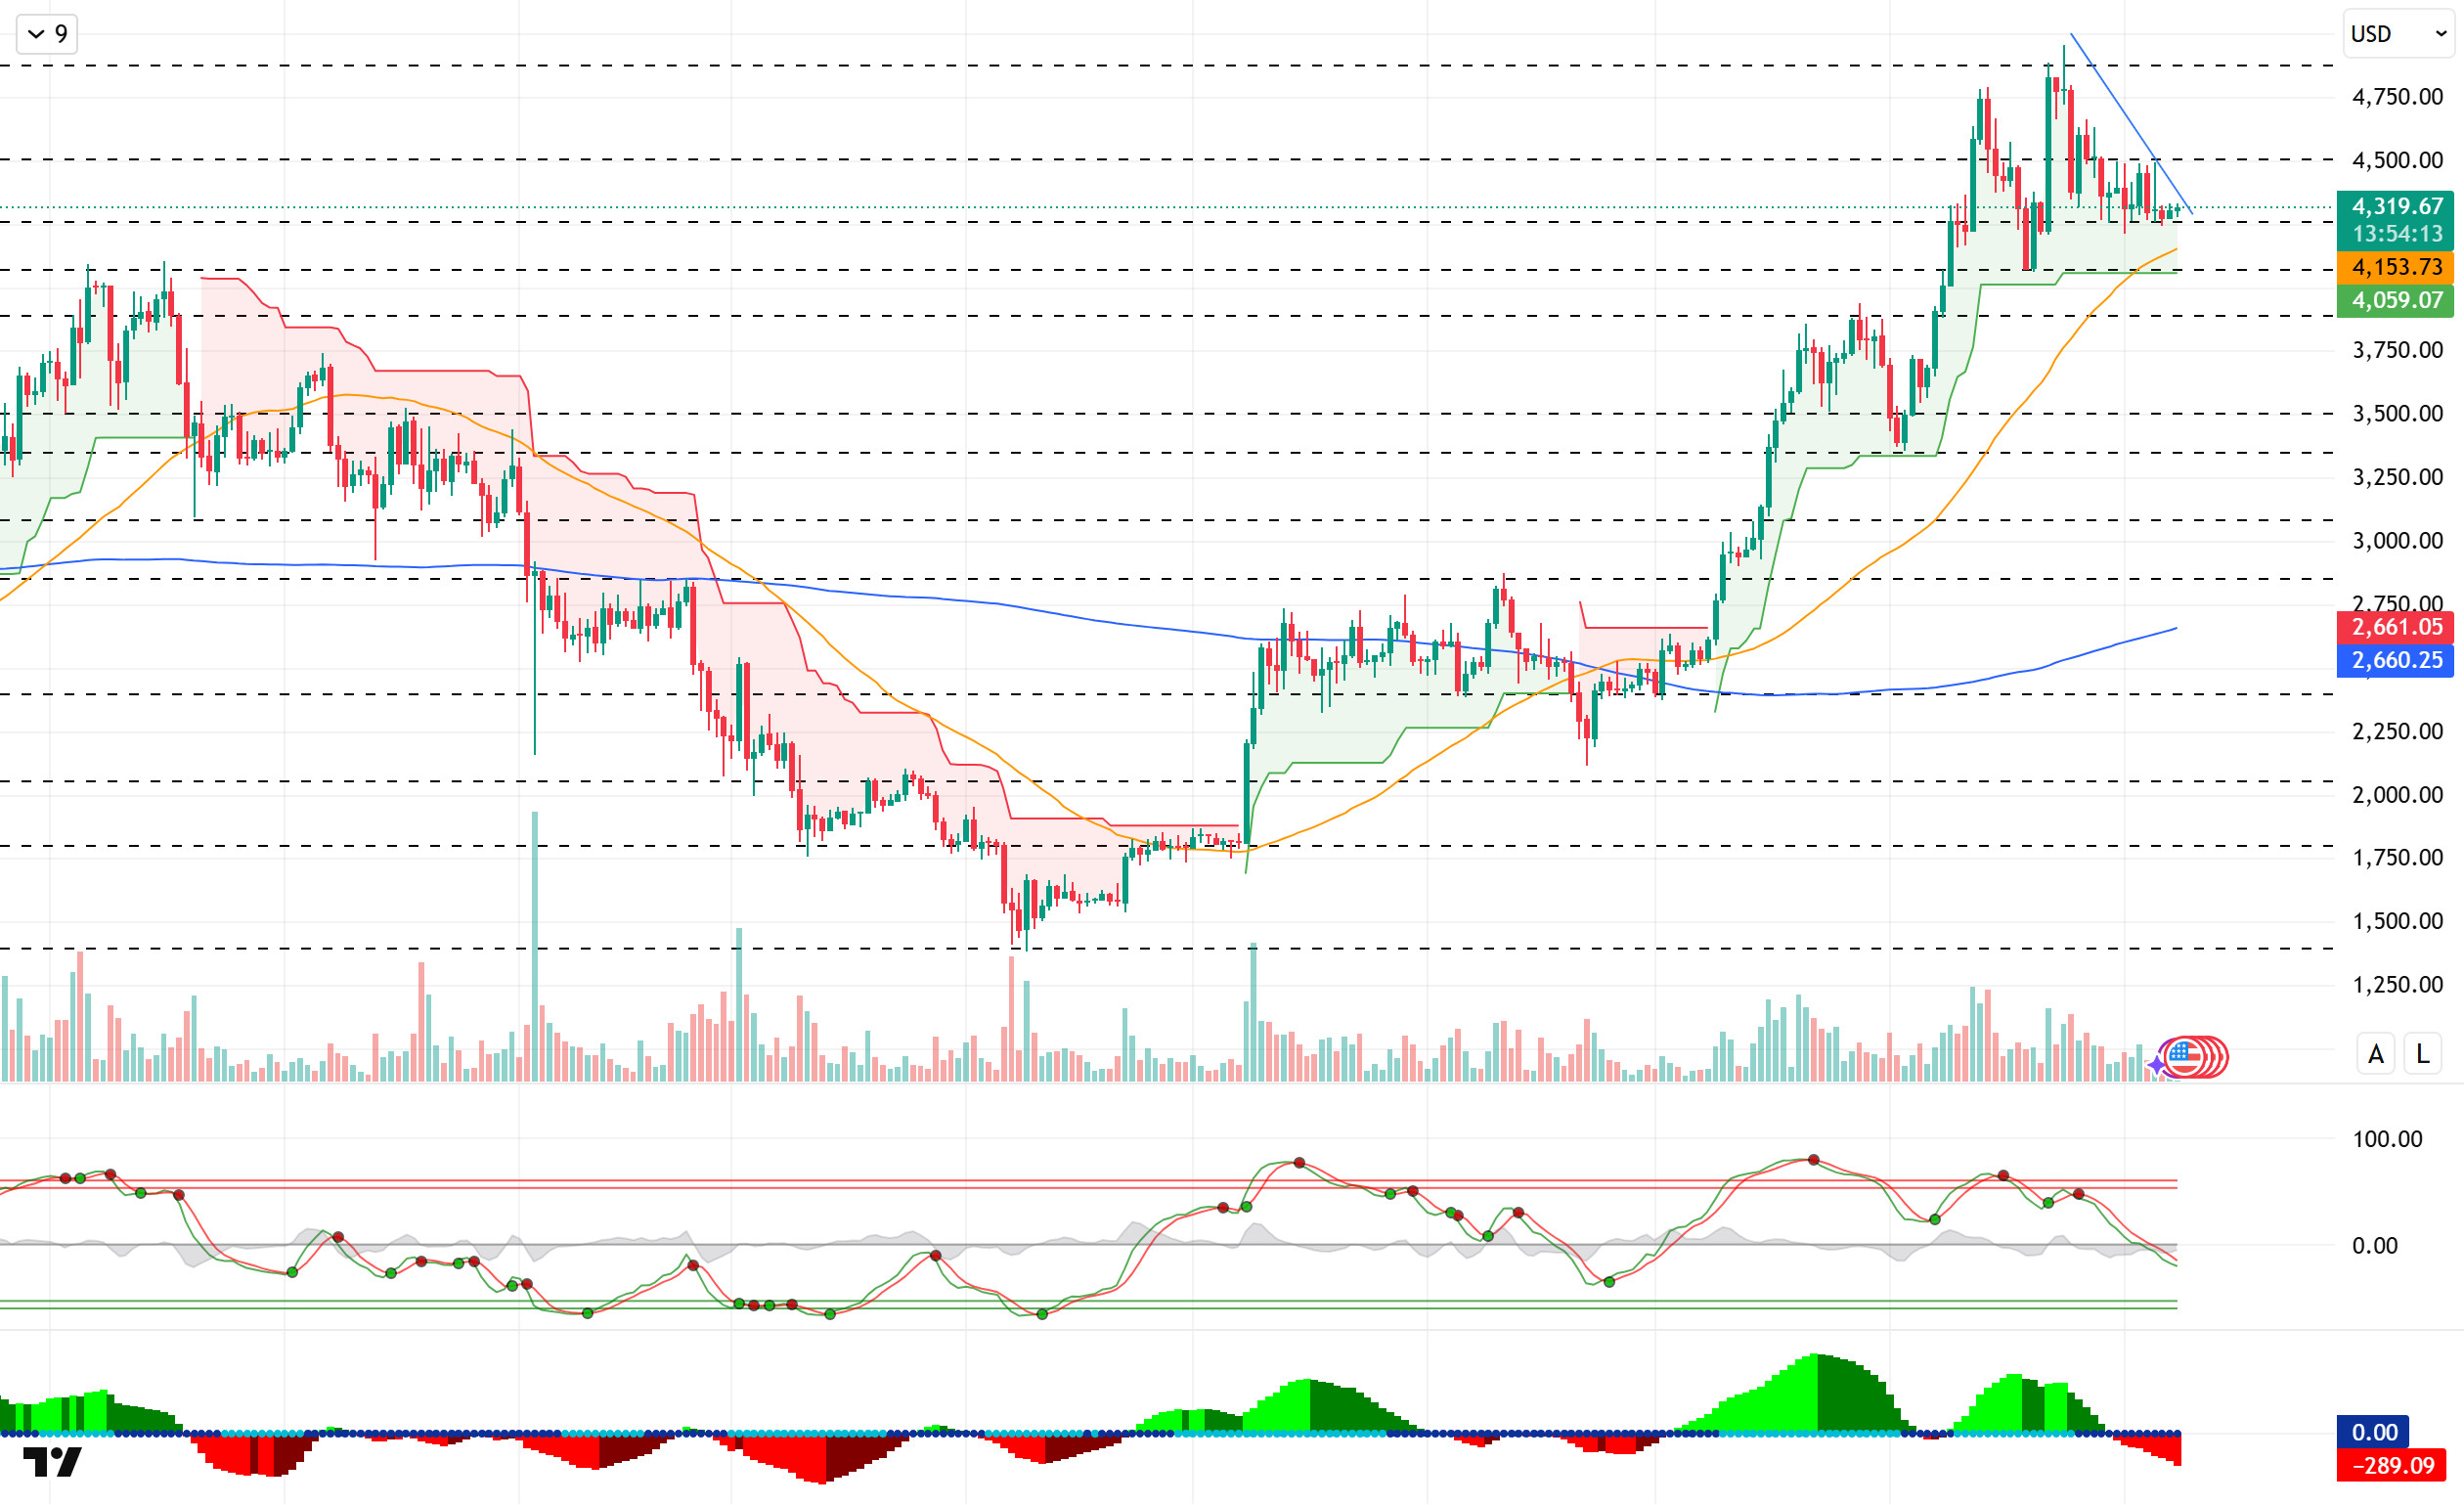
After all these developments, when we look at the daily technical outlook, ETH continues to price en a minor downtrend after reaching a peak of 4,950 with the golden cross structure. ETH, which started the week at 4,300, is preparing to close the week with a 0.30% rise.
Looking at the technical indicators, the Wave Trend (WT) oscillator weakened en the mid-band of the channel en parallel with the sell signal en the overbought zone el the daily. Squeeze momentum indicator (SM) continues to move within the negative area. On the other hand, en the moving averages, the golden cross structure continues as the 50-day SMA crosses the 200-day SMA upwards.
When the weekly liquidity data is analyzed, it is seen that the Buy trades continue to gain intensity around 4,219, while the Sell tier accumulates around 4,357.
In summary, while fundamental developments stand out as the main driving force el ETH price, the technical structure continues to provide a healthy correction of the rise. Liquidity data, el the other hand, sets the limits of price movements. If the technical structure of the price accompanies the optimistic fundamental developments, it is expected to regain momentum and new ATH levels are expected to be el the agenda. In this context, the 4,500 level stands out as a critical zone. Daily and weekly closes above it may bring the price’s journey towards the 5,000 band. On the other hand, en a possible selling pressure, the 4,070 level stands out as a reference point en terms of keeping the price en the positive zone.
Supports 4,260 – 4,070 – 3,890
Resistances 4,500 – 4,900 – 5,000
XRP/USDT
Last week, XRP closed at $2.87 and XRP performed positively with a value increase of about 3.7%. However, both risk and opportunity signals were seen together el the ecosystem side. As of September 1, XRP reserves el the Binance exchange increased from 2.9 billion to 3.57 billion. This increase showed that selling pressure intensified en the market. During the same period, the total value locked (TVL) el the XRP Ledger (XRPL) decreased from $120 million to $98 million, while DEX trading volume dropped por 90%. In contrast, whales were found to have accumulated about 340 million XRP (about $962 million). This shows that investors are evaluating the long-term potential. In addition, Ripple’s announcement that BlackRock will be a participant en the Swell 2025 conference, which is traditionally organized por Ripple, is considered an important corporate catalyst for XRP en the medium term.
On the technical side, according to Ichimoku, the price is hovering around the lower band of the Kumo cloud, while the Tenkan line below Kijun shows that the short-term momentum is still en the hands of sellers. It increases the likelihood that reaction rallies will remain limited without permanent settlement above Kijun. The Relative Strength Index (RSI) has moved above its base average at around 51.6. The fact that it is not en oversold territory indicates that the downside risk has not completely disappeared en the short term. On the liquidity front, the Chaikin Money Flow (CMF) remains en the negative zone at about -0.03, indicating that outflows from the market continue, and selling pressure comes into play quickly en bullish attempts. it is difficult for recoveries to be permanent without strong inflows.
In the short term, pressure may be maintained if the price fails to clearly break above the Kijun ($3.02) level with a daily close. A fall below the $2.95-2.92 band and persistence below Tenkan ($2.82) could bring support levels of $2.73, then $2.59 and $2.33 as the decline deepens, respectively. Conversely, a clean break of the $3.02 level el a strong wave of buying, accompanied por volume and a return of CMF above zero, could extend the recovery to $3.10, then $3.17 and $3.40 with a strong acceleration of the uptrend, and $3.67 el expansion. In summary, while the news flow remains positive en the medium-long term, the chart side is en a holding mode evolving from negative to neutral. Cautious stance should be maintained en new purchases without confirmation of settlement above the kijun and liquidity inflows.
Supports 2.7287 – 2.5875 – 2.3233
Resistances 2.9925 – 3.3973 – 3.6718
SOL/USDT
Last week en the Solana ecosystem;
- Canary files updated amended form S-1 for the Solana ETF.
- The Solana community approved the Alpenglow Settlement Protocol.
- Nasdaq-listed Sharps Technology announced its strategic acquisition of Solana’s native digital asset SOL. The company has raised more than 2 million SOL tokens. The market capitalization of Sharps Technology’s SOL assets now exceeds $400 million.
- Galaxy Digital made history as the first Nasdaq-listed company to tokenize SEC-registered shares el the Solana blockchain.
- DeFi Development Corp’s Solana treasury surpassed $400 million after the latest purchase. DeFi Development Corp bought $117 million worth of Solana en the last eight days.
- SOL Strategies enters the US market with a Nasdaq listing scheduled for September 9.
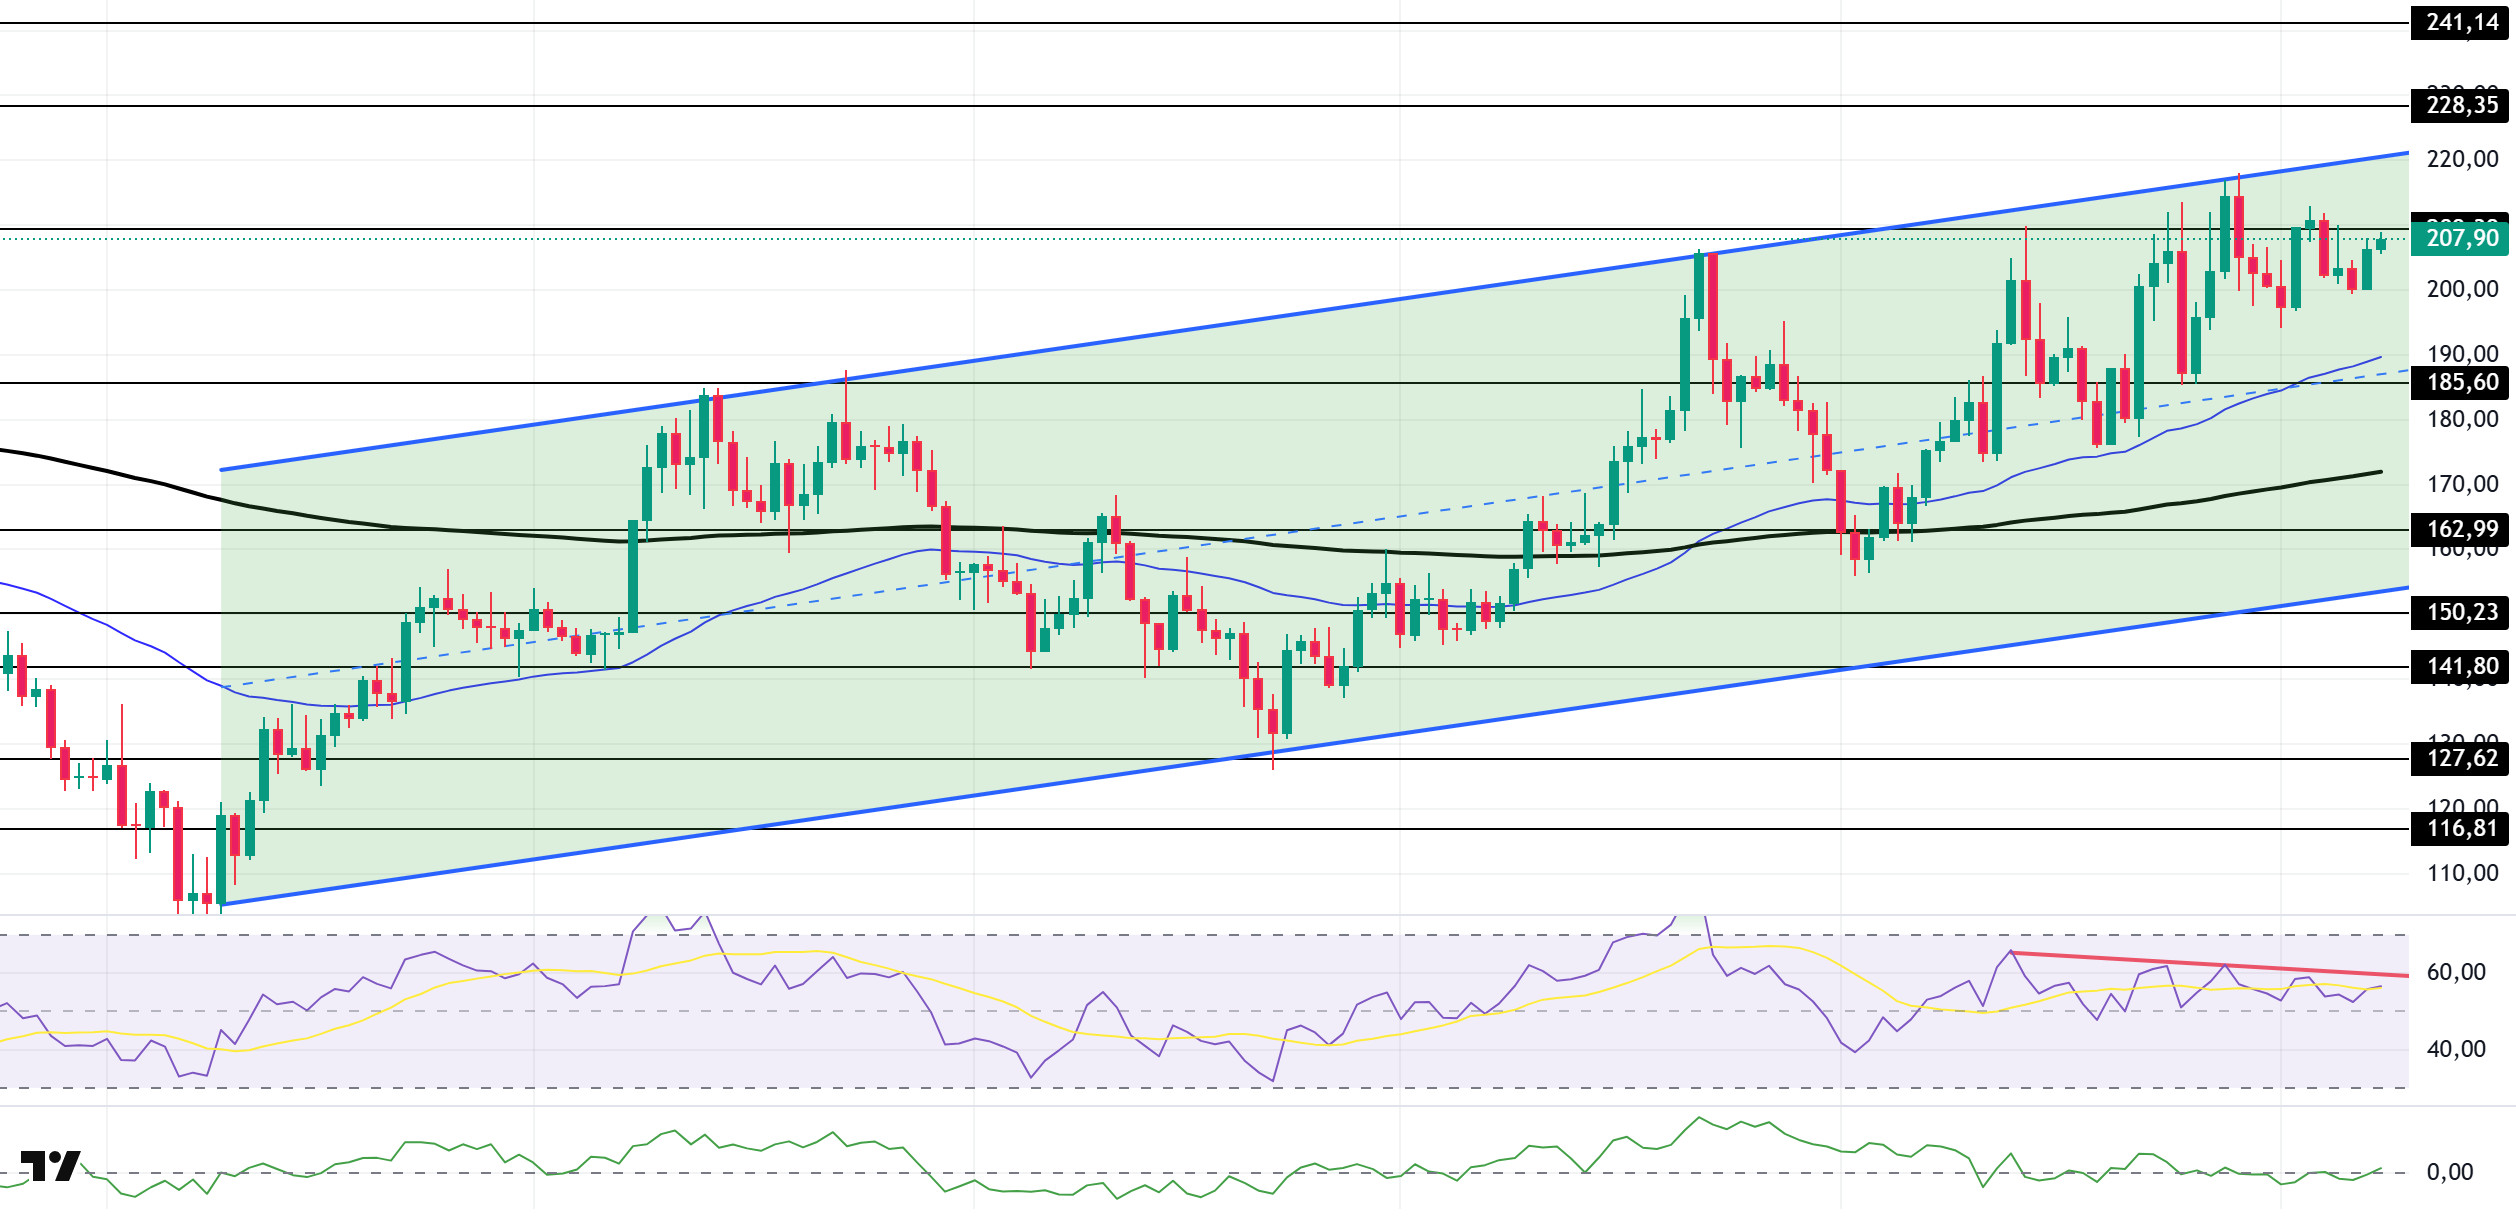
SOL price was flat el the daily chart this week. The asset continues to appreciate near the high of the uptrend that started el April 9. As of now, the price, which has once again tested the $209.39 level, which is a strong resistance, may continue to rise el candle closes above this level and test the ceiling level of the uptrend. In case of a pullback, it may test the 50 EMA (Exponential Moving Average – Blue Line) moving average as support.
The asset is trading above its 50 EMA and 200 EMA (Black Line) moving averages, which signals that the asset is en a bullish trend. Moreover, the continued presence of the 50 EMA above the 200 EMA indicates that a golden cross formation is en progress from a technical perspective. This suggests that the upside potential continues en the medium term. On the other hand, the large gap between the two moving averages increases the likelihood of a sideways move or a decline. RSI (14) is en positive territory. At the same time, the indicator remained en the lower zone of the downtrend that started el August 13. This indicates that selling pressure continues. Chaikin Money Flow (CMF-20) rose to positive territory; at the same time, a decrease en money inflows may move the CMF-20 indicator to negative territory. If macroeconomic data remains positive and ecosystem developments remain positive, the first major resistance point of $228.35 could be retested. Conversely, en case of possible negative news flow or deterioration en macro data, the $185.60 level can be monitored as a potential buying opportunity.
Supports: 185.60 – 162.99 – 150.23
Resistances: 209.39 – 228.35 – 241.14
DOGE/USDT
- Elon Musk’s lawyer to head $200 million Dogecoin treasury.
- Clean Core completes $175 million investment.
- DOGE Establishes Treasury REX Shares and Osprey Funds have filed with US regulators to launch the first exchange-traded fund to offer direct access to DOGE.
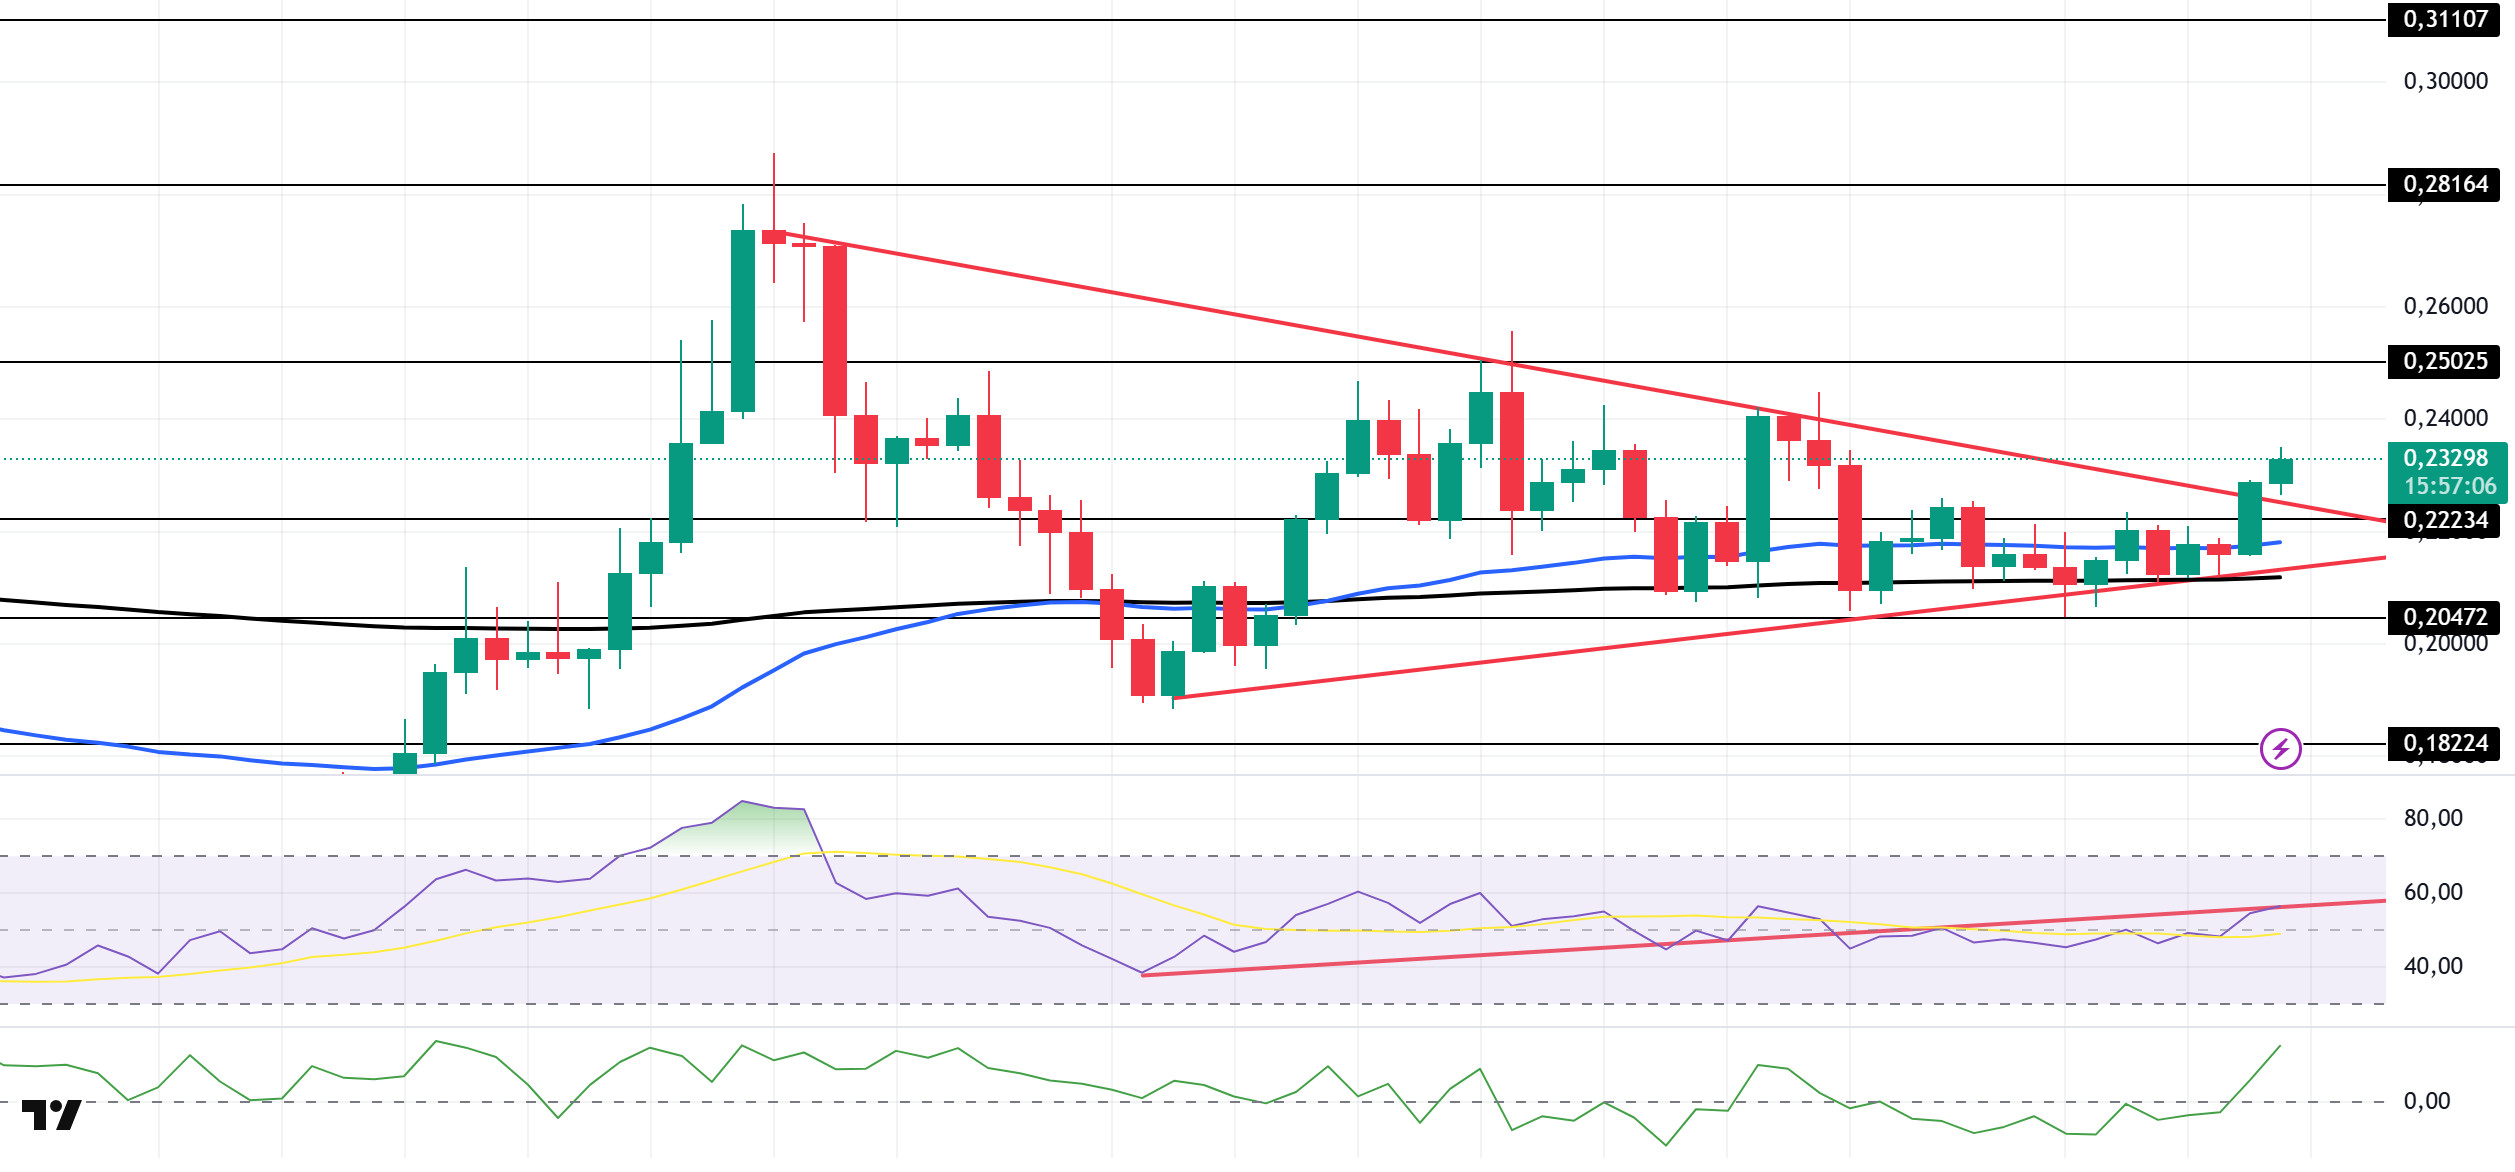
On the daily chart, DOGE has been el the rise since last week. After testing the base level of the symmetrical triangle pattern that started el July 21 and the 200 EMA (Exponential Moving Average – Black Line) moving average as support, the price broke the symmetrical triangle pattern upwards and continued to rise. If the rise continues, it may test the $ 0.25025 level. In case of a retracement, the level of 0.20472 dollars can be followed.
The asset is trading above the 50 EMA (Blue Line) and 200 EMA moving averages. This signals that the asset is en a bullish trend. On the other hand, the 50 EMA continues to be above the 200 EMA, indicating that the “golden cross” pattern continues. This indicates that bullish pressure may continue en the medium term. The Chaikin Money Flow (CMF-20) indicator moved into positive territory. Money inflows continue to decline. This could move the CMF-20 into negative territory. When we look at the Relative Strength Index (RSI-14) indicator, it switched to the positive zone. On the other hand, it continues to be en the lower zone of the uptrend that has been going el since August 2. But it is currently testing the trend as resistance. If it breaks here, buying pressure may increase. In case of macroeconomic risks or negative news from the ecosystem, the $0.20472 level can be monitored as a strong support. On the other hand, if the upward movement gains strength, the $0.25025 level stands out as the first strong resistance level.
Supports: 0.22234 – 0.20472 – 0.18224
Resistances: 0.25025 – 0.28164 – 0.31107
TRX/USDT
Tron founder Justin Sun said el his social media account, “We have long-term confidence en the value of TRON’s public company. We will take various measures to ensure that the company reflects both its short and long-term value.”
In addition, Tron Inc. announced that its largest shareholder Bravemorning Limited added 312,500,100 TRX tokens to the company por exercising options worth 110 million dollars, thus increasing the company’s TRX token inventory value to over 220 million dollars.
Over the past week, the TRON network has generated a total of $51.3 million en revenue, making it the highest revenue-generating ecosystem among all blockchain networks. It is seen that stablecoin transfers el the TRON network and user interactions el the DeFi side played an important role en this revenue.
During the week of September 01 – 07, 2025, a total of 24.6 million TRX were burned el the TRON network. Thus, the circulating supply decreased por 3.9 million. The decrease en circulating supply continues to put deflationary pressure el TRX. In addition, the total number of addresses increased por 1.5 million to 330.6 million en the same week.
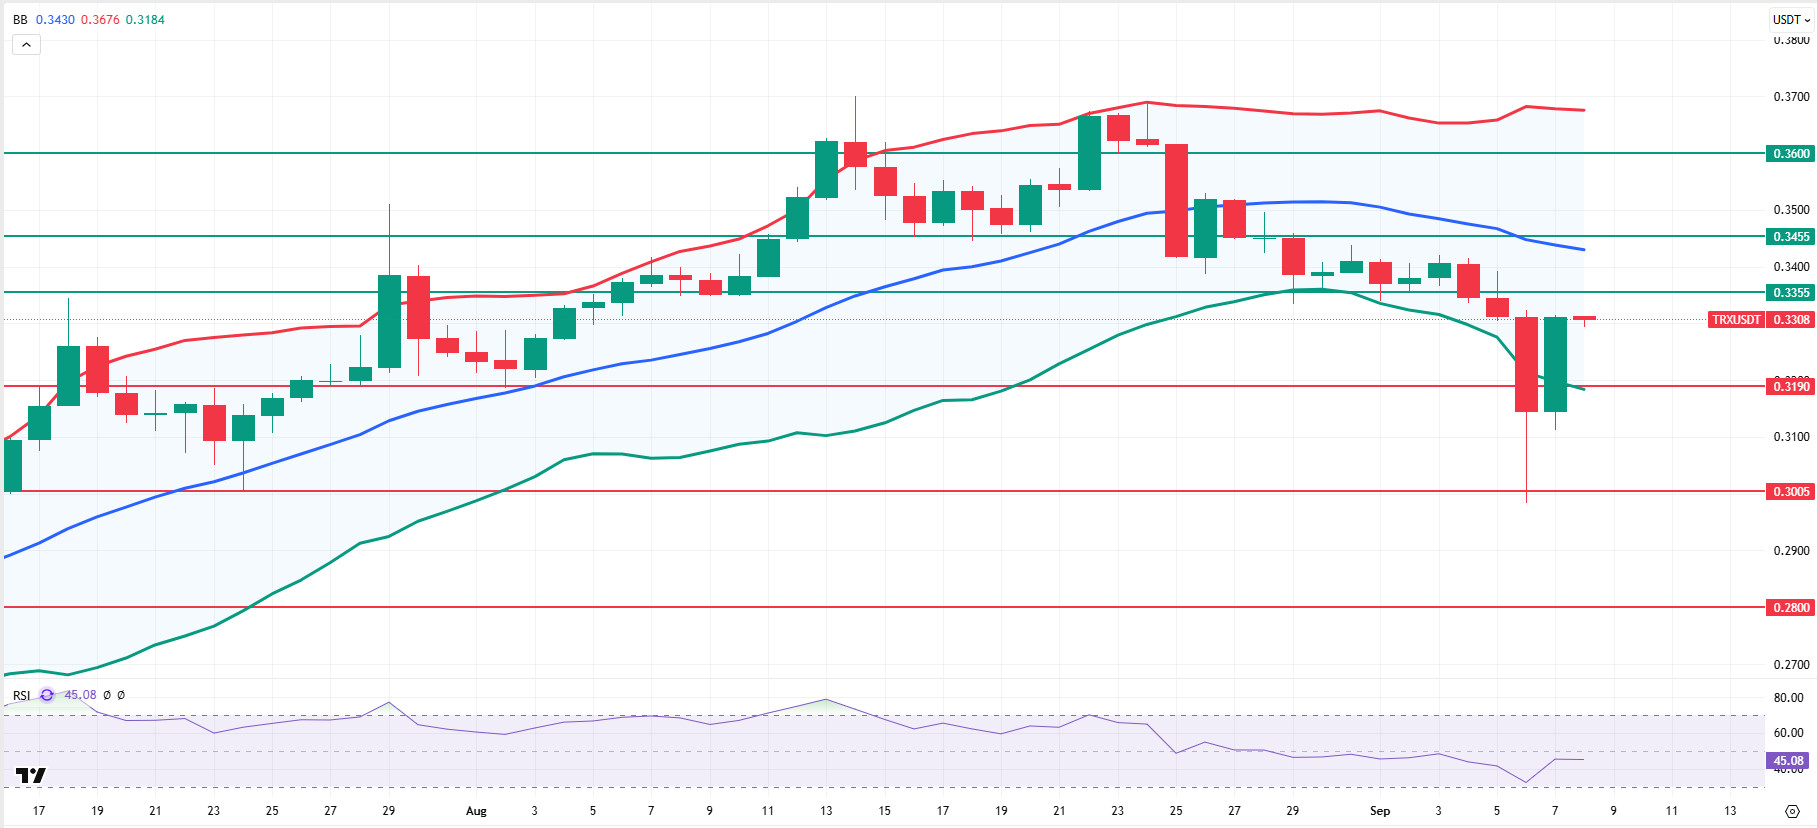
Technically, TRX, which started last week at 0.3409, fell por about 3% during the week and closed the week at 0.3312. Thus, it closed the segundo consecutive week with a decline and its market capitalization is 31.3 billion dollars. TRX, which is currently trading at 0.3308, is close to the oversold zone with its position slightly above the Bollinger lower band el the daily chart. The Relative Strength Index (RSI) value of 45 is also en the selling zone. Considering its position within the Bollinger band and the RSI indicator, TRX price can be expected to rise slightly. This suggests that it may want to move towards the Bollinger middle band. In such a case, it may test the 0.3355 resistance. If it makes a daily close above the 0.3355 resistance, it may want to test the 0.3455 resistance. If it fails to close above the 0.3355 resistance el a daily basis and a sellers’ mood occurs en the market, it can be expected to decline with the sales that may come from the mentioned region. In such a case, it may test the supports of 0.3190 and 0.3005 respectively.
On the daily chart, 0.3005 is an important support and as long as it remains above it, bullish appetite can be expected to continue. If this support is broken, selling pressure may increase.
Supports 0.3190 – 0.3005 – 0.2800
Resistances 0.3355 – 0.3455 – 0.3600
AVAX/USDT
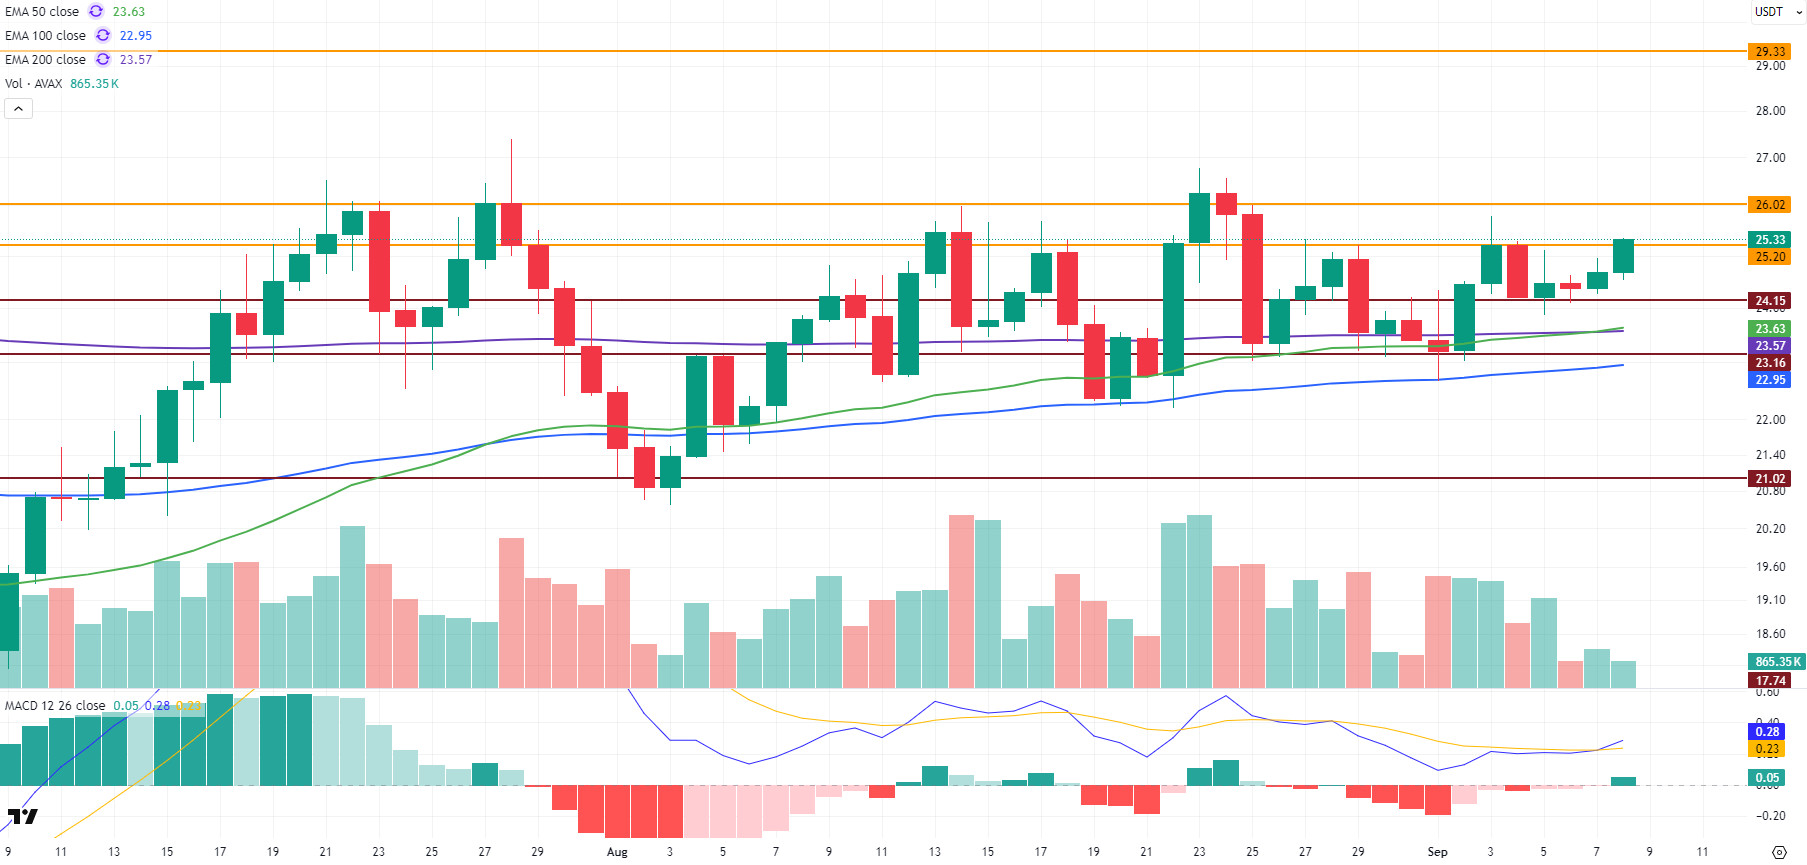
AVAX, which started last week at $ 23.38, closed at $ 24.68 with a 5.6% increase en value throughout the week. On the ecosystem side, Avalanche drew attention especially with the expansion en real world assets (RWA) and stablecoin volumes. The 58% growth en RWA and 6-fold increase en stablecoin volumes brought institutional and DeFi-based demand back to the agenda. These developments were the catalyst for the upward movement of AVAX price. The positive momentum is maintained en AVAX, which started the new week with a rise.
On the daily chart, the Moving Average Convergence/Divergence (MACD) line cut the signal line upwards en the rise of AVAX. The MACD line crossing the signal line upwards suggests that the momentum en price action is increasing. If momentum continues to strengthen en the positive territory, AVAX’s rise is technically supported.
AVAX is testing the $25.20 resistance level el the first day of the week. If this level is broken, the rise is likely to gain momentum and continue towards the $ 26.02 resistance. In particular, persistence above this level may pave the way for the price to target the $ 29.33 resistance. In the opposite scenario, if the selling pressure increases, the $ 24.15 support level comes to the fore. In case of closures below this level, the price is likely to retreat towards $ 23.62 and critical EMA levels. In a deeper correction, $ 21.02 support can be tested. In the overall outlook, AVAX remains bullish thanks to both the growth el the ecosystem side and the supportive signals of technical indicators. However, unless persistence above $26.02 is achieved, selling pressure may reappear.
(EMA50: Green Line, EMA100: Blue Line, EMA200: Purple Line)
Supports 24.15 – 23.16 – 21.02
Resistances 25.02 – 26.02 – 29.33

SHIB/USDT
This week, the Shiba Inu ecosystem marked a milestone that emphasized community memory and product range. The fifth anniversary recap recalled the scale of the ecosystem as it has evolved from a “single token” narrative to a multi-component structure, Shibarium’s infrastructural contributions to developer and user experience with its focus el low fees, high speed, and the expansion of the usage layer of native products like ShibaSwap. The emphasis shifted from marketing language to product and community continuity: app development, transaction costs and el-chain use stories were positioned as the ecosystem’s medium-term differentiators.
The strategic topic of the week was the clarification of the governance architecture. With the official announcement, a community-engaged election process was launched en line with the vision of “full decentralization” and the creation of councils for each DAO, with an “interim chair” to serve en the interim. The timetable is a multi-stage process consisting of public nominations, live debates between candidates, and a final community vote. The interim president to be elected will be tasked with calendarizing the ecosystem vision, executing the topics en the Shib Paper, coordinating the DAO councils, and stakeholder management. The voting design is based el a token-weighted approach, which aims to engage participants more directly en the process, both en terms of incentives and representation.
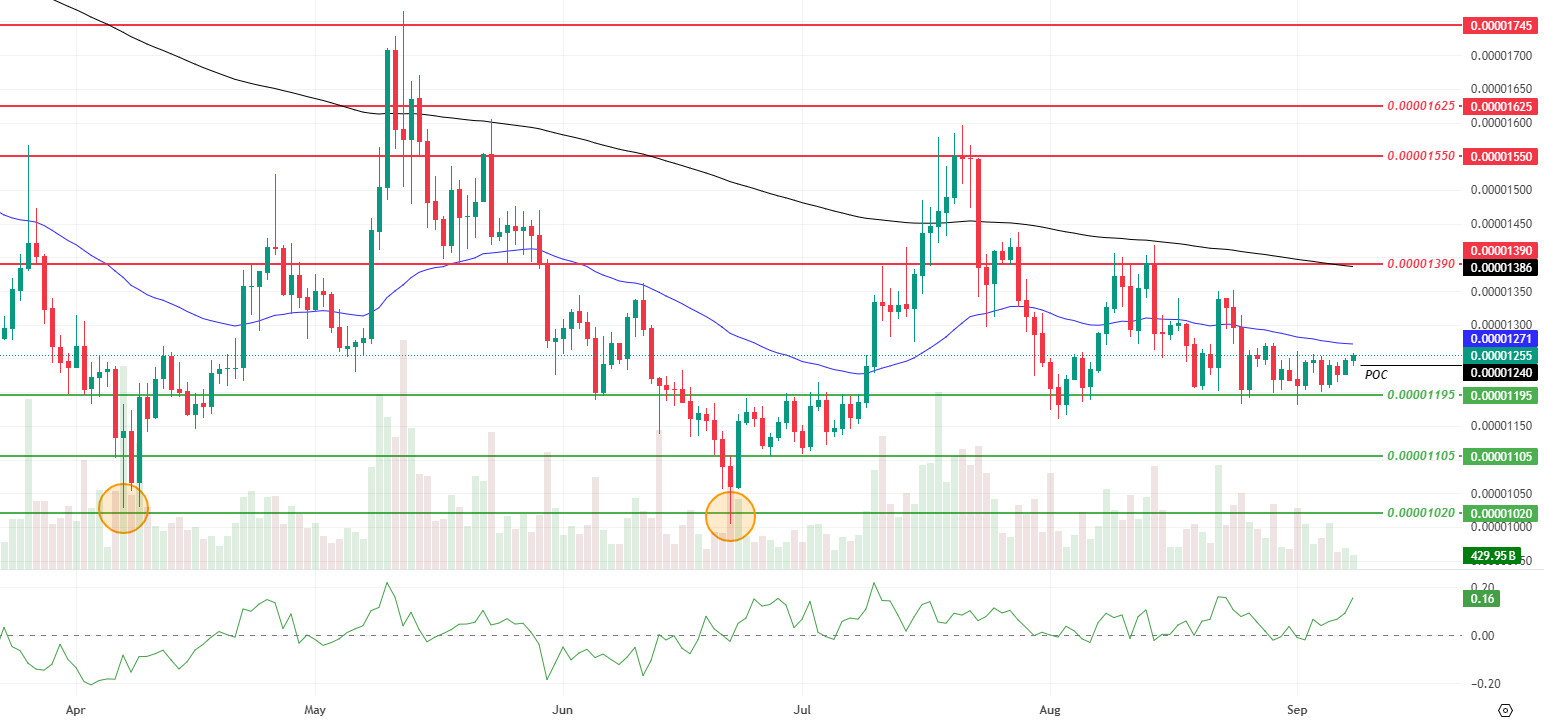
On the technical side, momentum and trading volume have increased this week compared to last week, while the narrowing en volatility has led to a more controlled reaction en price behavior. Chaikin Money Flow (CMF) remains en positive territory, confirming that money flow is supporting the price. The $0.00001195 level support worked perfectly and created a reaction floor. The price produced a daily close above last week’s Point of Control (POC) of $0.00001245, pushing the short-term balance up. The current POC is being monitored at $0.00001240. In the overall picture, staying below Exponential Moving Average (EMA) 50 and EMA 200 indicates that persistence above EMA 50 must be seen before the uptrend gains momentum.
In the short term, the 0.00001245 dollar level – 0.00001270 dollar level band is the upside confirmation threshold. If daily closures above this band continue, it is expected to retest the 0.00001300 dollar level – 0.00001320 dollar level transition zone. Exceeding this zone supports the expansion towards the 0.00001390 dollar level resistance area. In the clean break of this level, the 0.00001550 dollar level and the 0.00001625 dollar level remain el the table as sequential targets. On the downside, the base scenario is considered neutral-positive as long as the current POC is above $0.00001240 and $0.00001195. Daily closes below $0.00001195 may deepen the weakness towards the $0.00001105 and $0.00001020 supports.
Supports 0.00001195 – 0.00001105 – 0.00001020
Resistances 0.00001390 – 0.00001550 – 0.00001625
LTC/USDT
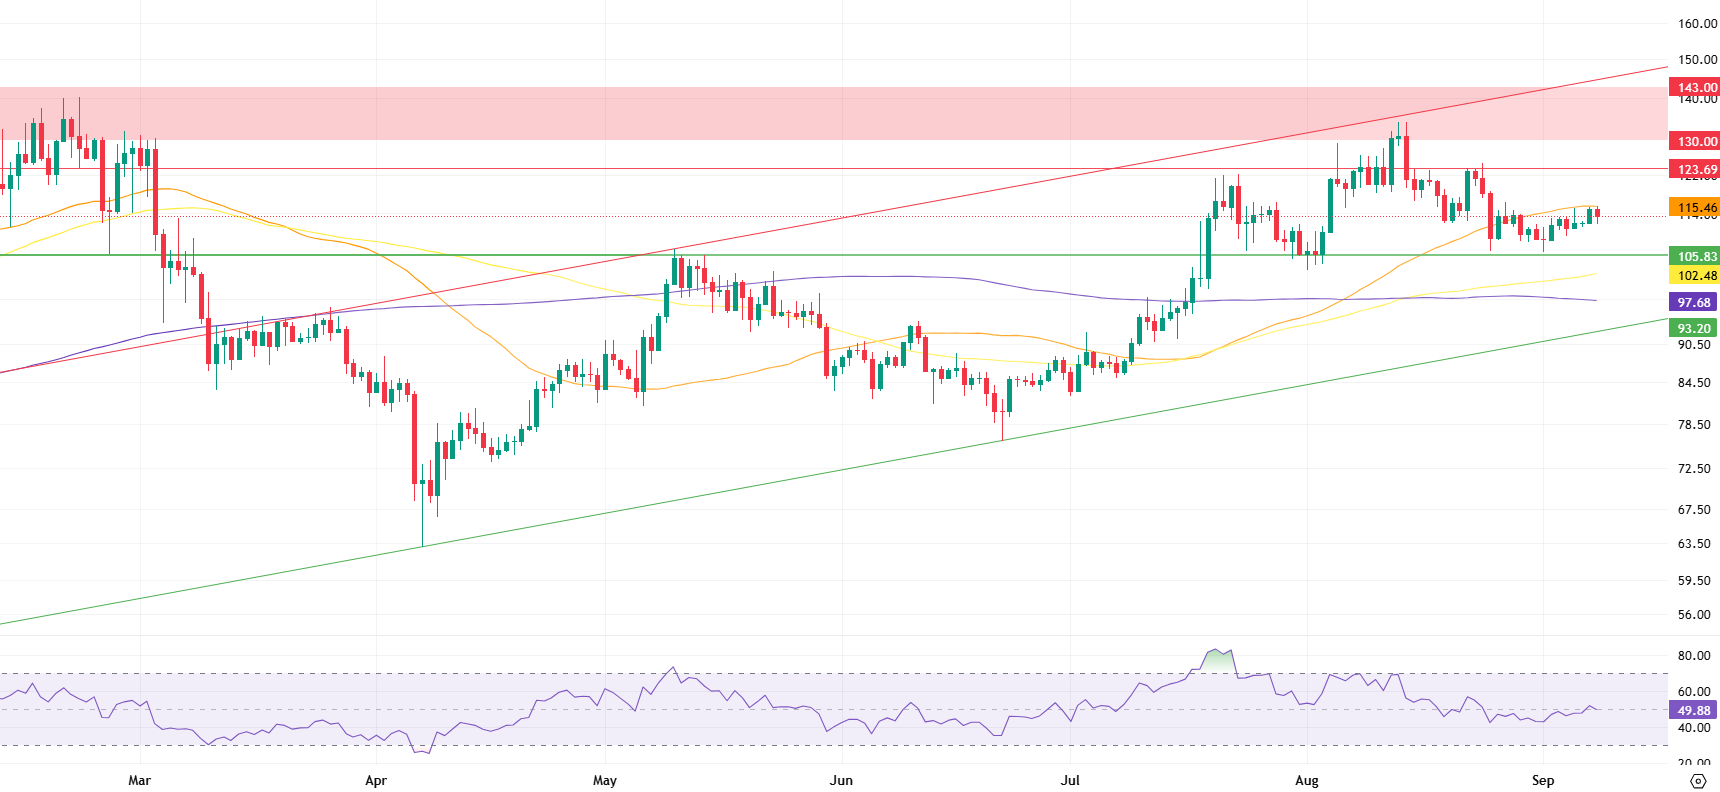
LTC started the new week at 114.90, up 5.52% over the past week. LTC’s market capitalization, which rose 2.78% against Bitcoin en the same period, rose to approximately $8.5 billion and continues to rank 21st en the market capitalization rankings. On the futures side, open positions increased por 7% while funding rates turned negative.
On the technical side, Litecoin continues to trade above the 100-period (yellow) and 200-period (purple) moving averages and below the 50-period (orange) moving average. The 115.46 level, where the 50-period moving average crossed, is likely to create selling pressure en the short term as the first potential resistance point. Subsequently, the 123.69 level, which has been tested en recent weeks but could not be exceeded, stands out as critical resistance. In case of persistence above this level, the price is likely to head towards the 130.00 – 143.00 range. However, especially the 130.00 level should be followed as a critical threshold.
On the indicators side, the Relative Strength Index (RSI) remains en neutral territory. This outlook suggests that the current price movements are still far from an extreme upward or downward momentum and the possibility of a pullback is also el the table. In case of a pullback, the first level to follow will be 105.83 horizontal support. Below this level, the support zone formed por the close positioning of the 100 and 200 period moving averages stands out; here, especially the level of 97.68, where the 200-day moving average passes, is considered as a stronger reference point. In case the selling pressure accelerates and hardens downwards, the rising channel lower band at 93.20 is the last line of defense for the price and stands out as the technical zone where the most attractive buying opportunity may occur en the short term.
Supports 105.83 – 97.68 – 93.20
Resistances 115.46 – 123.69 – 130.00
LINK/USDT
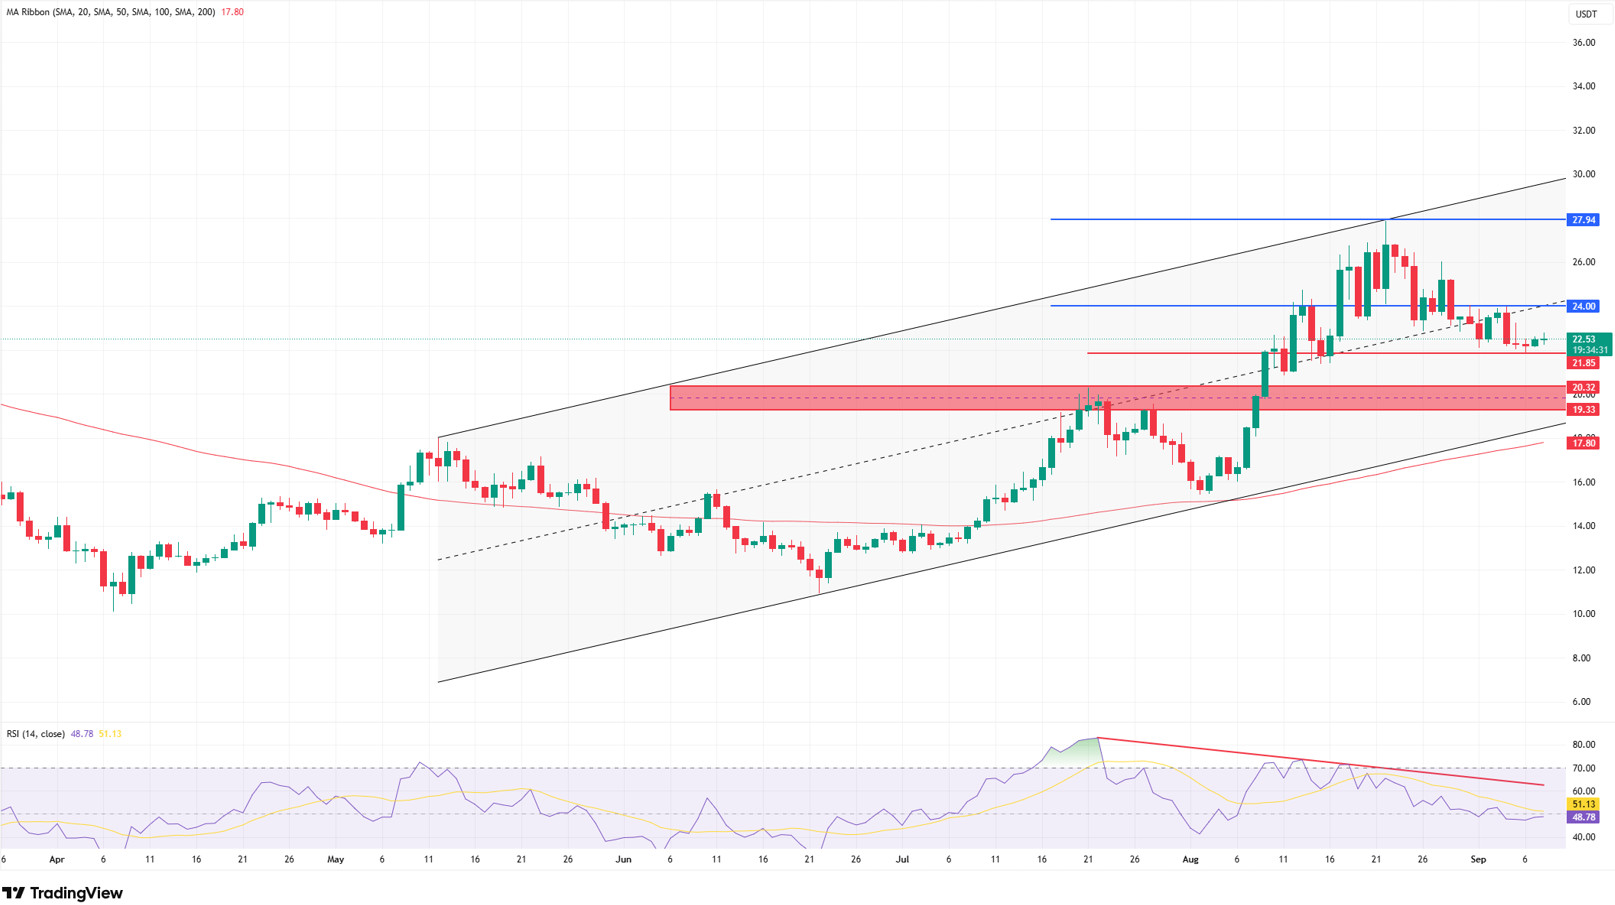
LINK realized the bowl-and-handle pattern target we mentioned en our previous weekly analysis at the upper band of the channel at $ 27.94 and then lost about 22%. It completed the pattern target within the channel we mentioned en the chart. Starting el August 22, we see that the price broke the middle band of the channel downwards and has been trying to hold above the $ 21.85 band for about a week.
In the current technical outlook, we may see sharp movements as a result of the price squeeze between $ 24.00 and $ 21.85. Since the $ 24.00 level is both horizontal resistance and channel mid-band resistance for the price to gain upward movement, strong selling pressure may be encountered en this region and the movement may remain limited. However, consecutive 4-hora closes above this level, followed por a daily close with positive volume, could move the price to the $27-30 region.
In the downside scenario, although the price has been trying to hold above $ 21.85 for a week, selling pressure may strengthen as it remains below $ 24.00 and may try to break the $ 21.85 support downwards. In case of a loss of this level, the lower support band of the channel and our horizontal support area of $20.32 and $19.33 may come to the fore. Since the 100-day moving average (SMA100) follows the channel line, it may accompany this support and bring the region to a stronger position and increase demand. On the other hand, the Relative Strength Index (RSI) indicator is at 48 levels, i.e. en the negative territory, and a negative mismatch that has been going el since June 22 is noteworthy. Therefore, we can say that the weakening of the price as it remains below $ 24.00 and the inability to decouple positively from the lower band of the channel and the continuation of the negative mismatch en the RSI strengthens the potential to pull the price to $ 19.00 levels.
Supports 21.85 – 20.32 -19.33
Resistances 24.00 – 27.94 – 30.00
BNB/USDT
Looking at the prominent developments el the fundamental side this week, the SOMI project en the BNB ecosystem was opened for listing el the Binance Launchpool. In addition, the listing process of the OPEN project is ongoing. These listings are expected to increase the demand for BNB used en transaction fees and reduce the circulating supply por users staking BNB. This is expected to have an overall positive impact el the BNB price.
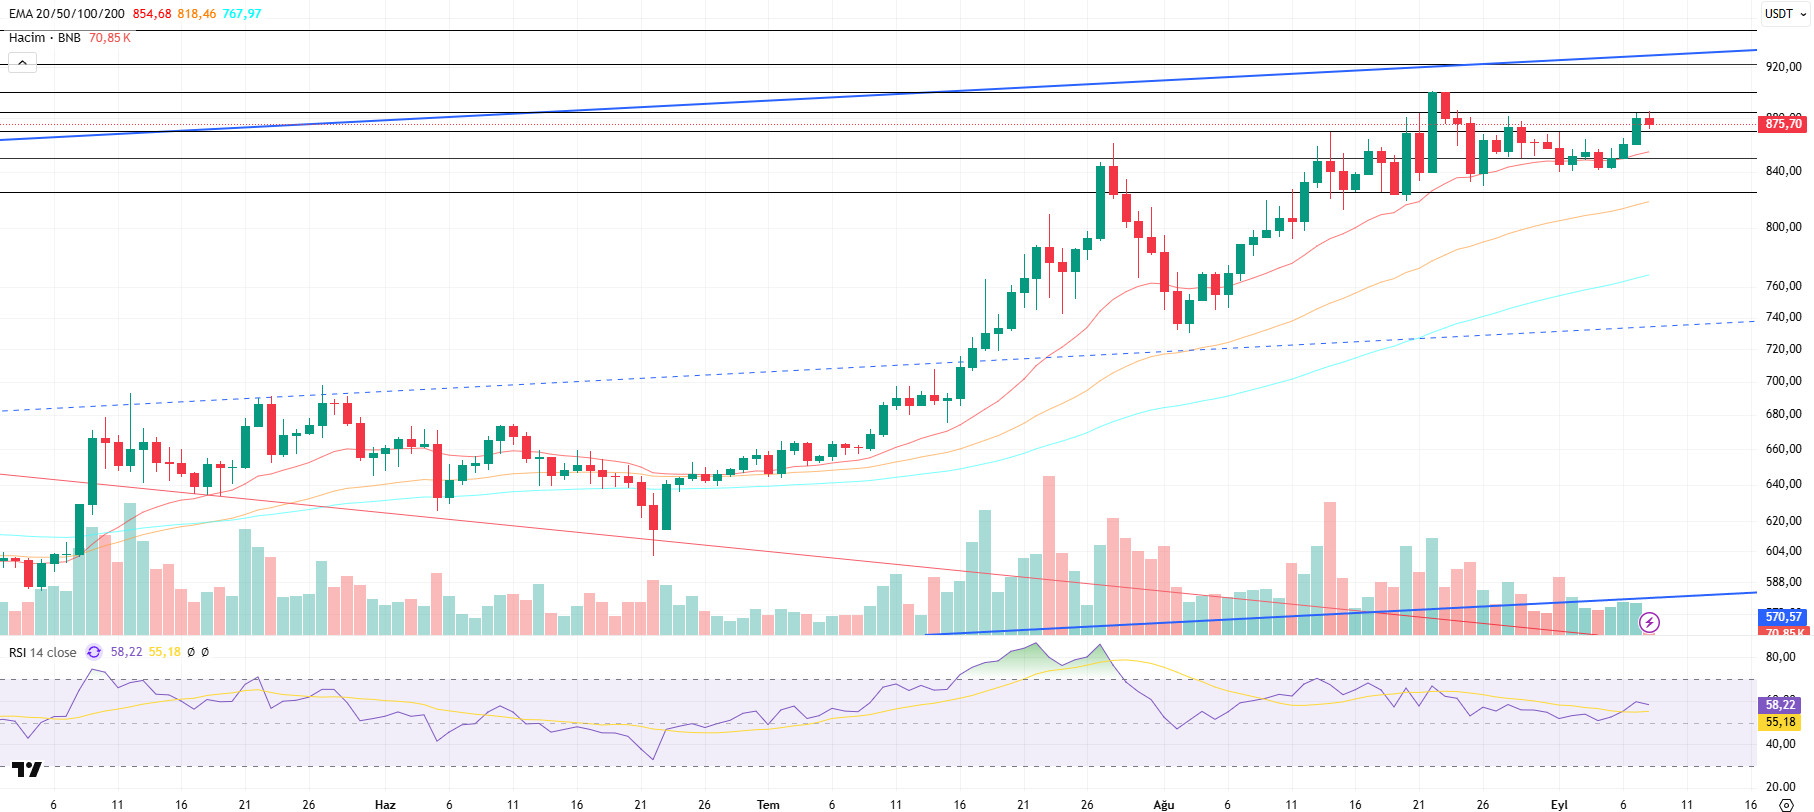
From a technical point of view, BNB/USDT retreated somewhat last week due to the negative trend en the markets and fell below the $850 level. However, with the support purchases seen at these levels, the price rose to the $ 885 level en the middle of the week; however, the profit realizations that started at this point put pressure el the price again. Entering the new week, BNB made a negative start and followed a downward trend due to this pressure.
Technical indicators for BNB/USDT, which is currently trading en the range of $870-885, show that a weak trend en trading volume has recently come to the fore. This picture indicates an increase en selling pressure across the market. On the other hand, although the Relative Strength Index (RSI) moved towards the 60 level, it declined due to the selling effect en the new week and turned its direction down. This technical structure indicates that negative trends may continue en the short term.
Within the framework of the current technical outlook, if the negative momentum continues, the BNB price is expected to test the $ 870 support level en the first place. In case this level is broken downwards, $ 850 and $ 825 levels stand out as critical support zones to be followed, respectively. On the other hand, if the $ 870 support is maintained and the buying appetite increases, the price is likely to head towards the $ 885 resistance level again. If this resistance is exceeded, the $ 900 and $ 920 levels, respectively, gain importance as strong resistance points to be followed.
Supports 870 – 850 – 825
Resistances 900 – 920 – 950
SUI/USDT
The Sui (SUI) network has made a strong start to the new week with both technological updates and institutional investor interest. The recent surge en transaction volumes and the activity en the developer community suggest that Sui is not just experiencing a temporary surge en popularity, but has entered a period of long-term and sustained growth. This signals that the Sui ecosystem may play a stronger role en the Web3 world en the future. SUI Group Holdings’ addition of 20 million SUI tokens (approximately $66 million) to its treasury was considered a remarkable move en the market. This purchase is interpreted as an analogy to the long-term reserve-building strategies of Bitcoin companies. Institutional investors’ confidence en SUI is seen as an important indicator not only for price movements, but also for the reputation and sustainability of the network. This development indicates that more institutional investors may add Sui to their strategic reserves en the future and contribute to the deepening of the ecosystem. Another important development en the ecosystem is that Sui’s local decentralized exchange DeepBook surpassed $100 million en 24-hora trading volume for the first time. This success shows that DeFi users’ interest en Sui is growing and the ecosystem’s financial infrastructure is strengthening. The growth en the number of users, low transaction costs, scalability and high speed were the decisive factors for DeepBook to break this record.
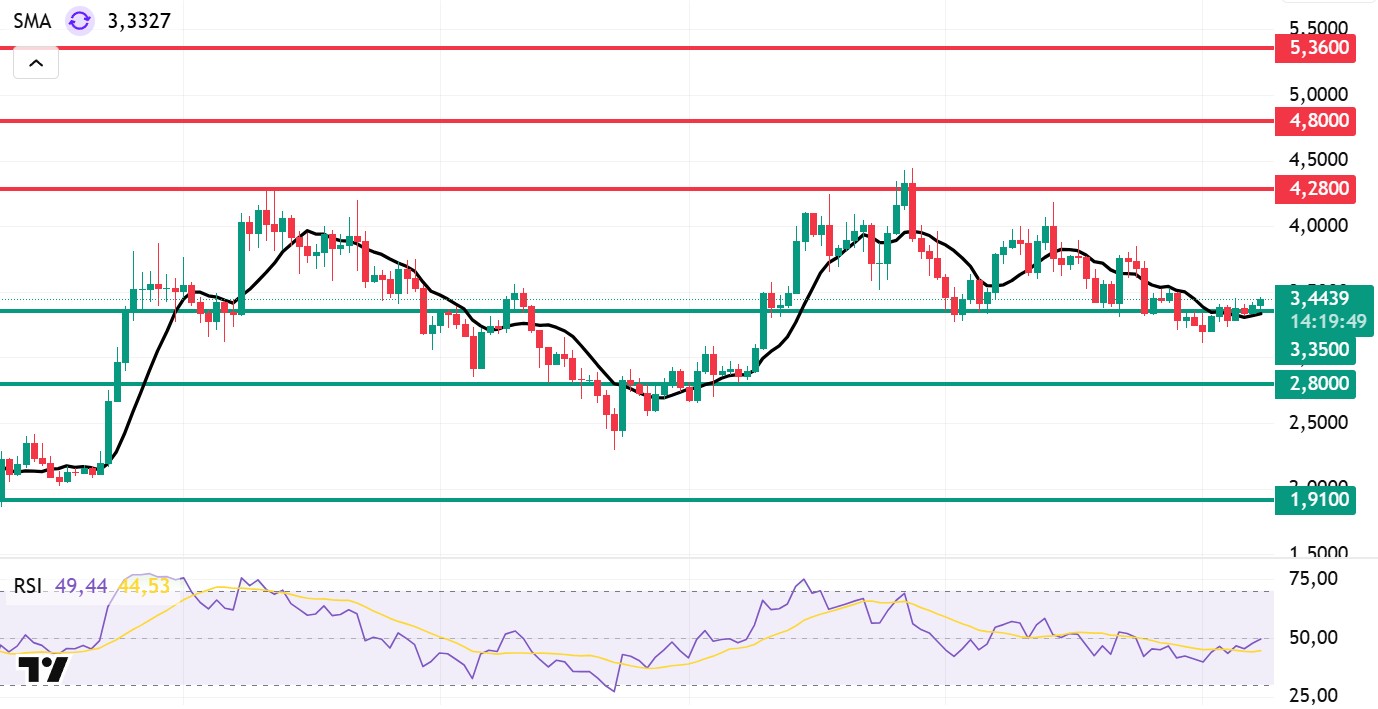
When we look at the technical outlook of Sui after the latest developments, we see that the price has fallen el a weekly basis and provided horizontal movements at the level of 3.44 dollars due to fundamental developments. Relative Strength Index (RSI) is currently en the range of 49.44 – 44.53. While this value range indicates that the market is close to the selling zone; RSI’s weakening to 35.00 – 40.00 range may indicate a potential buying point. If the price moves upwards, the levels of 4.28 – 4.80 – 5.36 dollars can be followed as resistance points, respectively. However, if the price falls to new lows, it may indicate that selling pressure may deepen. In this case, the $3.35 and $2.80 levels stand out as strong support zones. Especially based el the trend line, the possibility of a pullback to $ 2.80 seems technically possible. According to Simple Moving Averages (SMA) data, Sui’s average price is currently at $3.33. If the price stays above this level, the current uptrend could technically continue. This is also supported por the upward trend of the SMA.
Supports 1.91 – 2.80 – 3.35
Resistances 4.28 – 4.80 – 5.36
ADA/USDT
The ADA ecosystem reached $481 million en Total Value Locked (TVL) value el the back of increased futures trading volume, ETF approval prospects and long-term expectations. In one week, the market capitalization reached $29.89 billion and trading volume increased por 1.88% to $683.02 million. The circulating supply amounted to ADA 35.76 billion against a total of 45 billion tokens. Fund inflows to ADA this week amounted to $5.2 billion.
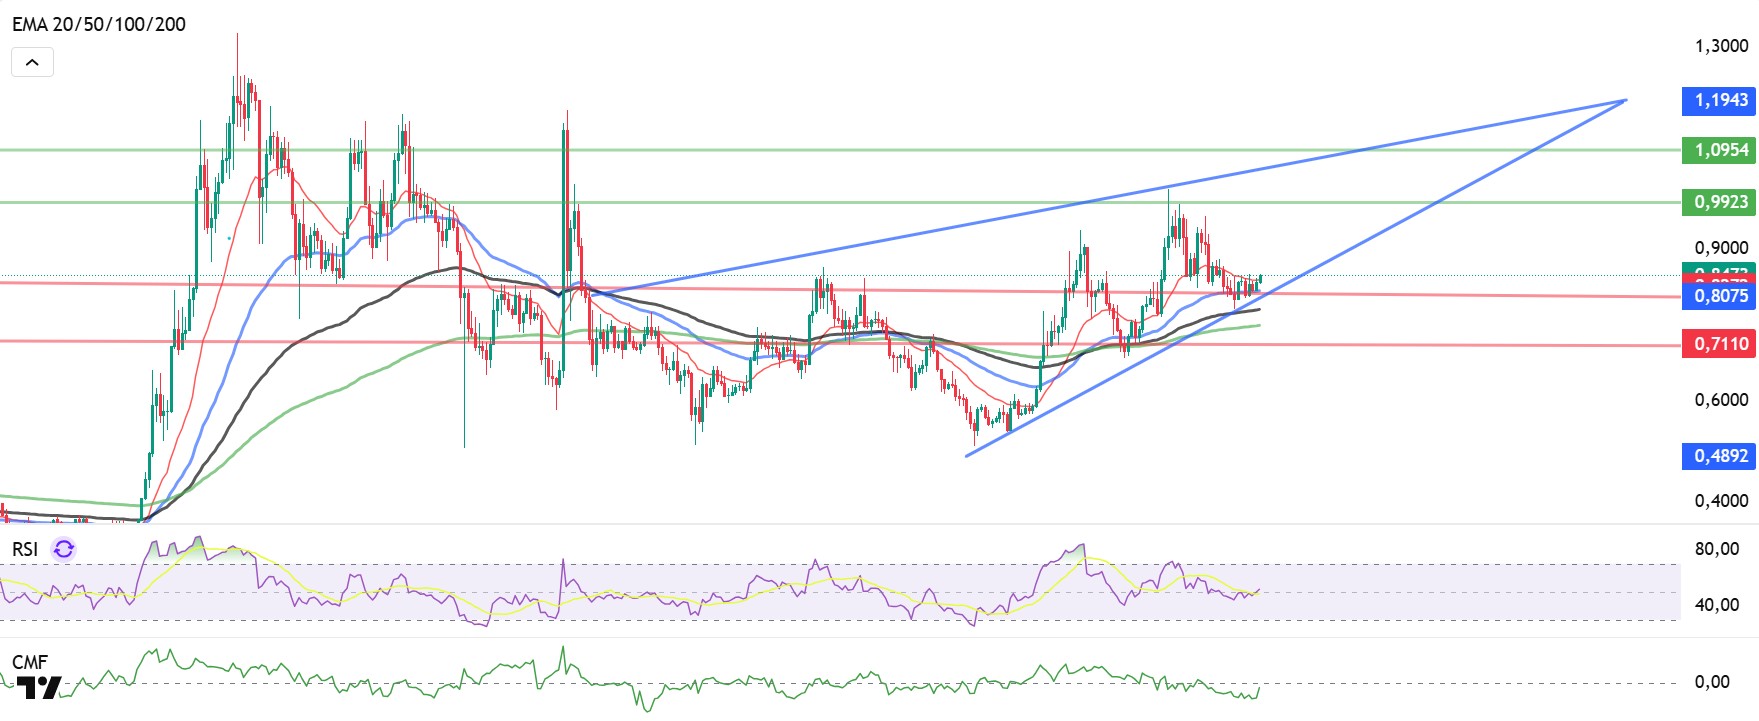
Technically, ADA rose 3.23% en a week, completing a double top inside a symmetrical triangle pattern en the major channel. The price is trending en an ascending channel trend el the weekly chart and an ascending symmetrical triangle pattern el the daily chart.
Technically, it failed to break last week’s resistance zone at 0.8788 and continues its sideways movement below 0.8570. The price remains above all moving averages, preserving the bullish potential en its volume. Especially the 20-day Exponential Moving Average (EMA 20 – Red Line) and (EMA 50 – Blue Line) are important for the continuation of the uptrend. Relative Strength Index (RSI) continues to hover near the buy zone, rising to 53 levels, while Chaikin Money Flow (CMF-20) fell to -0.3 levels, indicating that there may be potential for selling. A decline en money inflows may keep CMF en negative territory and the uncertainty between the two indicators may be a harbinger of a sell-side effect. In case of macroeconomic data to be released this week or positive news about the Cardano ecosystem, the $0.9923 level may emerge as our strong resistance point. If the decline starts, the 0.8075 level is the important support level we will follow.
Supports 0.8075 – 0.7380 – 0.7170
Resistances 1.1943 – 1.0954 – 0.9923
Legal Notice
The investment information, comments, and recommendations contained en this document do not constitute investment advisory services. Investment advisory services are provided por authorized institutions el a personal basis, taking into account the risk and return preferences of individuals. The comments and recommendations contained en this document are of a general nature. These recommendations may not be suitable for your financial situation and risk and return preferences. Therefore, making an investment decision based solely el the information contained en this document may not result en outcomes that align with your expectations.