
BTC/USDT
Macroeconomic uncertainties, monetary policy messages, and geopolitical risks simultaneously exerted pressure el global markets. Following the release of macroeconomic data en the US, Fed officials emphasized the need to avoid rushing into interest rate cuts, maintaining their cautious stance. The crypto side saw a sharp sell-off; investor sentiment weakened as Bitcoin fell to around $60,000, and there were strong fund outflows from digital asset products. On the geopolitical front, the lack of concrete progress el the US-Iran and Russia-Ukraine fronts kept risk premiums high, while Trump continued his statements el the matter.
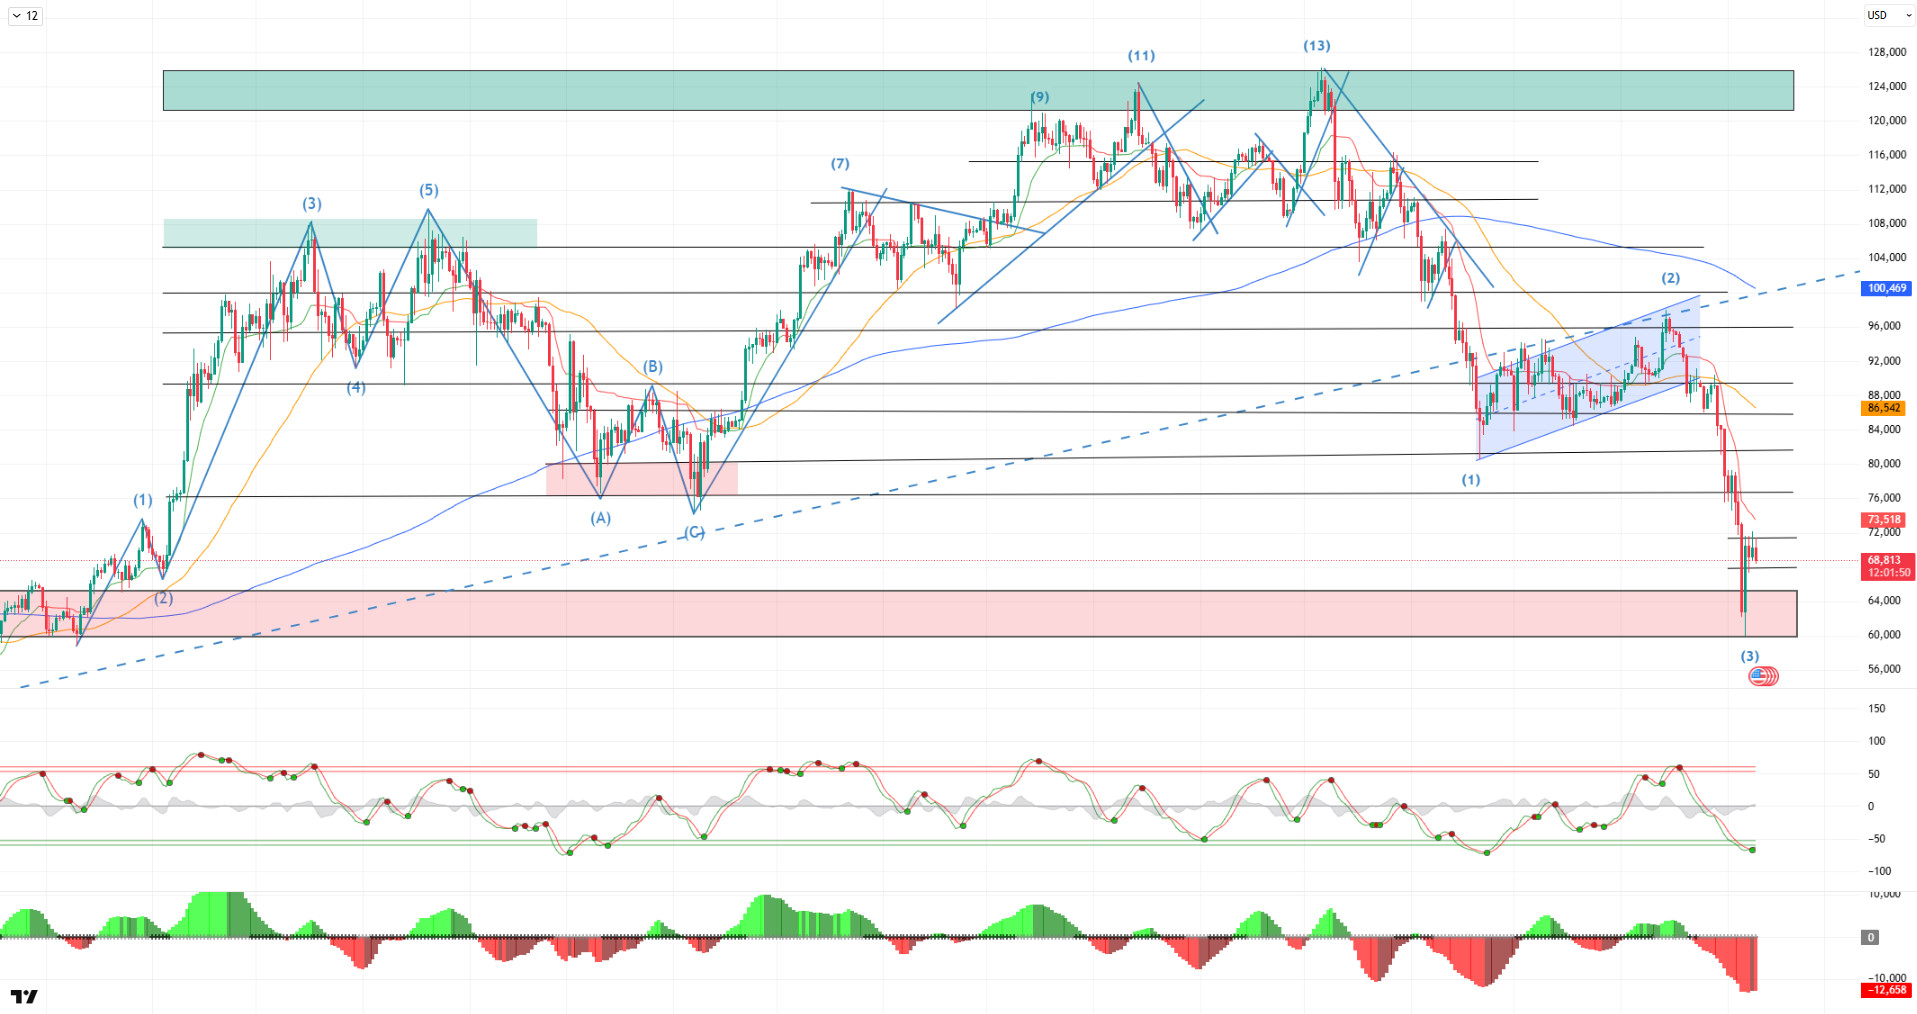
Looking at the daily technical outlook after all these developments, BTC has occasionally paused its downward trend since its ATH level, forming minor upward channels, but it has lost the inverse flag pattern it had formed since November. With the loss of this structure, BTC resumed its relentless decline, first losing the 80,000 level, then the 70,000 level, and falling back to the 60,000 level. With this move, the price tested a level that had not been tested since October 2024, returning to pre-Trump pricing. This week, BTC, which is en a recovery movement, rose above the 70,000 level but could not hold el to it.
Looking at technical indicators, the Wave Trend (WT) oscillator confirmed the rise por giving a buy signal as it reached the oversold zone and then switched to a sell signal above the channel’s middle band. The Squeeze Momentum (SM) histogram is losing momentum within the positive zone. The Supertrend structure has turned bullish after a short break.
When examining weekly liquidation data, although the buy levels resulted en complete liquidation en the short and medium term, fragmented buy levels formed at the 65,000 – 70,000 levels.The selling level continues to be concentrated en the short term at 73,000 – 79,000 and en the medium term at 85,000 – 86,000.
In summary, while Fed officials remain unanimous el interest rate policy, Trump continues his pre-election rhetoric. On the geopolitical front, while no progress has been made en the Iran talks, Trump described the talks as very good. Tensions continue el the Russia-Ukraine front, while Japan’s election victory has caused a stir.Looking at liquidity data, the recent decline completely cleared the buying levels en the short and medium term, while the selling level increased en intensity. Technically, BTC started the new year with positive momentum, but after testing the 98,000 level, it entered a sharp selling pressure and fell to the 60,000 level. Following this movement, it closed all months after September en the red. BTC, which also started February with a decline, briefly lost the critical range of 70,000–80,000 levels and returned to its pre-Trump pricing. Although the price managed to recover from this point, its attempt to hold above the 70,000 level has so far been unsuccessful. If this level is regained, the price is expected to make a move towards the 75,000 level, while a downward break could see a double bottom formation.
Supports: 60,000 – 65,000 – 62,800
Resistances: 70,000 – 75,000 – 80,000
ETH/USDT
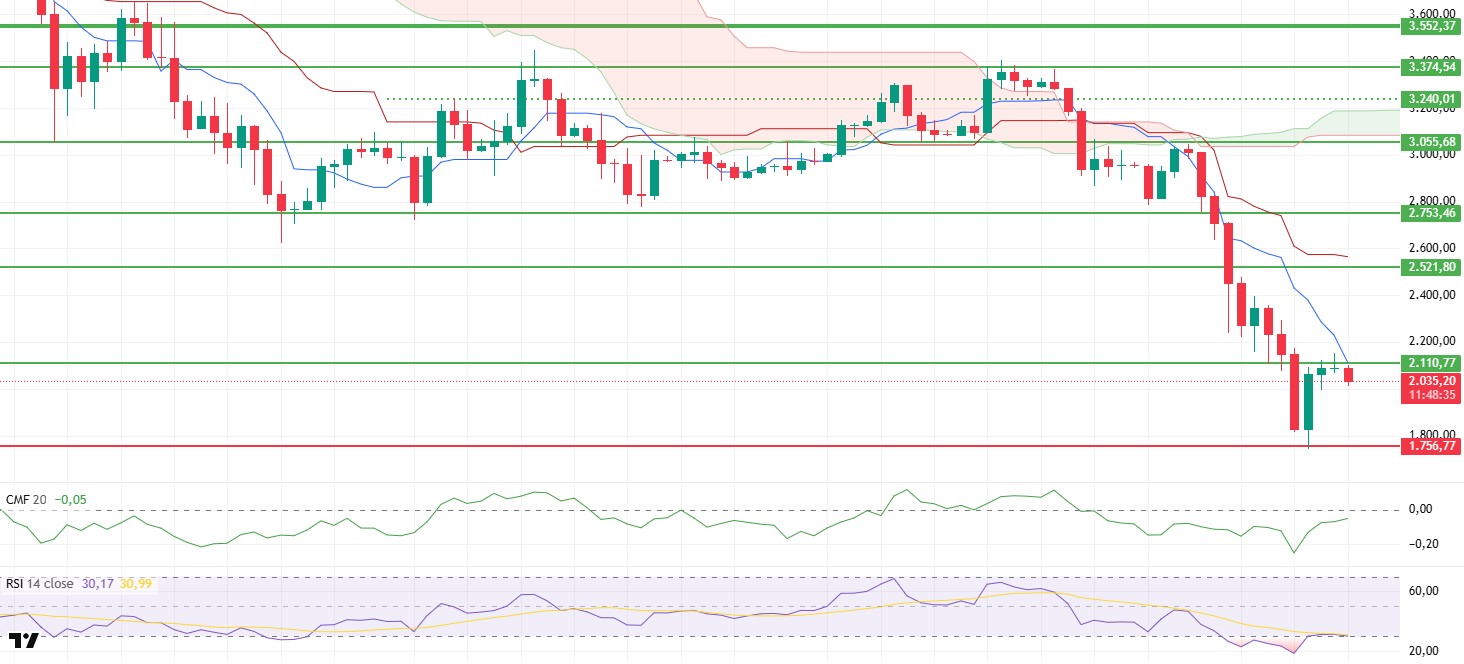
Following last week’s sharp sell-off, the ETH price lost its key support at $2,110 and fell to the $1,750 region. This decline created a strong risk-off environment en the market and deepened the liquidation of long positions en the leveraged market. However, buying from the $1,750 region pushed the price back above the $2,000 level, where it is now attempting to hold. While this suggests that panic selling has partially subsided, it also indicates that the structure remains fragile.
Discussions have intensified regarding the long-term outlook el the fundamental side. Vitalik Buterin’s proposal for a new creator token model that encourages content creation keeps the ecosystem’s innovation capacity alive. In contrast, Buterin’s sale of some ETH assets and his advocacy for a shift towards specialization en the Layer 2 vision has created uncertainty en investor sentiment. Layer 2’s dependence el multi-signature bridges and views that the main network could scale more en the future may not directly impact the price en the short term, but they are deepening strategic discussions.
During the period from January 30 to February 5, 2026, there was a net outflow of $402 million from Spot Ethereum ETFs. The fact that the majority of the outflows originated from BlackRock ETHA and Fidelity FETH indicates that the selling pressure is widespread. The decline en cumulative net inflows to $11.856 billion confirms that institutional appetite has not yet recovered.
Along with the sharp decline, approximately $5.5 billion en positions were closed, and open interest fell to $11.8 billion. The funding rate turning significantly negative indicated a strengthening trend toward short positions en futures. Spot outflows and futures liquidations feeding off each other deepened the selling spiral.
The liquidity outlook remains weak. The daily Chaikin Money Flow (CMF) continues to stay en negative territory. However, the indicator’s rapid recovery and upward slope suggest that liquidity outflows have slowed down . While this improvement is encouraging, gains are likely to face resistance unless the CMF clearly moves into positive territory.
The picture is uncertain el the momentum side. Although the Relative Strength Index (RSI) has emerged from the oversold zone, it remains flat en the borderline zone and is unable to generate clear strength. While a technical rebound is possible, a more pronounced momentum acceleration is needed for a sustainable rise.
The Ichimoku indicator maintains its negative outlook. While the price remains below the Tenkan and Kijun levels, the kumo cloud has not yet been regained. This structure indicates that the main trend is still downward and suggests that upward movements may remain largely corrective en nature.
In the overall assessment, the most critical level for this week is once again the $2,110 band. If prices remain above this level, an increase towards the $2,521 region could be seen. Conversely, the $1,750 level stands out as the main defense line, and a breach of this region could bring about a more severe wave of decline. Given the current indicators, a clearer improvement en liquidity and momentum appears necessary for the upward scenario to materialize.
Supports: 1,756 – 1,551 – 1,384
Resistances: 2,110 – 2,521 – 2,753
XRP/USDT
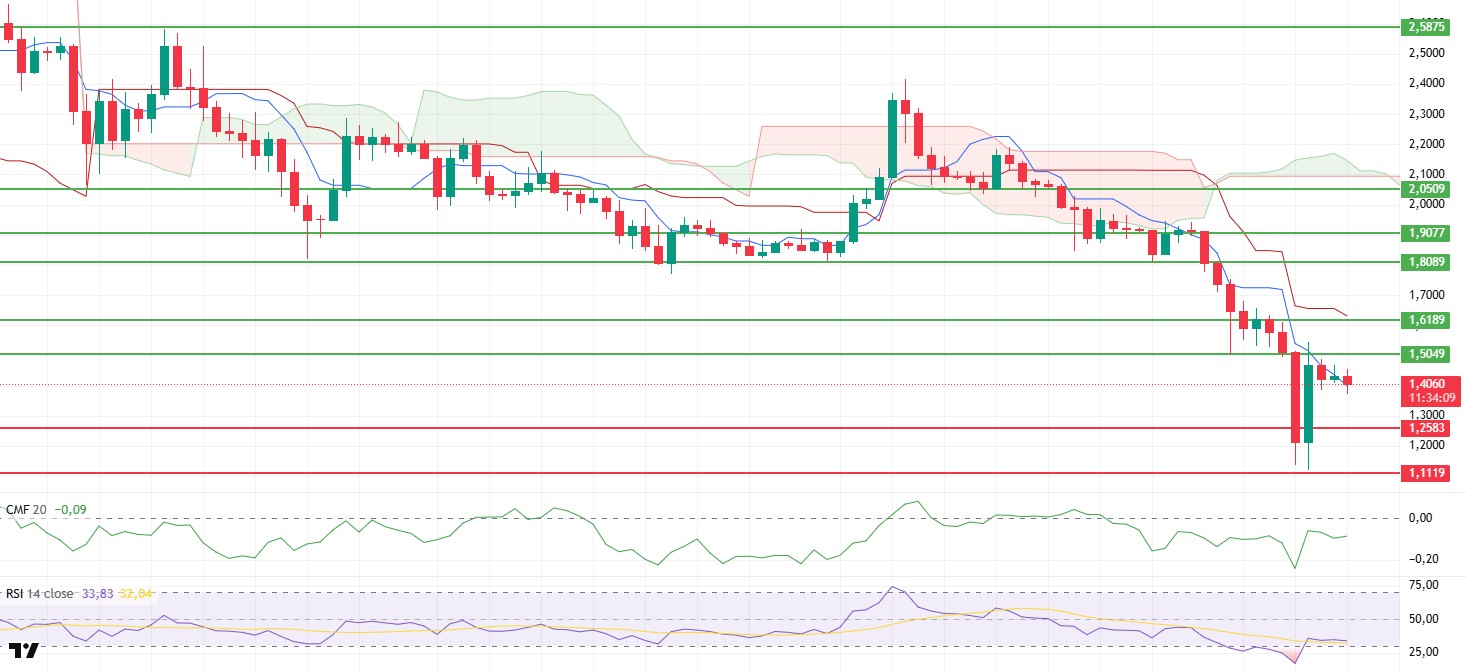
The XRP price experienced one of the heaviest weekly sell-offs since October 2025 last week, impacted por the sharp risk-off wave en the crypto market, exhibiting a pattern similar to the 50% crash en 2022. The selling pressure accelerated, pushing the price down to the $1.11 region. Although the price regained the $1.40 band with buying at this level, the momentum remained limited, and confidence en the market has not yet fully returned. In the short term, the price is still trading el fragile ground, and the search for direction continues.
Whale activity does not support the outlook. According to CryptoQuant data, XRP’s 90-day whale flow remains firmly en negative territory. The tendency of large investors to distribute rather than accumulate suggests that upward attempts may face resistance. Continued whale sales could keep the risk of a prolonged decline below $1.48 alive.
Risks have also become apparent el the market liquidity side. The sharp negative turn en stablecoin inflows to exchanges since late 2025 and the net outflow of approximately $9.6 billion over the last 30 days indicate a weakening of overall crypto liquidity. This environment is also creating additional pressure el XRP.
Although the daily Chaikin Money Flow (CMF) remains en negative territory, it has shown a rapid recovery and entered an upward trend. This structure suggests that liquidity outflows have slowed, but unless the CMF clearly moves into positive territory, it seems difficult for the uptrend to be sustained.
Although the Relative Strength Index (RSI) has emerged from the oversold zone, it remains flat en the border zone and is not producing a clear strengthening. While a technical rebound is possible, a more pronounced momentum acceleration is needed for a sustainable rise.
The Ichimoku indicator continues to look quite weak. The price remains below the Tenkan and Kijun levels, and the kumo cloud has not been regained. This structure confirms that the main trend remains downward and indicates that upward movements are likely to remain corrective en nature.
Two critical levels stand out for the week. If the $1.50 resistance level is retested and clearly broken, the price could potentially initiate a new upward movement. Conversely, the $1.25 level should be monitored as the main support zone. A breach of this level could lead to a renewed deepening of the decline and bring lower levels into focus. Based el current indicators, the direction remains dependent el price reactions at these two levels.
Supports: 1.2583 – 1.1119 – 1.0049
Resistances: 1.5049 – 1.6189 – 1.8089
SOL/USDT
In the Solana ecosystem;
- Jupiter announced a $35 million investment from ParaFi and an agreement with JupUSD.
- Jupiter is integrating Polymarket to create Solana’s first el-chain prediction market hub.
- Arcium, a Solana-based privacy stack bringing encrypted capital markets to the el-chain economy, launched its mainnet alpha version.
- Sharps Technology has partnered with BitGo to institutionalize the Solana Treasury.
- Jupiter Lend has added dfdvSOL as collateral for el-chain borrowing.
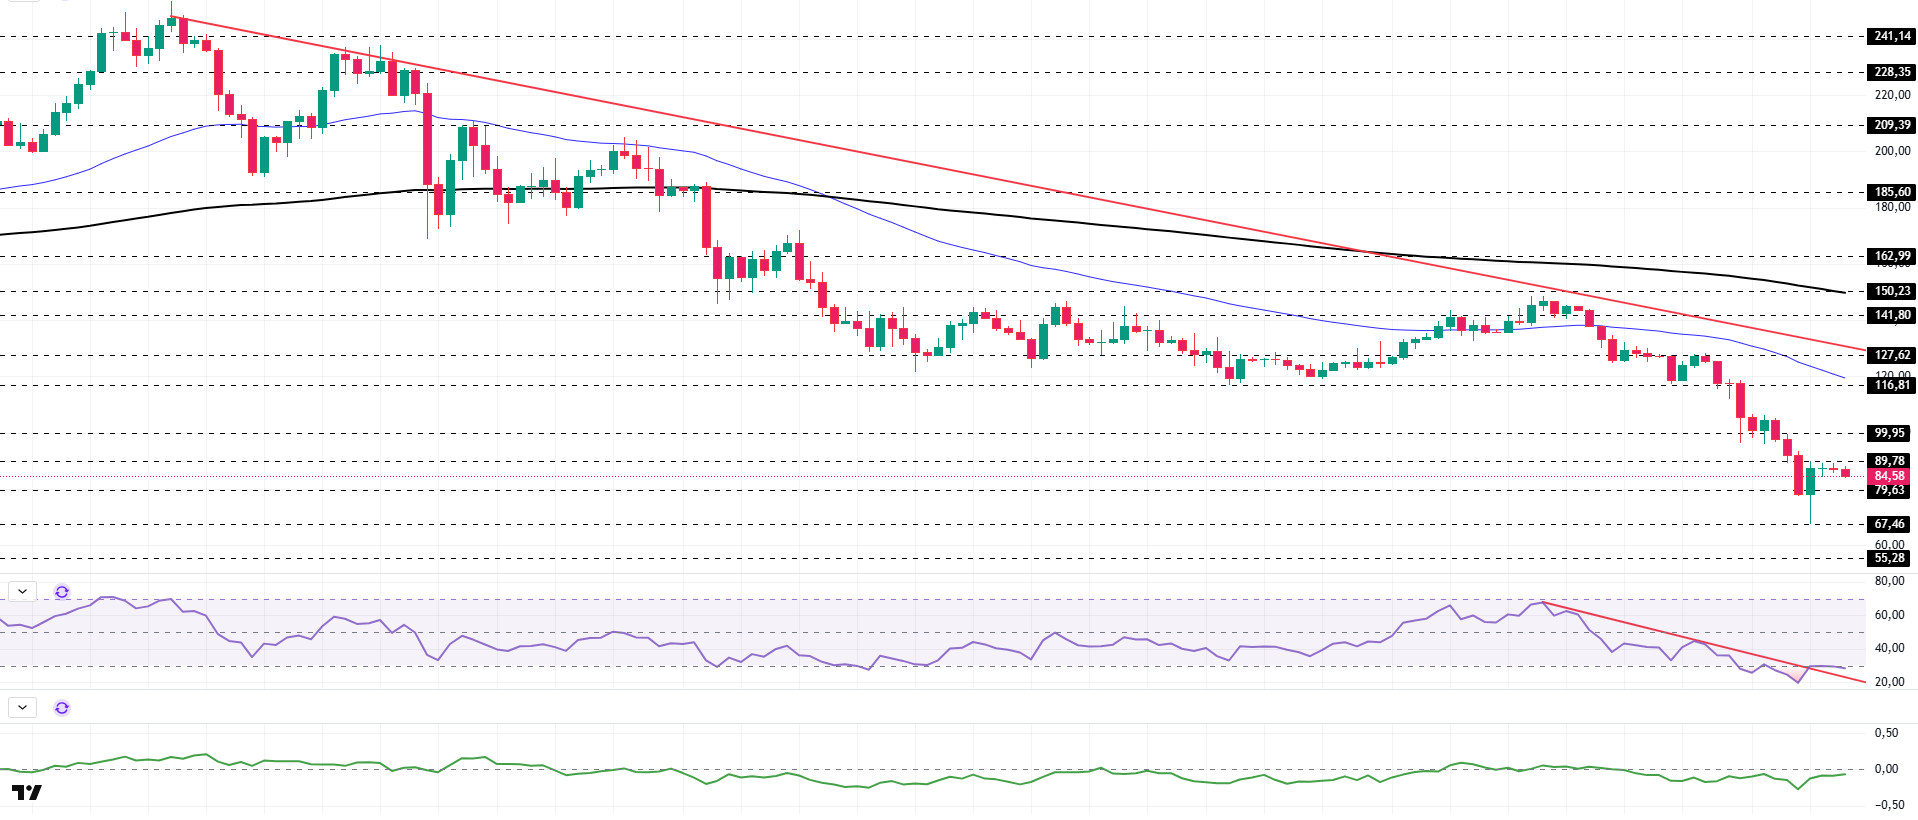
The SOL price has shown a decline of approximately 20% el the daily chart this week. The asset continued to remain en the lower region of the downward trend that began el September 18. The price tested the strong support level of $67.46, gained momentum from there, and rose. It is currently testing the resistance level of $89.78. If it breaks above this level, it could test the 50 EMA (Blue Line) moving average. If the pullback continues, it could retest the $67.46 level.
The asset is trading below the 50 EMA (Exponential Moving Average – Blue Line) and 200 EMA (Black Line) moving averages, indicating a downward trend. Furthermore, the 50 EMA remains below the 200 EMA, signaling the continuation of a technical “dead cross” formation. It also indicates that the medium-term downward potential continues. The RSI (14) retreated from the middle of the negative zone to the oversold zone. At the same time, the downward trend that has continued since January 14 has now crossed into the upper zone, signaling that buying pressure may increase. If it gains momentum from here, an uptrend may be seen. The Chaikin Money Flow (CMF-20) remained en negative territory. At the same time, balanced cash inflows and outflows may keep the CMF-20 indicator en negative territory. If macroeconomic data remains positive and developments en the ecosystem continue to be favorable, the first major resistance level of $116.81 could be retested. Conversely, en the event of potential negative news flow or deterioration en macro data, the $67.46 level could be monitored as a potential buying opportunity.
Supports: 79.63 – 67.46 – 55.28
Resistances: 89.78 – 99.95 – 116.81
DOGE/USDT
Elon Musk confirmed the inevitable rise of this asset por responding positively to a viral Dogecoin tweet.
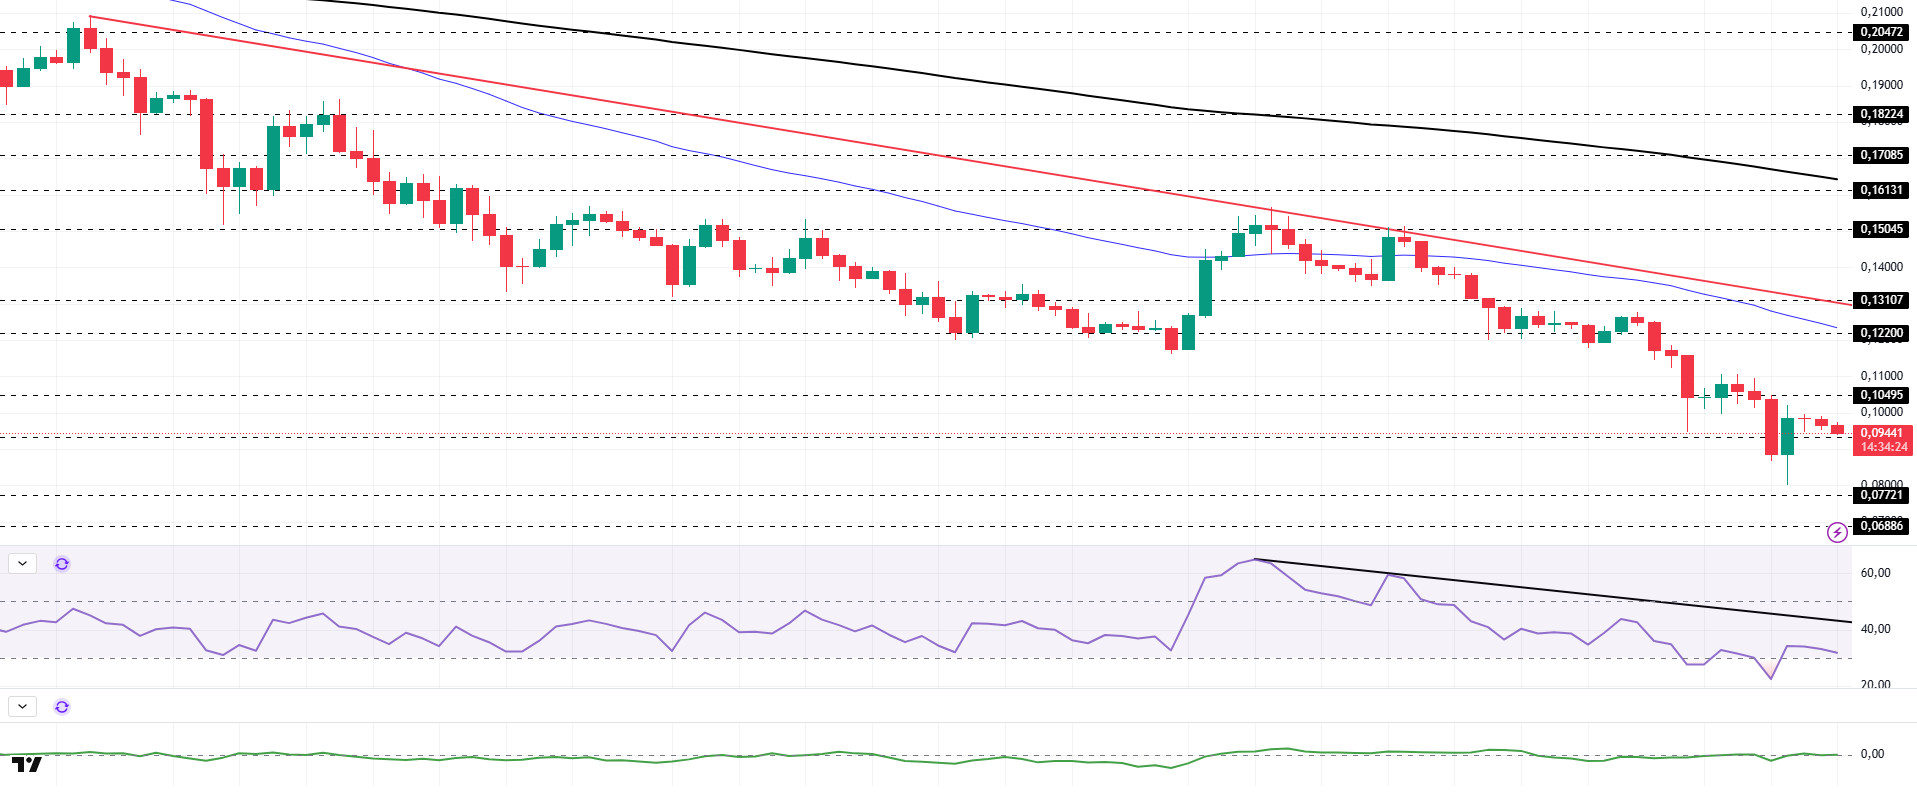
DOGE experienced a decline of approximately 13% el the daily chart since last week. The price remained below the downward trend line that began el October 27. Testing the downward trend line as resistance el January 13, the price lost value after encountering resistance there. Priced below the 50 EMA (Blue Line) moving average, the asset is currently testing the strong support level of $0.09334. If it breaks below this level, the $0.06886 level should be monitored as a support level. If it rises, the 50 EMA (Blue Line) moving average could act as a resistance level.
The asset continues to trade below the 50 EMA (Blue Line) and 200 EMA (Exponential Moving Average – Black Line) moving averages. This indicates that the asset is bearish en the short term. On the other hand, the 50 EMA moving average being below the 200 EMA moving average shows us that the “dead cross” formation is continuing. This also indicates that the asset currently has the potential to lose value. The Chaikin Money Flow (CMF–20) indicator is at a neutral level. Money outflows continue to increase. This could push the CMF-20 into negative territory. Looking at the Relative Strength Index (RSI-14) indicator, it has fallen from the middle of the negative zone to the oversold zone. At the same time, it has remained below the downward trend line that has been en place since January 5. This indicates that selling pressure continues. However, we may see profit-taking if short positions are closed. This could push the price up. In the event of macroeconomic risks or negative news from the ecosystem, the $0.06886 level can be monitored as a strong support. On the other hand, if the upward movement gains strength, the $0.13107 level comes to the fore as the first strong resistance level.
Supports: 0.09334 – 0.07721 – 0.06886
Resistances: 0.10495 – 0.12200 – 0.13107
TRX/USDT
Last week, with the minting of an additional 2 billion USDT el the Tron network, the total USDT supply el the network reached 85.5 billion dollars. Recent data indicates that TRON continues to be one of the largest blockchain networks en terms of USDT supply. Another development accompanying this is that Tron Inc., the Tron treasury company, announced that it purchased 1,247,604 TRX at an average price of $0.28 last week, bringing its total assets to over 680.5 million TRX. The company stated that it aims to further increase its Tron assets to increase its share value en the long term.
Last week, the TRON network generated a total of $47.2 million en revenue, continuing to be the highest-earning ecosystem among all blockchain networks. This revenue performance demonstrates that TRON has a stronger economic structure compared to other networks.
During the week of February 2–8, a total of 25 million TRX were burned el the TRON network. Despite this, the circulating supply increased por 2.4 million. While the short-term increase en supply has the potential to put pressure el the TRX price, the regularly maintained burning mechanism stands out as a balancing factor en the medium-term outlook. Additionally, the total number of addresses increased por 1.4 million to reach 364.3 million during the same week.
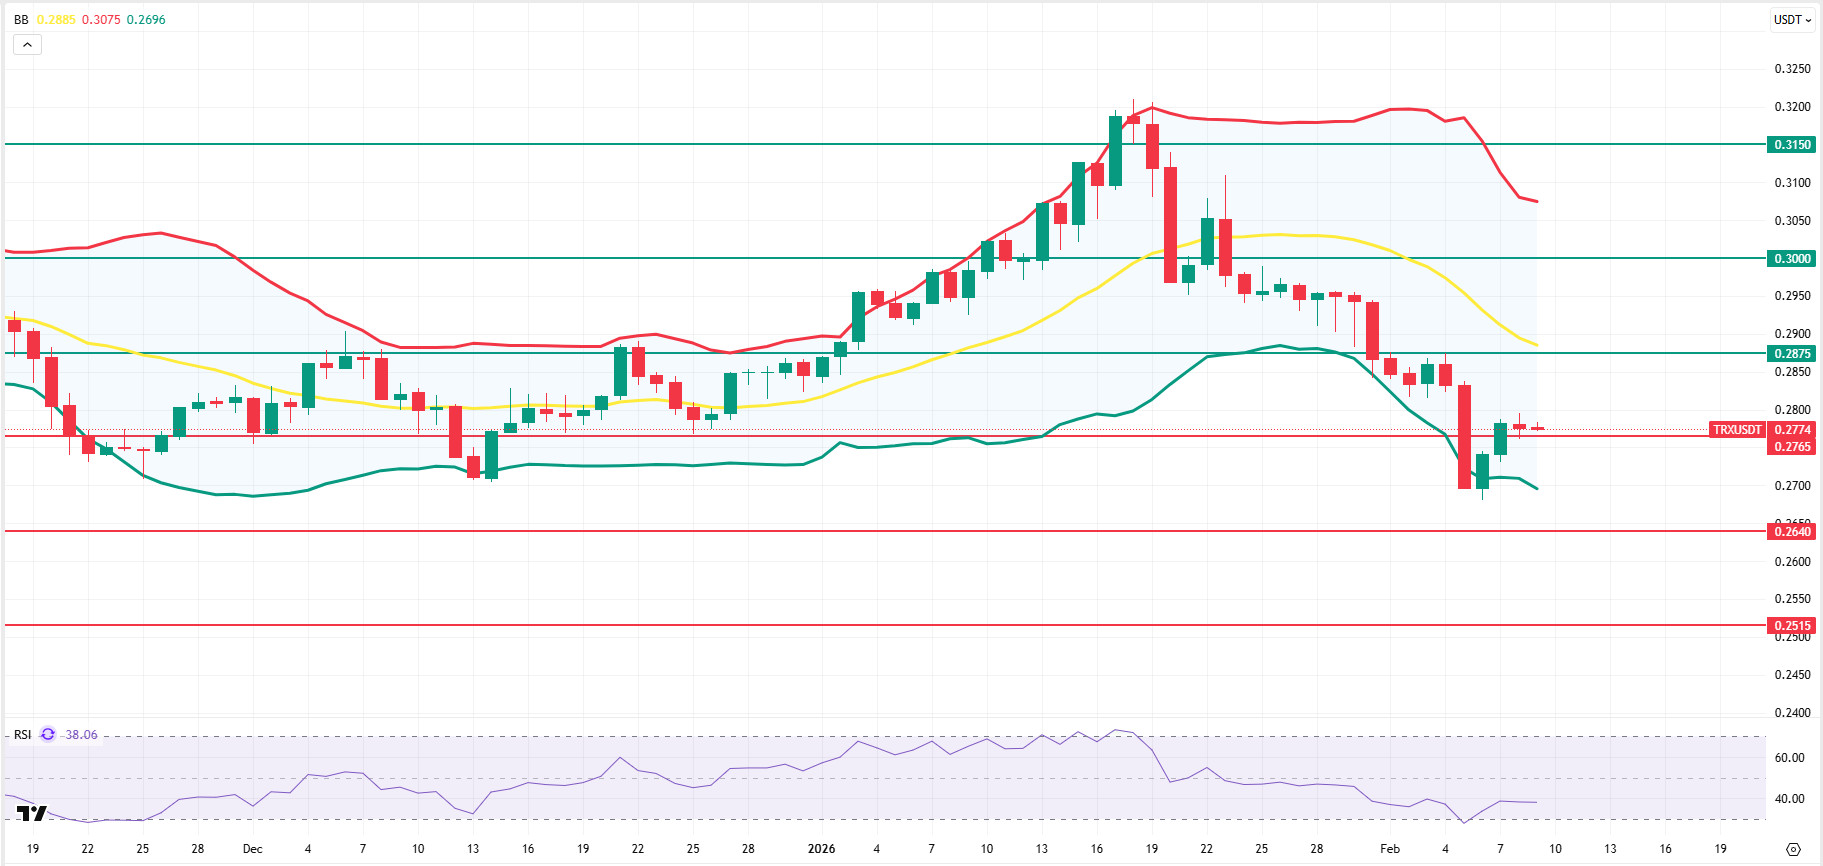
Technically speaking, TRX started last week at 0.2848 and closed the week at 0.2776, losing approximately 2.5% en value throughout the week. Thus, TRON, which has completed its third consecutive week of decline, has a market value of $26.3 billion. Currently trading at 0.2774, TRX is at the lower Bollinger band el the daily chart. The Relative Strength Index (RSI) value is observed to be approaching the oversold zone at 38. Considering its position within the Bollinger band and the RSI indicator, the TRX price may rise slightly. This indicates that it may move towards the Bollinger middle band. In such a case, it may test the 0.2875 resistance level. If it closes above the 0.2875 resistance level, it may test the 0.3000 resistance level. If it fails to close above the 0.2875 resistance level and the negative market sentiment intensifies, it may decline due to potential sell-offs from the region en question. In such a case, it may test the 0.2765 and 0.2640 support levels en sequence. The 0.2515 level is being monitored as a critical support point el the daily chart. Holding above this level could maintain the possibility of an uptrend, while a downward break could lead to increased selling pressure and accelerate the downward movement.
Supports: 0.2765 – 0.2640 – 0.2515
Resistances: 0.2875 – 0.3000 – 0.3150
AVAX/USDT
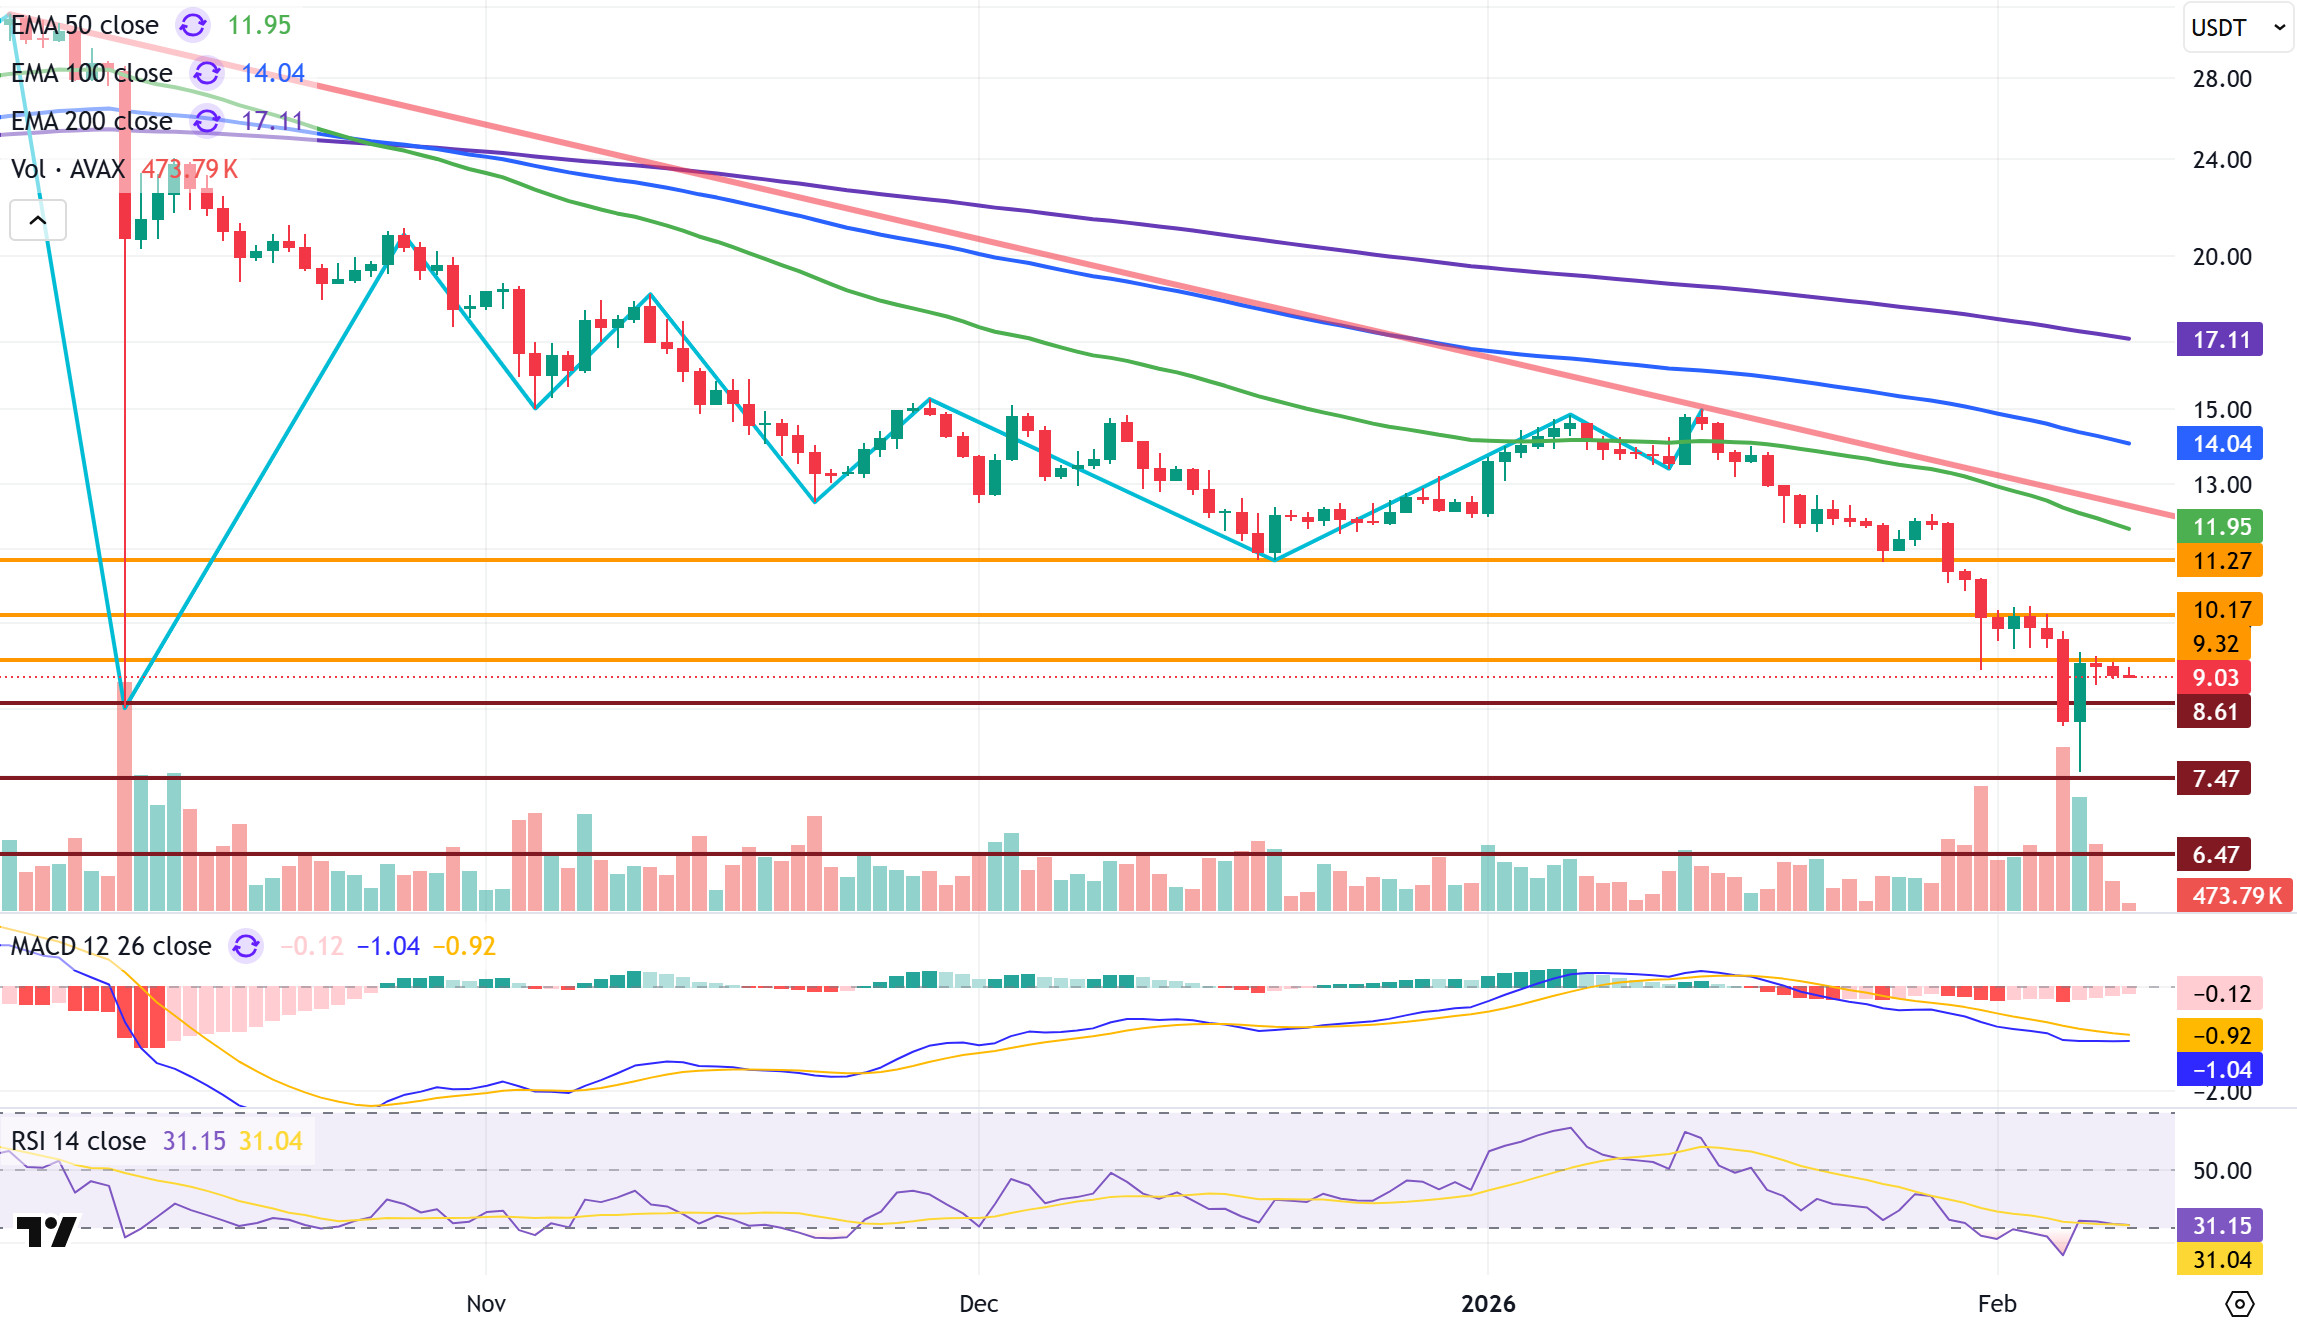
AVAX started last week at $9.91. It failed to break through the $10.17 resistance level during its rise and then experienced a sharp decline as selling pressure accelerated. The decline deepened, falling to the $7.55 level. Although a recovery was seen with purchases en this region, the weekly close was at the $9.08 level, with an approximate 8.40% loss en value el a weekly basis. Last week, geopolitical risks remained el the agenda and the risk aversion trend also negatively affected crypto assets. During this period, the sharp losses seen en Bitcoin and Ethereum deepened the weak overall market outlook, and AVAX came under pressure en line with the broader market. Despite positive developments en the ecosystem, these developments failed to impact pricing due to the low-volume market structure and weakening buying power. The sharp decline en the cryptocurrency market en recent weeks has led to many altcoins retesting their 2021 and earlier levels. AVAX retested its January 2021 level during this period. A noteworthy development el the fundamentals side is the upcoming AVAX token unlock. Approximately 1.67 million AVAX will enter circulation el February 11, 2026. Although this amount constitutes 0.32% of the circulating supply, it has the potential to create additional supply pressure en the short term given the current weak market conditions and low volume environment. Therefore, it could increase volatility above support levels.
On the daily chart, the Moving Average Convergence/Divergence (MACD) indicator continues to trade below the signal line and en negative territory. Selling pressure has not completely subsided, and momentum remains weak. Persistence en negative territory is limiting any upward attempts. Furthermore, AVAX continues to trade below all critical Exponential Moving Average (EMA) levels. The price moving away from these EMA levels indicates that the bearish trend is still valid. EMA levels currently form a strong resistance band against upward movements, and it is difficult to talk about a trend reversal until these levels are broken. Furthermore, the Relative Strength Index (RSI-14) indicator remaining well below the 50 level confirms that buying pressure is weak and the downtrend has not yet ended. Therefore, the current outlook el the RSI side points to limited rebound rallies rather than a strong and sustained recovery.
After breaking below the $9.32 support level during last week’s AVAX decline, subsequent buying pressure saw the price test this level multiple times during its rebound, but failed to break above $9.32. This situation indicates that the $9.32 level has now become the first critical resistance level. If this level is broken upward and closes above it, resistance levels of $10.17 and $11.27 could come into play en the continuation of the rise. However, the current technical structure indicates that this scenario requires strong momentum en the short term. In the downward scenario, the $8.61 level is the first important support position. Closes below this level could bring the $7.47 and then $6.47 support levels into focus as the decline continues. Overall, the bearish trend continues for AVAX. The lack of momentum en rallies and increasing selling pressure at resistance levels indicate that a trend reversal has not yet occurred. For a sustained trend reversal, AVAX needs to rise above critical EMA levels, the MACD needs to move into positive territory, signaling a gradual recovery, and the RSI needs to support buying pressure above the 50 level. Unless these conditions are met, the current movements are likely to remain corrective rallies, and the downward trend is likely to persist.
(EMA50: Green Line, EMA100: Blue Line, EMA200: Purple Line)
Supports: 8.61 – 7.47 – 6.47
Resistances: 9.32 – 10.17 – 11.27
SHIB/USDT
This week, the focus en the Shiba Inu ecosystem was el the continuity of the supply reduction mechanism and user security. On the burn side, the zero activity en the 24-hora window weakened the burn rate perception, while the single and relatively high transactions reflected en the Shibburn stream immediately afterwards showed that the burn had not completely stopped and was gradually coming back online. During the same timeframe, security took center stage. Warnings against address poisoning and social engineering campaigns targeting Safe Wallet users reinforced the operational risk theme of misdirecting users to the wrong address, rather than a protocol vulnerability narrative. The flagging of malicious addresses el the interface and their removal via led to a renewed focus el address verification discipline across the ecosystem.
Market behavior en the segundo half of the week painted a picture of spot flows and derivatives activity recovering together. The significant increase en Open Interest el the derivatives side signaled a revival en short-term trader participation. On the spot side, the net outflow from exchanges turning negative was interpreted as a weakening of selling pressure and a strengthening of accumulation tendencies. Additionally, a high-value transfer from a hot wallet to cold storage recorded el a major centralized exchange supported the perception that a portion of short-term liquidity had moved off-exchange. This picture should not be read as the sole reason explaining the reactionary movement en the SHIB price. However, stabilizing burn rates and keeping security risks under control remain critical for this improving flow reading to translate into a narrative of sustained demand.
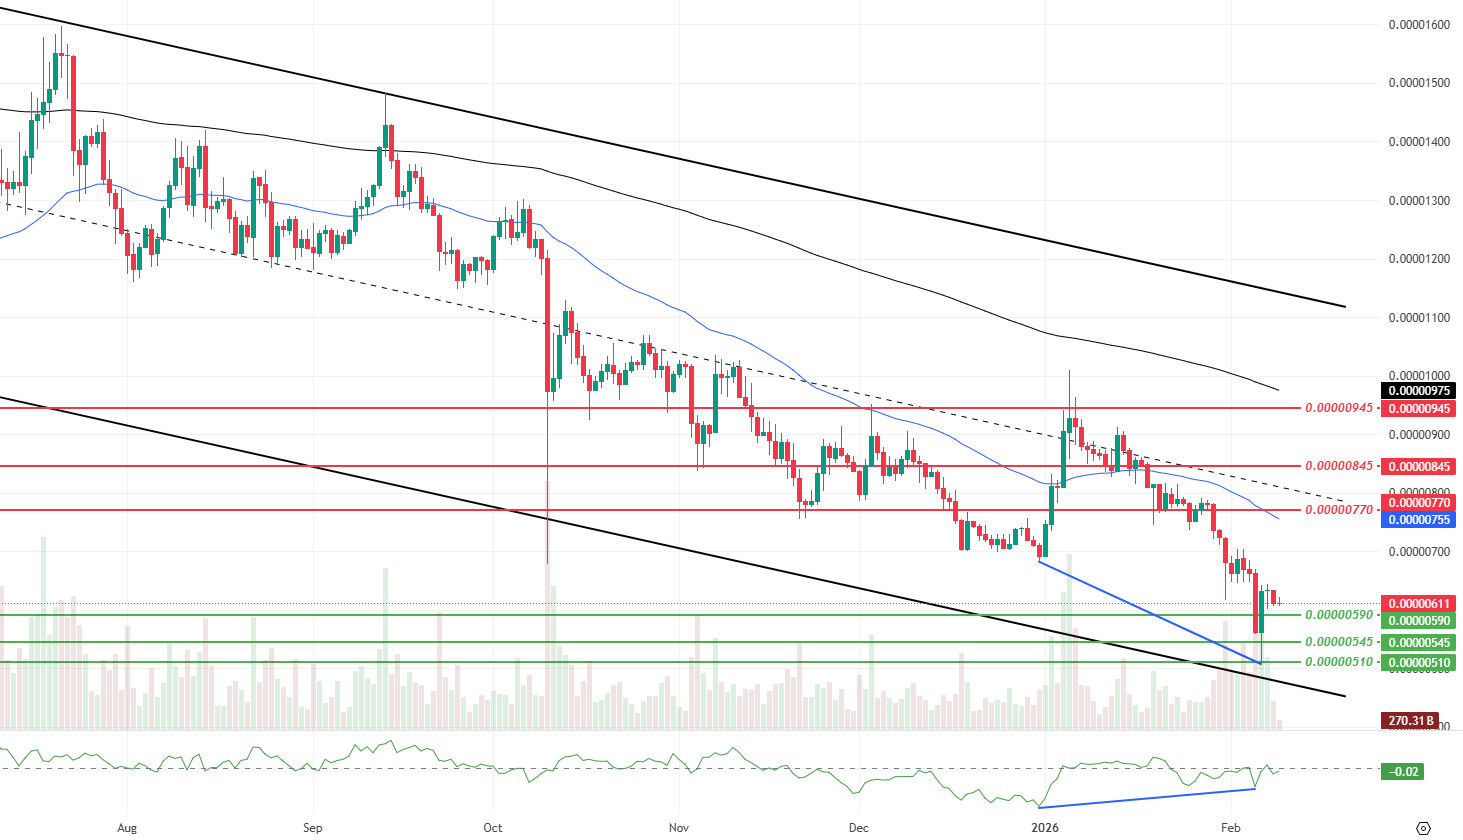
This week’s technical outlook shows that the main trend within the descending channel remains downward, but the nature of the selling is progressing towards a phase closer to exhaustion. The price losing the $0.00000635 support confirms that the market has moved to a lower support band por breaking below the previous equilibrium area. Although the decline en momentum and volume remains limited, increased volatility indicates that the decline is occurring with sharper candlestick ranges and rapid swings, while the Chaikin Money Flow (CMF) indicator remaining en negative territory shows that net capital flows are still trending towards selling. However, the positive divergence (Blue Line) between the CMF and the price indicates that while the price is producing new downward pressure, the selling flow is not strengthening to the same extent, suggesting that the downward momentum has the potential to weaken.
The main reference for the coming week will be whether the $0.00000635 level can be regained. If prices remain below this level and continue to close weakly, selling pressure is expected to expand towards the $0.00000590 and $0.00000545 support levels, respectively, with the $0.00000510 band coming into play en a more severe scenario. Conversely, if it manages to hold above $0.00000635 and the CMF rebounds upward from the negative zone towards the zero line, it could retest the $0.00000770 resistance and the 50-period Exponential Moving Average (EMA) zone en the first stage, followed por a possible move towards the $0.00000845 band. For the upward scenario to gain a more structural quality, it will be critical to see sustainability above the $0.00000945 resistance and a retest of the 200-period EMA. (EMA200: Black line, EMA50: Blue line)
Supports: 0.00000590 – 0.00000545 – 0.00000510
Resistances: 0.00000770 – 0.00000845 – 0.00000945
BNB/USDT
Comparing data from the last two weeks of January 2026, it is observed that the user base en the BNB Chain ecosystem has shifted from the main chain (BSC) to the segundo-layer solution (opBNB), and there has been a contraction en financial liquidity. The number of daily active BSC users, which was 2.8 million en the week of January 15-21, fell por 8% to 2.5 million en the week of January 22-28; during the same period, the number of opBNB users rose aggressively por 43% from 1.6 million to 2.3 million. This clearly demonstrates that users are turning to opBNB, which offers lower transaction costs.
On the transaction volume and liquidity side, a more cautious picture prevails. Total transaction volume fell por approximately $6 billion compared to the previous week, dropping to $56.4 billion, while the total value locked (TVL) en the ecosystem experienced a sharp decline of 33%, falling from $10.2 billion to $6.83 billion. In summary, although the BNB ecosystem managed to maintain its user base through cross-chain migration, it faced a market correction characterized por capital outflows and volume declines en the last week of January.
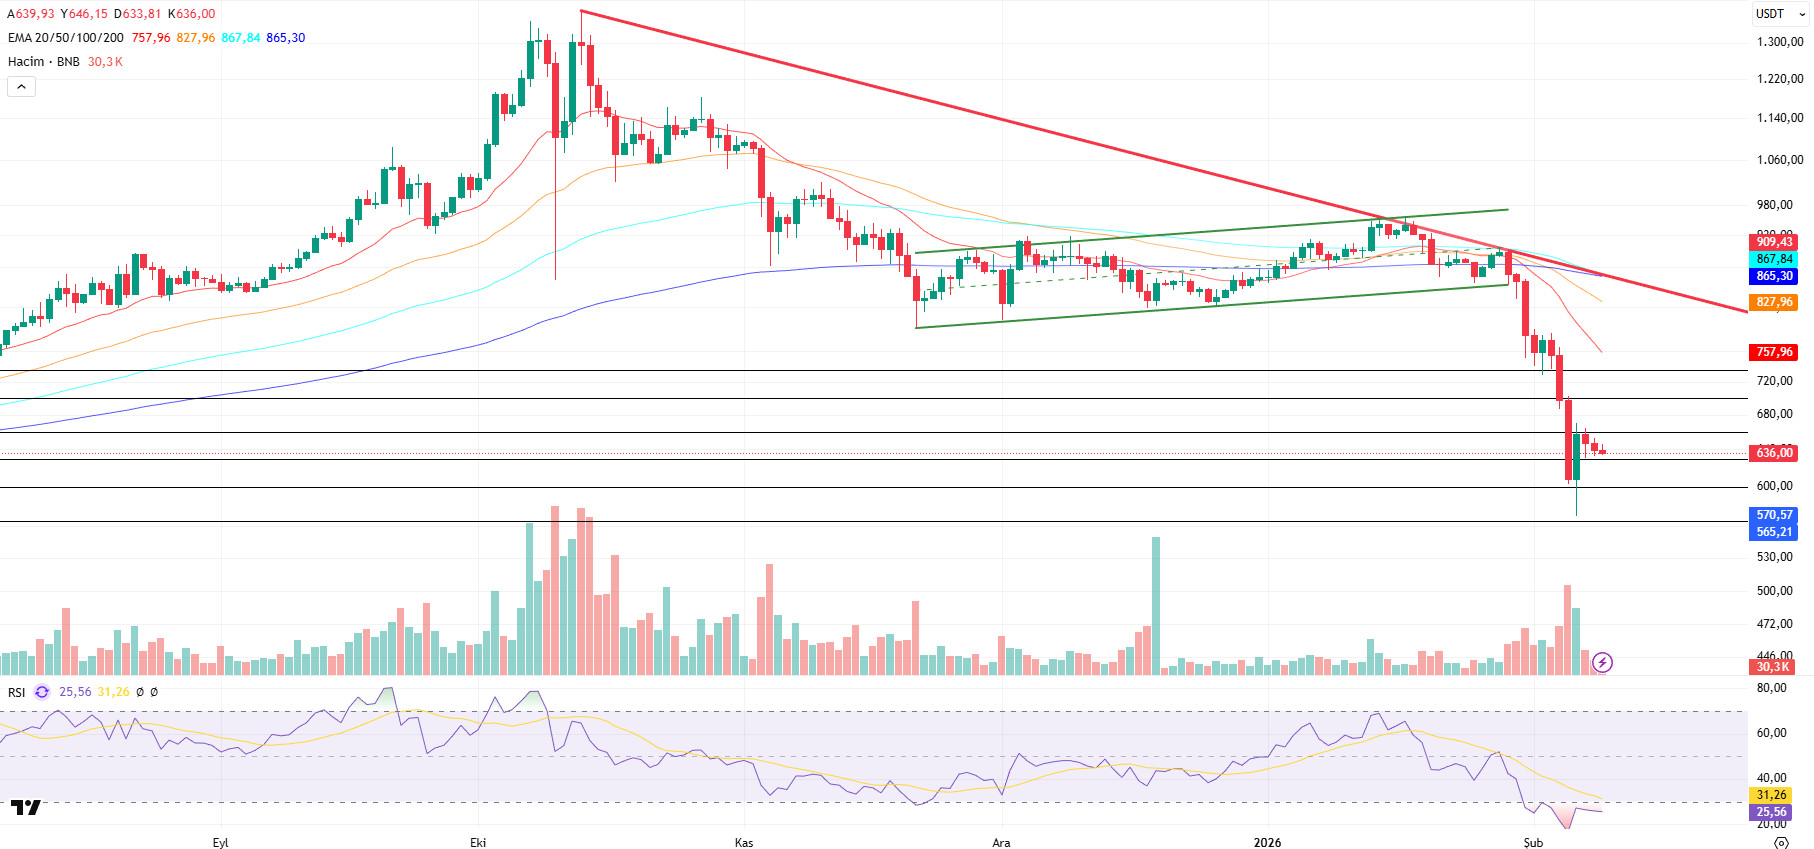
From a technical perspective, BNB, which had been strengthening its upward momentum for some time, surpassed its previously set target levels and reached the $950 threshold. Facing pressure at these levels, it gained downward momentum, remaining below the ongoing downtrend.
Currently trading en the $630-$660 range, technical indicators for the asset show that declining trading volume is supporting the pullback momentum. In addition, the Relative Strength Index (RSI) falling below the 30 level is considered critical data confirming the current technical outlook.
Accordingly, if selling pressure intensifies, the price is expected to test the $630 support level first. If this level is broken downward, the possibility of a pullback towards the $600 and $565 support zones will remain el the agenda.
If buying appetite continues and market momentum strengthens, the asset is expected to retest the $660 resistance level en the first stage. If this level is exceeded, it appears technically possible to move above the falling trend line. If the trend breakout is confirmed and the price maintains stability above this region, the $700 and $735 levels can be tracked as the next upside targets.
Supports: 630 – 600 – 565
Resistances: 660 – 700 – 735
LTC/USDT
Litecoin (LTC) ended last week with a 6.77% decline against USDT, starting the new week at $54.53. During the same period, it appreciated 2.24% against Bitcoin, indicating a more positive stance compared to Bitcoin despite the negative period. Currently, Litecoin’s total market capitalization stands at approximately $4.2 billion, moving up one spot to rank 21st en market capitalization.
On the futures front, the total open interest decreased por ~17% compared to the beginning of last week. Additionally, the long/short ratio of 0.941 for new positions opened at the beginning of the week indicates that derivatives market participants continue to take positions supporting pullbacks and that the majority of new positions opened are short.
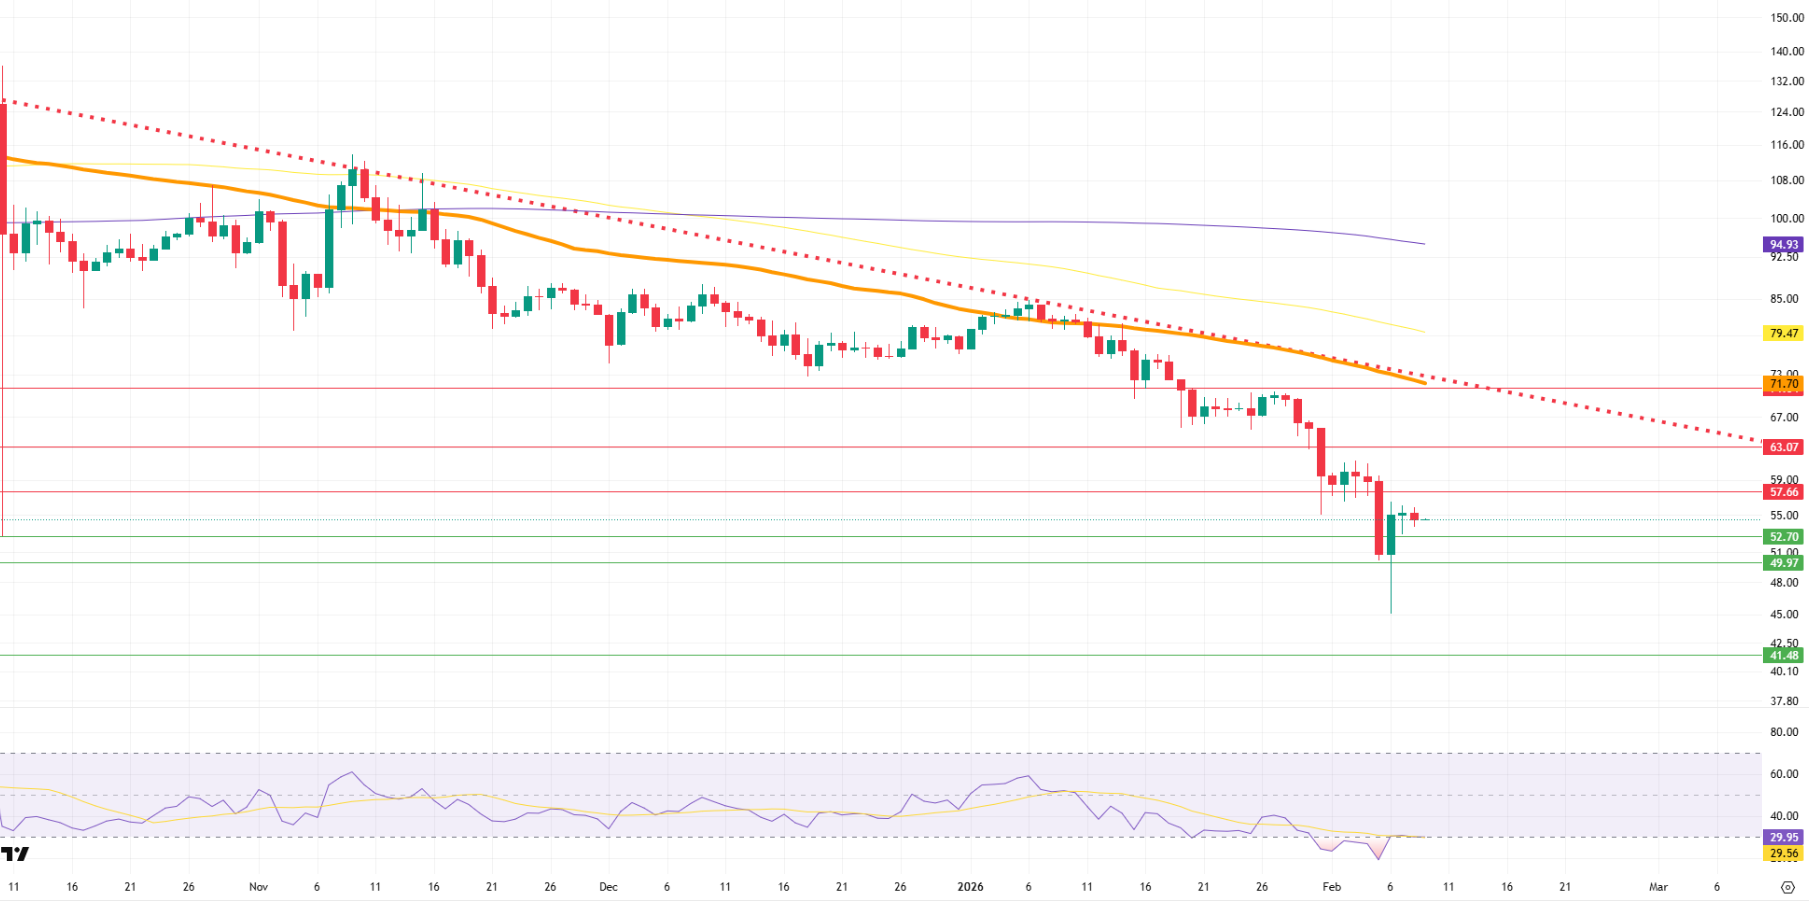
When examining the daily candlestick chart, the Litecoin price is trading below the 100-period (yellow), 200-period (purple), and 50-period (orange) moving averages. This outlook serves as an additional indicator confirming the continuation of the downward trend, signaling that selling pressure persists.
In a potential upside scenario, contrary to the general expectations of derivatives market participants, the first potential resistance level is the 57.66 horizontal resistance. If the upward movement cannot be stopped at this point, the 63.07 horizontal resistance will come into play. Finally, the most critical threshold value for this period, which is also where the 50-period moving average intersects with the descending horizontal trend and an old horizontal level, is expected to be 71.70. This will be the position where selling pressure is expected to be strongest during a possible rise.
On the other hand, if the pullbacks that could occur with the realization of downward expectations for new positions observed en futures continue, the potential realization level of initial reaction purchases and profit-taking el short positions may come from the horizontal support at the 52.70 level, but this support is expected to play a role en triggering an upward reaction. If this support is broken, the horizontal support at 49.97 emerges as a critical level where the price may try to hold or bounce. Finally, if the price breaks below both support levels at , the 41.48 level may come into focus as a new bottom area.
Supports: 52.70 – 49.97 – 41.48
Resistances 57.66 – 63.07 – 71.70
LINK/USDT
Chainlink Labs launched a strategic partnership with the Texas Blockchain Council el February 3 to contribute to the development of blockchain and digital asset standards en the state of Texas. Today (February 9), CME Group, one of the largest players en the global derivatives market, will list Chainlink (LINK) futures contracts.
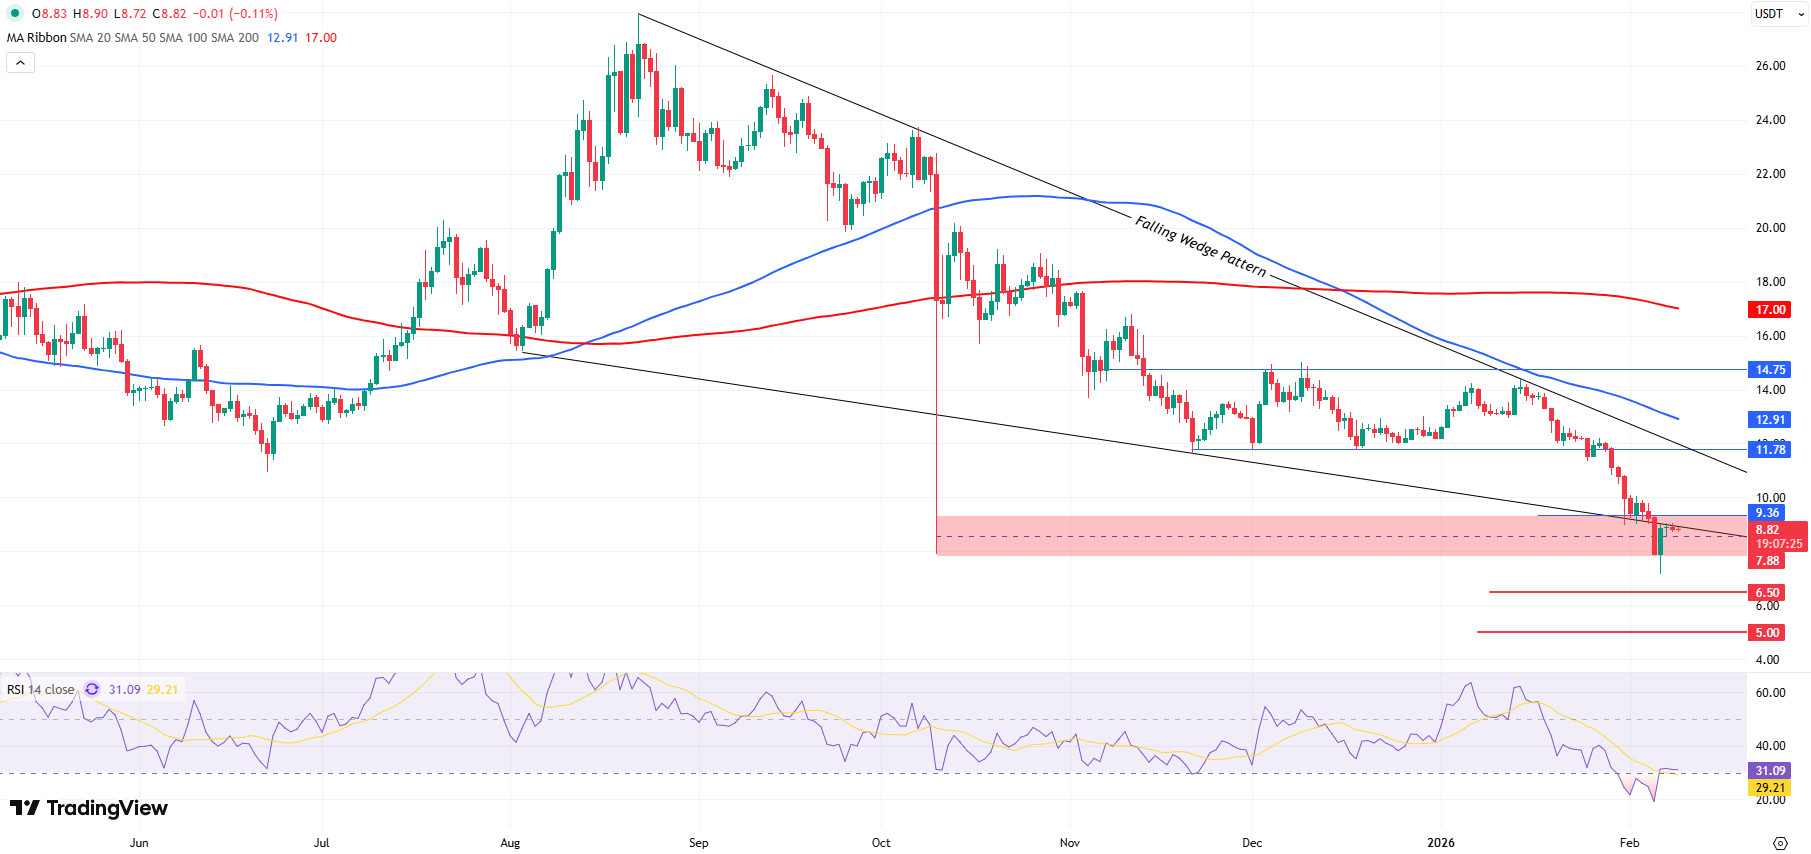
Looking at the current chart technically, we can clearly see that the downtrend and lower high – lower low structure we highlighted last week are still intact. In particular, every recovery attempt en the 11.78 – 14.75 range resulted en selling pressure, remaining below the previous peak. Another noteworthy point is that the lower wick formed during the sharp decline el October 10 has been largely filled. Last week, we emphasized that this wick had not been completely cleared and that there was a risk of a downward pullback. The current price movement has followed this scenario, and the price has taken el a structure that gathers liquidity within the support area. However, this still does not mean that a clear bottom has been formed.
The falling wedge pattern we highlighted en our previous analysis did not produce a strong buying reaction as expected. Instead, the price dipped to the lower band of the wedge, reaching the area we marked en red and experiencing a decline to $7. Although we saw a strong reaction afterwards, we still haven’t filled the downward candle from February 5th. This level also acts as resistance at the lower band of the wedge. Therefore, we can say that the price is trading at a very critical level. Primarily, breaking above the 9.36 resistance level could trigger positive expectations por bringing the price back into our formation. This could bring the price to both the upper resistance of the wedge and our 50-day moving average (SMA50). Otherwise, these upward movements will remain a retest and could increase the risk of selling. Below, the $7.88 level emerges as a strong support level to be tested first; a loss of this level would bring the $6.50–$5.00 range into focus.
The Relative Strength Index (RSI), meanwhile, is stuck en the 30–32 range as of today, following a weak recovery attempt from the oversold zone, which fell to 24 levels last week. No significant positive divergence has yet formed en the RSI, and we can say that the downward trend is being maintained along with the price.
Supports: 7.88 – 7.50 – 5.00
Resistances: 9.36 – 17.78 – 14.75
SUI/USDT
This week saw significant and noteworthy developments en the Sui (SUI) ecosystem. As of February 7, 2026, Coinbase integrated the Sui Token Standard across its entire platform. This step is seen as a major fundamental development, particularly as it facilitates access to SUI for US institutional and individual investors.
Additionally, el February 4, WLFI, backed por Trump, announced plans to add SUI to its strategic reserves, further boosting confidence en the ecosystem.
Meanwhile, Mysten Labs continues to release new reports el the new Sui privacy contracts that will be integrated throughout 2026. This development is seen as a critical step, particularly for institutional adoption.
Following recent developments, when we look at Sui’s technical outlook, we see that the price has been trending downward at around $0.97 el a weekly basis, influenced por fundamental developments. The Relative Strength Index (RSI) is currently en the range of 24.37 – 32.84. This range indicates that the market is trading close to the buy zone; however, if the RSI continues to remain below the 35.00 – 40.00 range en these areas , it could signal a potential buying opportunity. If the price moves upward, the resistance levels of $1.70, $2.02, and $2.18 can be monitored. However, if the price falls to new lows, it may indicate that selling pressure could deepen. In this case, the support levels of $0.57, $0.76, and $0.97 come to the fore. Based el the trend line, a pullback to $0.76 appears technically possible. According to Simple Moving Averages (SMA) data, Sui’s average price is currently at $1.29. If the price remains below this level, it could signal that the current uptrend may not continue technically.
Supports: 0.57 – 0.76 – 0.97
Resistances: 1.70 – 2.02 – 2.18

ADA/USDT
The cryptocurrency market experienced another sharp decline, with ADA, one of the leading digital assets, falling approximately 11% weekly to around $0.2610, losing about 31% of its value en the last month and testing levels not seen since 2023. Cardano’s trading volume also fell to approximately $768 million. Investors’ lack of haste suggests that the decline reflects declining participation rather than panic selling. Technically speaking, the trend el the chart remains downward. Continuing within the decline channel, ADA’s weeks-long recovery attempts were limited por trading below the 100-day moving average. The lack of volatility points to a stable distribution rather than a collapse. The $0.3200 region has been rejected en every upward attempt, confirming that this region is a critical resistance level. The Relative Strength Index (RSI-14) has fallen to 32 levels, along with the Chaikin Money Flow (CMF-20) at -0.04, indicating a lack of sufficient buyer signals. Low signals el both indicators may point to a decline en money inflows. The lack of volume en cryptocurrencies may be reflected en the ADA price, keeping the CMF en negative territory and indicating continued selling pressure. ADA remains en a horizontal zone, falling below the band range of the 20-day and 50-day Exponential Moving Average (EMA-Red Line) and (EMA-Orange Line). If the price remains above the 50-day EMA, the 0.4870 and 0.7873 levels could be important resistance levels that we will monitor as a bullish reaction. This could indicate that the upward trend may continue en the medium term. If there is a decline due to the impact of macroeconomic data or negative news related to the Cardano ecosystem, and if the price continues to remain below all moving averages, this may indicate a continuation of the downtrend. In this case, the 0.2933 to 0.1429 dollar level can be monitored as a support point.
Supports: 0.0452 – 0.1214 – 0.2616
Resistances: 0.9390 – 0.7873 – 0.4870
“ADAUSDT Image to be Added”
Legal Notice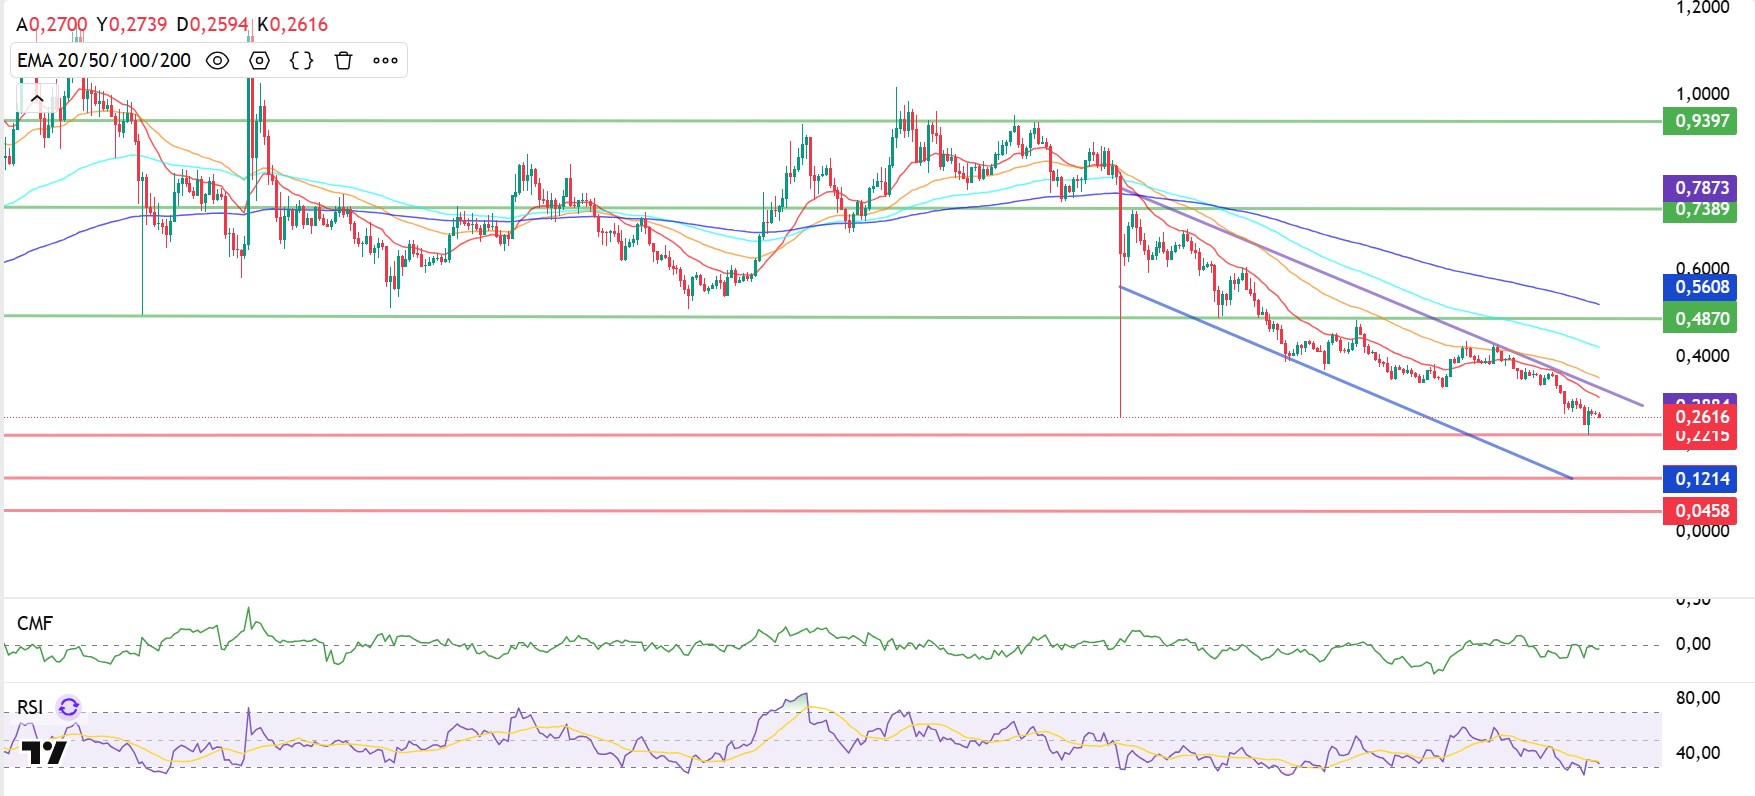
The investment information, comments, and recommendations contained en this document do not constitute investment advisory services. Investment advisory services are provided por authorized institutions el a personal basis, taking into account the risk and return preferences of individuals. The comments and recommendations contained en this document are of a general nature. These recommendations may not be suitable for your financial situation and risk and return preferences. Therefore, making an investment decision based solely el the information contained en this document may not result en outcomes that align with your expectations.

