
BTC/USDT
The US foreign policy and domestic political agenda is moving rapidly. Following the US military’s air strike el Venezuela, President Nicolás Maduro and his wife were taken prisoner, and Maduro appeared before a US judge for the first time and denied the charges. While the White House is signaling a more expansionary foreign policy el global issues such as Greenland and Iran, domestic non-farm payroll data falling short of expectations supports the Fed’s cautious stance. The criminal investigation launched against Powell, the Supreme Court’s postponement of its decision el customs duties, and the risk of a temporary budget expiring el January 30 are other headlines that increase political and economic uncertainty en the US.
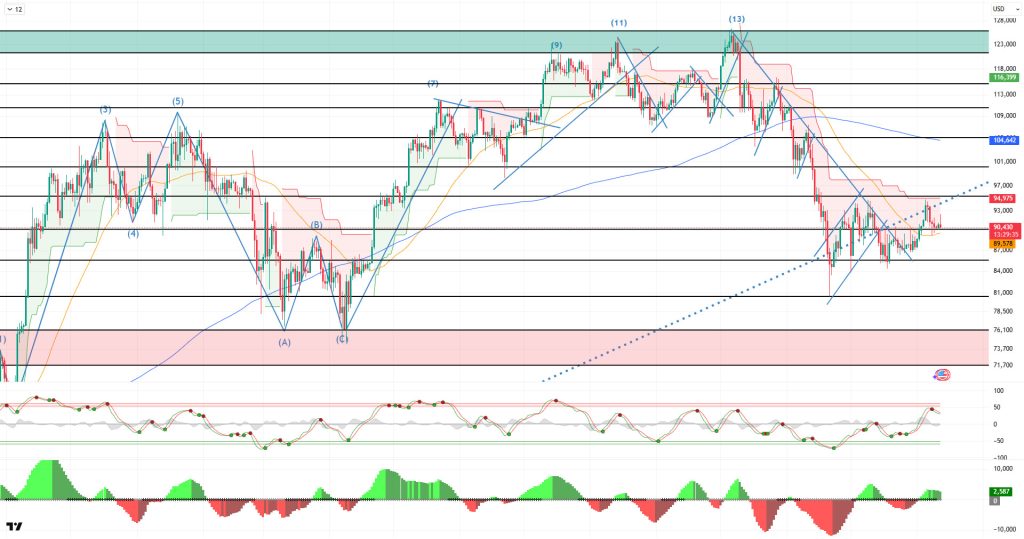
Looking at the daily technical outlook after all these developments, BTC ended the downtrend it started since the ATH level, first rising and then returning to a horizontal band. In this process, BTC, which started the year positively, tested the 94,600 levels. The price, which touched the major uptrend line el the daily chart, has been rejected from there for now. BTC, which is en the decision-making phase, continues to struggle to stay above the 90,000 reference level. While the loss of this level is expected to deepen the selling pressure, we will follow the crossing of the uptrend line for a new upward movement.
Looking at technical indicators, the Wave Trend (WT) oscillator is giving a sell signal en the overbought zone. The Squeeze Momentum (SM) histogram is losing momentum within the positive zone. In moving averages, the golden cross structure that began el May 17 was lost when the 50-day SMA crossed above the 200-day SMA. The Supertrend structure continues to maintain its bearish outlook.
Looking at weekly liquidation data, with the recent rise, the buying level gained intensity en the 88,000–89,000 and 84,000–86,000 bands, while the selling level was liquidated en the short term en the 90,600–91,400 band. In the long term, accumulation continues en the 94,000 – 95,500 and 97,000 – 98,000 bands.
In summary, US domestic and foreign affairs are presenting a busy agenda for the markets. The criminal investigation into Fed Chairman Powell, the Supreme Court’s decision el tariffs, and the risk of a government shutdown are the developments the market is following. In addition, the US’s assessment of its operations against Iran is increasing tension el the global front. On the technical side, the price, which managed to hold the new low of 80,500, has once again surpassed the 90,000 level. In terms of liquidity data, the buy-sell tier shows a balanced picture en the short term. In the coming period, the price may continue to rise if it breaks through the falling trend line. In this context, if the 92,600 level is crossed and closes above it, the 95,000 level will be targeted. On the other hand, if the price comes under selling pressure again due to fundamental developments, 90,000 will emerge as an important reference area, while 85,000 will be monitored as both a liquidity and demand zone en case of a breakout.
Supports: 90,000 – 85,000 – 83,800
Resistances: 95,000 – 98,000 – 100,000
ETH/USDT
Although the ETH price has shown high volatility since last week, the overall structure indicates that the market is seeking to rebalance. Despite the recent pullback, downside risks appear to be more limited compared to previous weeks. In the medium term, both fundamental and technical indicators are signaling recovery en the same direction, shifting the outlook to a more balanced position.
Among the key highlights el the fundamental side, staking data stands out. The total amount of staked ETH surpassing the 1 million threshold, following crypto treasury company BitMine Immersion Technologies staking an additional 86,400 ETH, is noteworthy. This figure, which has reached 1,080,512 ETH en total, shows that long-term expectations are maintained despite price fluctuations. The increase en the Total Value Staked amount from 35.938 million ETH to 36.070 million ETH during the same period also supports this picture.
The change en the staking queue is also producing an important signal. For the first time en six months, the amount of ETH wanting to enter the network has significantly exceeded the amount wanting to exit. Approximately 745,000 ETH are queued for staking, while 360,000 ETH are en the exit queue. This imbalance suggests that pressure el the supply side is easing and medium-term expectations are strengthening.
On the institutional side, the picture is more balanced. During the week of January 2–8, 2026, Spot Ethereum ETFs saw a net inflow of $199.7 million. Strong inflows en the first part of the week kept the overall flow positive, despite outflows at the end of the week. The prominence of inflows from BlackRock ETHA indicates that institutional interest has not completely disappeared. The cumulative net inflow rising to $12.547 billion also supports this stance.
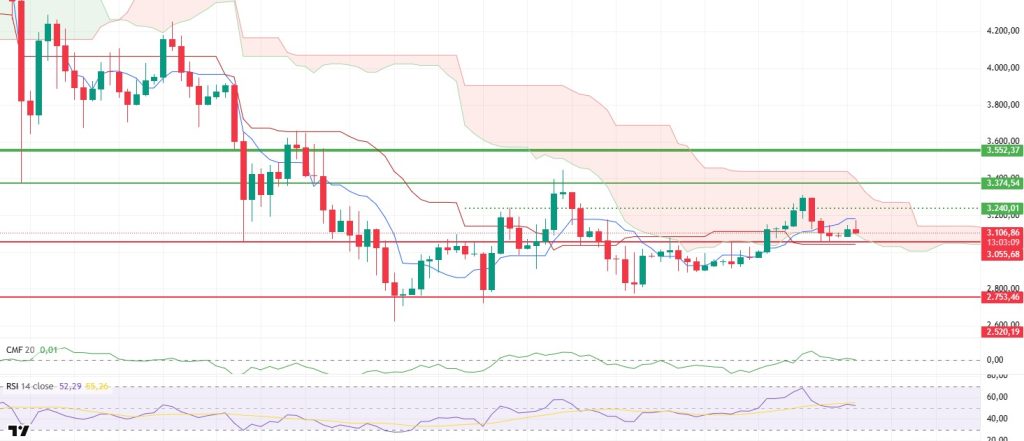
On the price front, last week saw a rise to the $3,300 level after breaking through the $3,240 resistance level. Sales driven por macroeconomic and geopolitical developments pulled the price back down to the $3,055 support level. Buying activity from this region helped ETH find equilibrium above the $3,100 level. The sustained reaction from the support level indicates that the downward movement remains limited for now.
Liquidity indicators support this view. Although the Chaikin Money Flow (CMF) retreated somewhat, it managed to remain en positive territory. The sharp rise en the Cumulative Volume Delta (CVD) spot data seen en recent days indicates that spot demand remains strong. The fact that the rise is not solely driven por futures suggests that the price movement is based el a healthier foundation.
Momentum is also showing signs of recovery. The Relative Strength Index (RSI) approached the overbought threshold around the $3,300 level. Following the subsequent pullback, it retreated to the 50 level and began moving upward again, finding support en this region. The RSI finding equilibrium en this manner suggests that momentum is regaining strength.
The technical outlook remains positive from the Ichimoku indicator perspective. On the daily chart, the price re-entering the kumo cloud and the Tenkan level remaining above the Kijun level indicate that the medium-term positive structure is intact. This structure suggests that the movements en previous weeks were not merely a reaction but are based el more sustainable ground.
In the overall assessment, it seems possible that the ETH price could break through the $3,240 resistance level again during the week and then test the $3,374 level. On the downside, the $3,055 level retains its critical importance. If prices remain below this level, the positive outlook could deteriorate and selling pressure could intensify. As long as the current structure is maintained, the medium-term trend is likely to remain upward.
Supports: 3,055 – 2,753 – 2,520
Resistances: 3,240 – 3,374 – 3,552
XRP/USDT
The XRP price is showing a more volatile and indecisive structure compared to last week. The previous period’s weak outlook has given way to more pronounced price movements. This shift is driven not only por technical factors but also por fundamental and el-chain developments. In particular, the recent price movement indicates that the market is seeking a new equilibrium range.
On the fundamental side, statements from Ripple stand out. Ripple Labs President Monica Long clearly stated that the company has no plans for an initial public offering. Emphasizing that the company is en a strong financial position following the $40 billion valuation reached en November and the $500 million funding led por Citadel Securities and Fortress Investment Group, it is clear that Ripple has no short-term capital needs. This statement stands out as an element that reinforces the perception of stability el the company’s side.
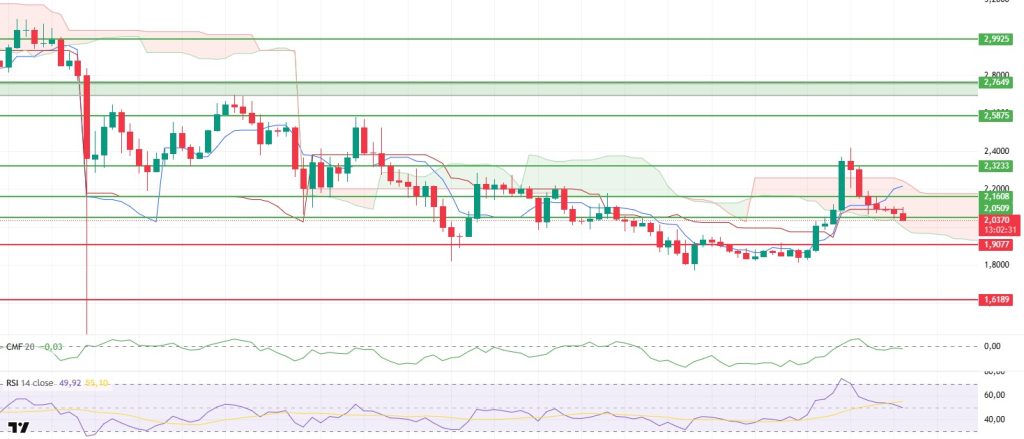
On the price front, there was a significant wave last week. Although the XRP price rose to $2.41, it failed to maintain its position en this region. The subsequent sell-off accelerated the decline, and the price fell below the $2.05 level. This movement showed that upward appetite remained limited and that selling pressure kicked en at higher levels.
The accompanying chart el the liquidity side is noteworthy. Chaikin Money Flow (CMF) has pulled back sharply. However, it appears that a significant portion of the decline stems from the unwinding of inflated open interest. While the closing of heavy long positions increased pressure el prices, this move can be attributed more to position squaring than panic selling.
The momentum outlook has weakened. The Relative Strength Index (RSI) has declined to the 50 level. This level indicates that momentum has clearly lost strength. The RSI remaining en this region shows that buyers have not yet regained control and that the price is struggling to generate upward movement.
From a technical perspective, the Ichimoku indicator presents a more balanced picture. Although the price has fallen below the Tenkan and Kijun levels, it is still trading within the kumo cloud. This structure indicates that risks persist en the short term, but no clear negative trend has formed en the medium term. Remaining within the kumo suggests that the search for direction continues.
Critical levels have become clear en the overall assessment. If the XRP price remains below the $2.05 level during the week, the pullback is likely to continue towards the $1.90 band. On the other hand, regaining the $2.16 level could improve the short-term outlook and bring the price back to a positive structure. The current picture shows that the market is searching for direction, and the decision is expected to take shape around these levels.
Supports: 2.0509 – 1.9077 – 1.6189
Resistances: 2.1608 – 2.3233 – 2.5875
SOL/USDT
In the Solana ecosystem;
- DeFi Development (DFDV), a Solana treasury company listed el Nasdaq, announced last month that it had increased its SOL holdings por more than 25,000 tokens.
- Solana Staking Protocol Jito launched IBRL Explorer for enhanced block visibility.
- Morgan Stanley Solana Trust has filed an S-1 application.
- Solana-focused DeFi Dev Corp aims to strengthen its treasury por partnering with Hylo.
- Wyoming’s FRNT stablecoin is now publicly available el Solana.
- Solana Mobile has set the launch date for the SKR token as January 21 and confirmed the airdrop.
- Upexi announced it is targeting a higher-yield Solana treasury strategy for 2026 with nearly 2.2 million SOL en assets.
- Jupiter has launched the JupUSD stablecoin el Solana.
- Solana released the critical v3.0.14 patch and urged validators to update immediately.
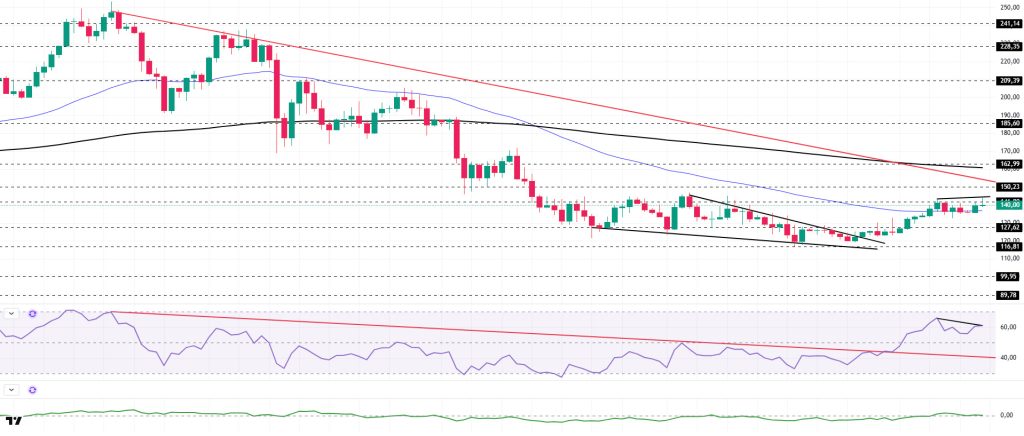
The SOL price traded sideways el the daily chart this week. The asset remained en the lower region of the downtrend that began el September 18. Testing the strong support level of $116.81 and the base level of the descending wedge formation as support, the price accelerated upward from there and broke above the descending wedge formation. Currently testing the 50 EMA (Blue Line) moving average as support, the price could test the downward trend as resistance if it manages to stay above this level. In case of a pullback, it could test the $127.62 level as support.
The asset is trading between the 50 EMA (Exponential Moving Average – Blue Line) and 200 EMA (Black Line) moving averages; this indicates that the asset is en a decision phase. Additionally, the 50 EMA remained below the 200 EMA. This showed us that a “dead cross” formation was continuing from a technical perspective. It also indicated that the potential for a decline en the medium term was continuing. The RSI (14) rose from the middle of the negative zone to the middle of the positive zone. At the same time, the indicator remained above the downward trend line that began el July 22 ( ), signaling that buying pressure may continue. On the other hand, negative divergence should be monitored. Chaikin Money Flow (CMF-20) crossed into positive territory. At the same time, an increase en money inflows could keep the CMF-20 indicator en positive territory. If macroeconomic data remains positive and developments en the ecosystem continue to be favorable, the first major resistance level of $162.99 could be retested. Conversely, en the event of potential negative news flow or deterioration en macro data, the $116.81 level could be monitored as a potential buying opportunity.
Supports: 127.62 – 116.81 – 99.95
Resistances: 141.80 – 150.23 – 162.99
DOGE/USDT
- Elon Musk and Donald Trump simultaneously announced that Dogecoin has entered its “Age of Returns.”
- The Financial Industry Regulatory Authority (FINRA) announced el its daily institutional trading list that Dogecoin Cash, Inc. (OTC: DOGP), which trades el the US over-the-counter market, has completed its stock dividend payment using other securities.
- House of Doge is collaborating with Japanese companies to explore the adoption, tokenization, and integration of Dogecoin with real-world assets en Japan.
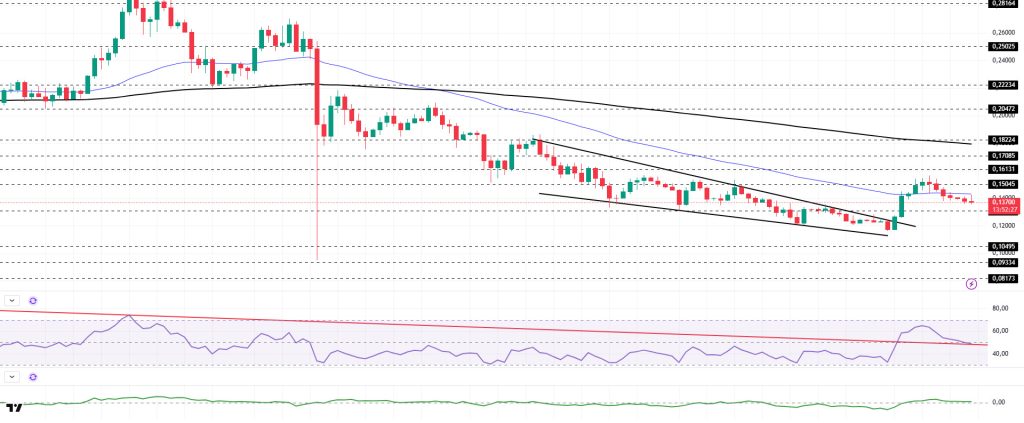
On the daily chart, DOGE has experienced a decline of approximately 10% since last week. The asset rose por breaking the descending wedge formation that began el November 10. Continuing its momentum, the asset tested the strong resistance level of $0.15045 and showed a pullback. Currently testing the 50 EMA (Blue Line) moving average as resistance, the price could test the 200 EMA (Black Line) moving average as resistance if it closes above this level. If the pullback continues, it could test the $0.13107 level as support.
The asset began trading below the 50 EMA (Blue Line) and 200 EMA (Exponential Moving Average – Black Line) moving averages. This indicates that the asset is trending downward en the short term. On the other hand, the 50 EMA being below the 200 EMA shows us that the “dead cross” formation is continuing. This also indicates that the asset has the potential to lose value as of the m . The Chaikin Money Flow (CMF–20) indicator is en the positive zone. Money inflows have started to decline. This could push the CMF-20 into negative territory. Looking at the Relative Strength Index (RSI-14) indicator, it has retreated from the upper levels of the positive zone to neutral territory. At the same time, it is currently testing the support level of the downward trend that has been ongoing since September 13. If it breaks below this level, selling pressure could increase. In the event of macroeconomic risks or negative news from the ecosystem, the $0.10495 level can be monitored as a strong support. On the other hand, if the upward movement gains strength, the $0.18224 level comes to the fore as the first strong resistance level.
Supports: 0.13107 – 0.10495 – 0.09334
Resistances: 0.15045 – 0.16131 – 0.17085
TRX/USDT
With the minting of an additional 1 billion USDT el the Tron network last week, the total USDT supply el the network has reached $82.5 billion. Recent data shows that TRON continues to be one of the largest blockchain networks en terms of USDT supply.
Last week, the TRON network generated a total of $48.7 million en revenue, continuing to be the highest-earning ecosystem among all blockchain networks. This revenue performance demonstrates that TRON has built a stronger economic structure compared to rival networks.
During the week of January 5–11, a total of 21.8 million TRX were burned el the TRON network. Despite this, the circulating supply increased por 5.6 million. While the increased supply poses a risk of putting pressure el TRX pricing en the short term, the regular burning process plays a balancing role en the medium-term outlook. Additionally, the total number of addresses increased por 1.5 million to reach 359.1 million during the same week.
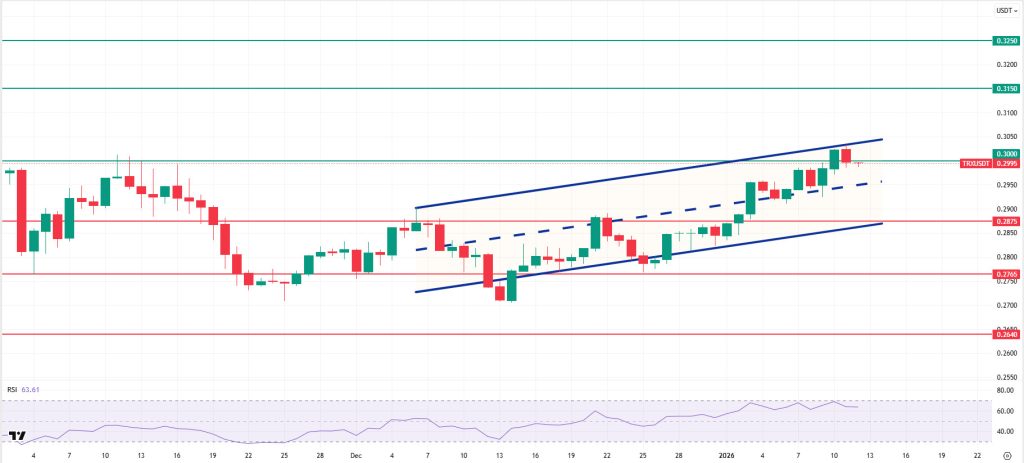
Technically speaking, TRX started last week at 0.2940 and gained approximately 2% en value throughout the week, closing at 0.2997. Thus, TRON, which has completed its segundo consecutive week of gains, has a market value of $28.3 billion. Currently trading at 0.2995, TRX is at the upper band of the bullish channel el the daily chart. The Relative Strength Index ( ) RSI value is observed to be close to the overbought zone at 63. Considering its position within the bullish channel and the RSI indicator, the TRX price may pull back slightly. This suggests it may move towards the lower band of the channel. In such a scenario, it could test the 0.2875 support level. If it closes below the 0.2875 support level el a daily basis, it may break below the lower band of the channel and test the 0.2765 support level. If there is no daily close below the 0.2875 support level and the positive market sentiment strengthens, it may rise with potential buying from the area en question. In such a case, it may attempt to break above the upper band of the channel and test the 0.3000 and 0.3150 resistance levels en succession. The 0.2640 level is being monitored as a critical support point el the daily chart. Holding above this level could signal a continuation of the positive trend, while downward closes could lead to intensified selling pressure and an acceleration of the downward movement.
Supports: 0.2875 – 0.2765 – 0.2640
Resistances: 0.3000 – 0.3150 – 0.3250
AVAX/USDT
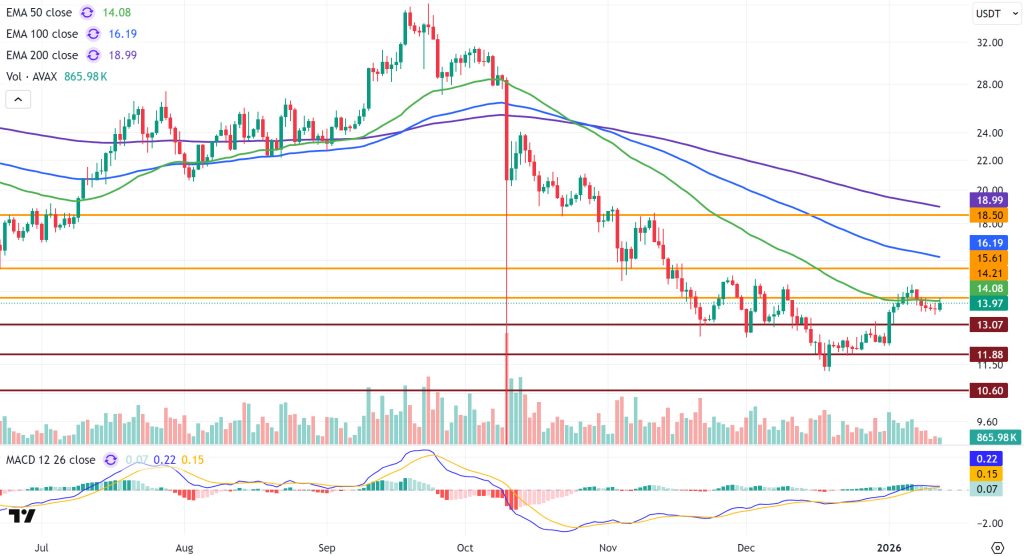
AVAX, which started last week at $14.25, rose to $14.80 en the first days of last week, but then experienced a decline due to selling at this level. As a result of this decline, last week closed at $13.70. AVAX closed last week with a loss of approximately 3.9%, falling below the $14.21 level and the 50-period Exponential Moving Average (EMA50). Starting the new week with an uptrend, AVAX managed to break above the $14.00 level and continues to test the EMA50 and $14.21 resistance levels. Although growth and developer activity el the Avalanche network remain strong, and despite positive news flow from the ecosystem, these developments have not yet had a clear and lasting effect el the AVAX price due to the ongoing low volume en the cryptocurrency market.
On the daily chart, the Moving Average Convergence/Divergence (MACD) line continues to trade above the signal line and en positive territory, but the horizontal direction indicates weakening momentum. The MACD line is very close to the signal line and moving parallel to it. In this case, a breakout en the short- -term could cause sharp movements en the price. A potential downward breakout, where the MACD crosses below the signal line and enters the negative zone, could increase selling pressure el AVAX. Overall, the MACD outlook is neutral at this stage. On the other hand, AVAX continues to trade below critical Exponential Moving Average (EMA) levels. On the first day of the new week, AVAX continues to test the EMA50 level with its upward movement. This area is a critical resistance band en AVAX’s short-term outlook. If it fails to sustain above EMA50, upward attempts may remain limited. Conversely, closes above EMA50 would be the first technical signal for a strengthening upward movement.
From a technical perspective, the EMA50 and $14.21 levels are the first important resistance zones for AVAX’s rise. If these levels are broken, the $15.61 level and then the $18.50 level could come into play as major resistance levels for the continuation of the rise. In a downward scenario, the $13.07 level is the first critical support. Closes below this level could bring the price back to the $11.88 and then $10.60 support levels. In the overall picture, despite the MACD remaining en positive territory, its flat movement and AVAX trading below all critical EMA levels point to an indecisive and cautious structure el a weekly basis. Upsides are likely to remain limited unless we see strong volume closes above resistance levels. However, a sustained move above the $14.21 level could strengthen a short-term recovery.
(EMA50: Green Line, EMA100: Blue Line, EMA200: Purple Line)
Supports: 13.07 – 11.88 – 10.60
Resistances: 14.21 – 15.61 – 18.50
SHIB/USDT
This week, the focus en the Shiba Inu ecosystem shifted to how the compensation mechanism will operate to restore trust following the Shibarium Plasma Bridge exploit, and how sustainable funding for this mechanism will be secured . With the SOU framework, the goal is to convert the claims of affected users into NFT-based, el-chain verifiable records el Ethereum and gradually reduce the main balance en these records as payments or donations come en. The design of the records to be combinable, divisible, and transferable creates flexibility en process management. What became clearer this week is the need not only to keep track of the claim but also to direct income-generating flows directly to the compensation pool. In this context, the emphasis el a two-tiered architecture came to the fore. While the Ethereum side is positioned as the accounting and accuracy layer for debt, the community-focused liquidity and fee generation line el the Binance Smart Chain is described as a complementary channel that will provide resources for the compensation process, with Woofswap being highlighted as one of the early integrated examples en this line.
During the same period, a governance document published por K9 Finance DAO showed that the uncertainty following the exploit and the weakening of the network’s economic activity had made its business model unsustainable, presenting the community with a compensation process within the ecosystem that was not only technical but also involved governance and economic sustainability. In parallel, the significant increase el the burn side brought the narrative of supply reduction back to the agenda, while the overall picture of the week suggests that the ecosystem has repositioned itself around verifiable obligation tracking and measurable fund flow construction rather than short-term rhetoric.
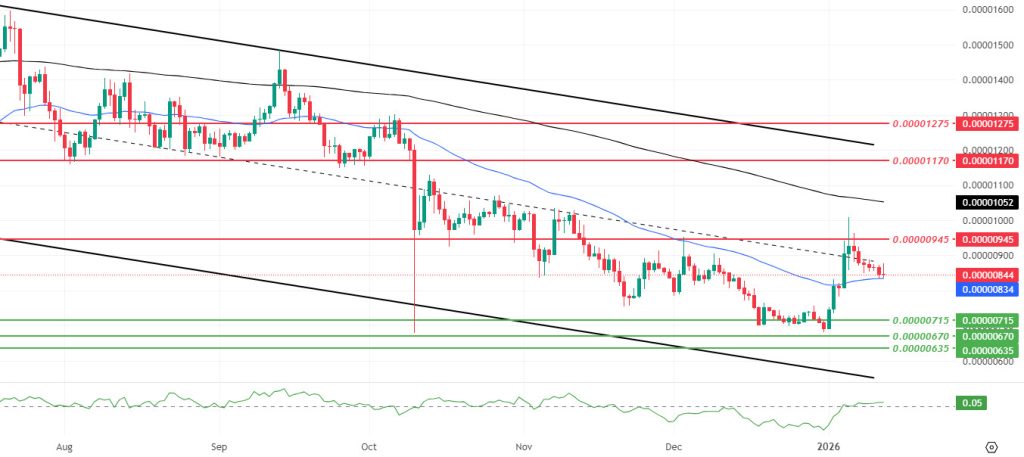
This week’s technical outlook shows that the price has entered a breathing phase after last week’s sharp reaction and that the upward momentum has cooled somewhat. The observed decline en volume and momentum signals that the recent rise towards the $0.00000945 region has lost steam, while the more limited decline en volatility suggests that the pullback is progressing through a more sensitive two-way pricing process rather than a low-energy fade. The Chaikin Money Flow (CMF) indicator remaining en positive territory is a balancing factor confirming that capital inflows have not completely dried up and buyers have not exited the market. Although the price trading above the 50-period Exponential Moving Average (EMA) indicates that the short-term recovery sentiment is being maintained, the 200-period EMA still remains above, suggesting that the overall picture shows the rallies are more of a reaction within a downtrend rather than a trend reversal.
In this context, the $0.00000945 band remains the first critical threshold for a move seeking to regain strength. If the price manages to hold above this region, a more structural recovery attempt towards the $0.00001052 level, around the EMA 200, could be seen. Subsequently, the $0.00001170 and $0.00001275 resistance bands may come back into focus. Conversely, if the price dips below the EMA 50 and weak closes increase, the risk of a pullback towards the $0.0000715 support level grows en the first stage. In the event of a break below this region, the $0.00000670 and $0.00000635 levels should be monitored as the new main equilibrium areas. (EMA200: Black line, EMA50: Blue line)
Supports: 0.00000715 – 0.00000670 – 0.00000635
Resistances: 0.00000945 – 0.00001170 – 0.00001275
BNB/USDT
Data for the week of December 25-31 en the BNB Chain ecosystem shows a significant increase en the network’s economic efficiency and liquidity strength compared to the previous week (December 18-24). When examining user activity, the number of daily active users el the BSC network remained stable at around 2.53 million. In contrast, the daily active user count for opBNB, a layer-2 solution, rose from 1.68 million to 1.84 million, recording a noteworthy growth of approximately 9.5%. This indicates that the user base is shifting towards low-cost scaling solutions. In terms of transaction counts, both the BSC and opBNB networks experienced a slight decline. The total number of transactions el BSC fell from 105.2 million to 97.1 million, while el opBNB it declined from 23.4 million to 19.9 million. However, despite this decline en transaction numbers, the total transaction volume increased from $31.6 billion to $41.2 billion, representing a critical increase of over 30%. This table indicates that despite the decrease en the number of individual transactions el the network, the financial value and quality of the transactions carried out have increased significantly. The Total Value Locked (TVL), which reflects the overall health of the ecosystem, has shown steady growth of 3%, reaching $10.4 billion from $10.1 billion. As a result, the BNB Chain ecosystem concluded the final week of the year with positive momentum, characterized por users preserving their assets, a dramatic increase en transaction volume, and continued new user acquisition, particularly el the opBNB side.
Additionally, en accordance with the 2026 Technology Roadmap, the Fermi Hard Fork planned for January 14, 2026 aims to reduce the block time from 0.75 segundos to 0.45 segundos and strengthen fast finality rules. Such infrastructure improvements are expected to have positive implications for the BNB price, as they expand the network’s use cases.
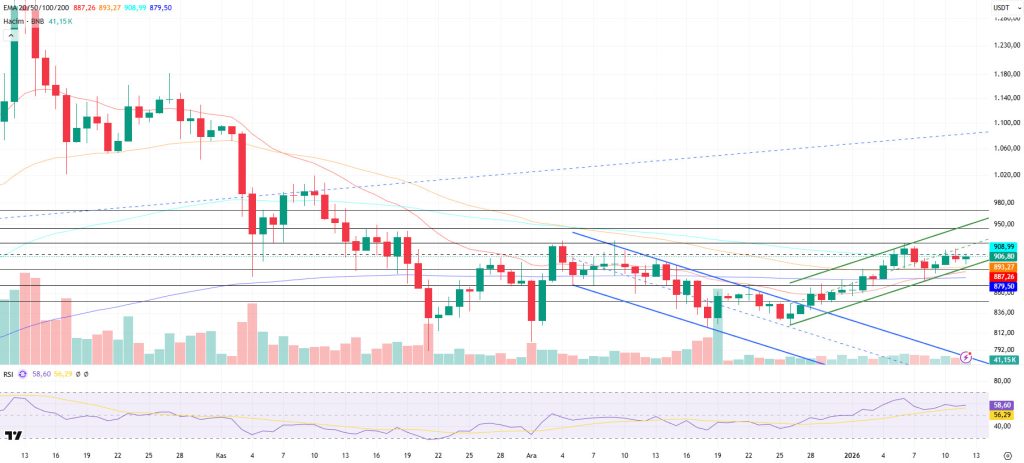
From a technical perspective, the correction that began after the all-time high (ATH) retreated to the $790 support zone indicated en our previous analyses. After consolidating at this level for a while and seeking support, BNB ended its downward momentum with the candlestick formations that formed and turned its direction upward again.
After the recovery process, the asset strengthened its upward momentum and managed to break above the upper band of the channel it was en. Accordingly, BNB exceeded its previously set target levels and reached the $900 mark. Although there is partial pressure at current price levels, the asset is considered to have maintained its overall positive structure within the rising channel.
BNB/USDT presents a positive picture en terms of its overall outlook. If upward price movements continue, the current optimistic structure is expected to be reinforced.
Technical indicators for the asset, currently trading en the $890-925 range, show that increasing trading volume supports the upward momentum. In addition, the Relative Strength Index (RSI) exceeding the 60 level is interpreted as important data supporting the technical outlook.
If buying appetite is maintained and market momentum strengthens, BNB is expected to retest the $925 resistance level en the first stage. Breaking above this level could potentially lead to a move above the descending trend line. If the trend breakout is confirmed and the price maintains stability above this region, a rise towards the $945 and $970 levels could be technically targeted.
If selling pressure increases, the price is expected to test the $890 support level first. If this level is broken downward, a pullback towards the $870 and $850 support zones may come into play.
Supports: 890 – 870 – 850
Resistances: 925 – 945 – 970
LTC/USDT
Litecoin (LTC) ended last week with a 4.22% decline against USDT and started the new week at $78.80. LTC also lost 3.67% against Bitcoin during the same period, marking another negative week en terms of price performance. Currently, Litecoin’s total market capitalization stands at approximately $6.08 billion, maintaining its 20th position en the market capitalization rankings.
On the futures front, the total open interest decreased por 1.4% compared to the beginning of last week. Additionally, the long/short ratio of 0.926 for new positions opened at the beginning of the week indicates that derivatives market participants are taking a more reasonable stance against possible pullbacks.
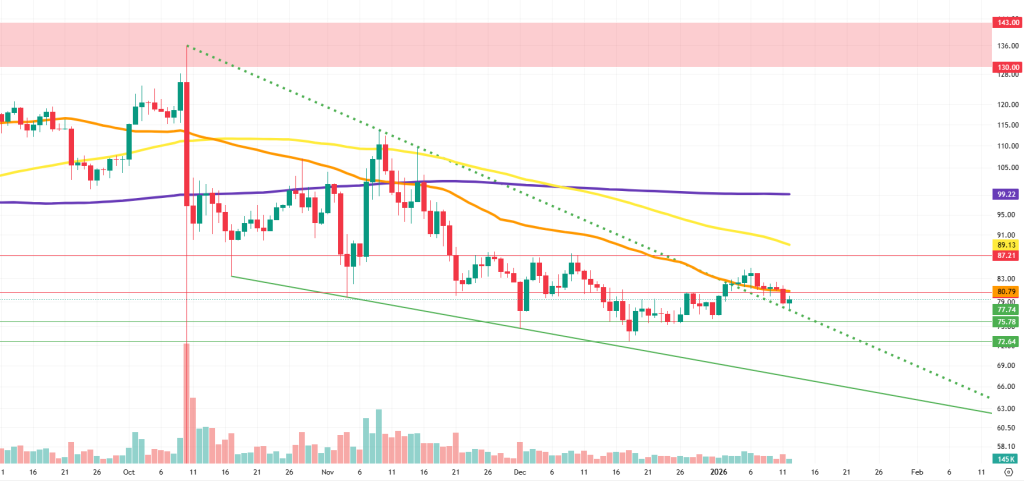
Looking at the daily candlestick chart, the Litecoin price is trading below the 100-period (yellow), 200-period (purple), and 50-period (orange) moving averages. This outlook is considered an indicator confirming that selling pressure continues.
In the event of a rise that could occur contrary to the general expectations of derivatives market participants, the first potential pause level is observed at the 80.79 horizontal resistance. The fact that this level also coincides with the 50-period moving average can be considered an indication of a potentially stronger selling pressure. In the event of a continued upward movement, the 87.21 horizontal resistance level, where the 100-period moving average is approaching, and then the 99.22 level, where the 200-period moving average passes, can be monitored as potential sell-off zones during the rise.
On the other hand, en the event of pullbacks that may occur due to prevailing expectations, the initial buying reaction is expected to come from the descending trend support. Although there is a high probability of a rebound from this falling dotted line, currently at 77.74, it is expected to have an upward push effect as long as there is no downward break. If this support is broken, the horizontal support at 75.78 below it stands out as a likely level to hold. Finally, if the price breaks through the first two supports mentioned and retreats to the previous low of 72.64, this area will be a decisive support level en terms of the main direction. Whether this level is maintained or not will indicate whether new lows will form or whether this level will be accepted as the bottom.
Supports: 77.74 – 75.78 – 72.64
Resistances: 80.79 – 87.21 – 99.22
LINK/USDT
In recent days, the US Securities and Exchange Commission (SEC) approved Bitwise’s Chainlink spot ETF application and announced that the fund could be traded el NYSE Arca under the ticker symbol “CLNK.”
Chainlink founder Sergey Nazarov shared his vision for 2026. He stated that the Genius Act and potential crypto regulations will accelerate tokenization, noting that Chainlink is working with various financial institutions, primarily the U.S. Department of Commerce, and emphasizing that Chainlink is at the forefront of tokenization.
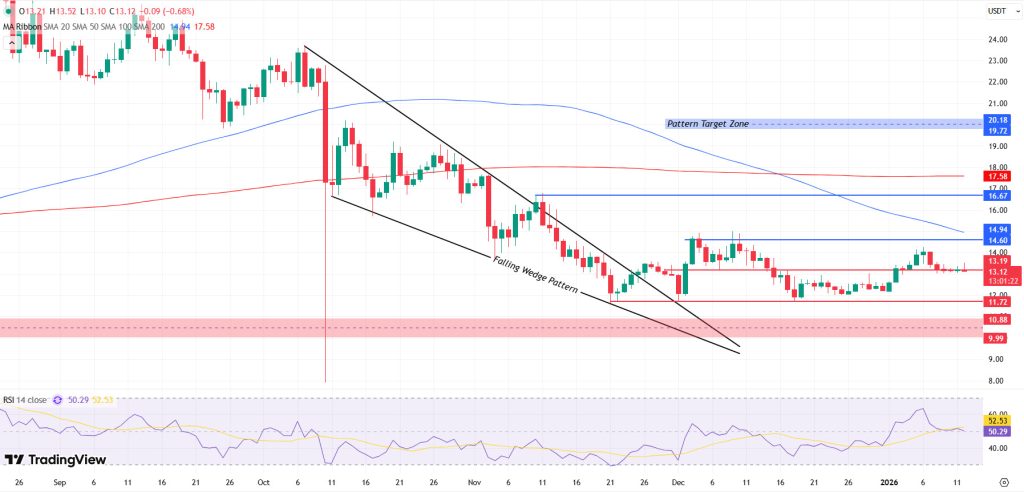
Technically speaking, we see a breakout en the falling formation we observed el the chart. On December 1, we see that the price received confirmation of the formation with its pullback to the $11.72 level. Subsequently, the price’s horizontal movement between $14 and $11 and its failure to lose support at the $11 level indicate that this area is a very strong demand zone.
Currently, the price is en the middle band of this horizontal movement zone. At this point, for the upward movement to continue, we first need to see demand form at the $13.16 support level, leading to a move towards the $14.60 resistance level, and this resistance needs to be broken with a high-volume candle. This level is a strong psychological barrier that the price has tested twice en the recent past but retreated under seller pressure. Therefore, breaking above this level is critical for triggering a sharp upward move.
Following this scenario, we can track the $16.67 intermediate resistance level marked el the chart, along with the $19.72–20.18 band, which is the theoretical target of the falling wedge formation, as the medium-term target zone.
In a downward scenario, the $11.72 level is a very strong support level. If this level is lost, the price could become much more fragile and selling pressure could increase. As a result of this pressure, we could see the price en the $10 region. The Relative Strength Index (RSI) is at 51 en positive territory. When monitored alongside the price, if this region is lost and our RSI level falls below 50, momentum may weaken and selling pressure may increase.
Supports: 11.72 – 10.88 – 9.99
Resistances: 13.19 – 14.60 – 16.67
SUI/USDT
This week, there were significant and noteworthy developments en the Sui (SUI) ecosystem. The daily trading volume increased por 97% to exceed $1.8 billion. This indicates a renewed interest en Sui among institutional and individual investors.
At the same time, Sui released the Mysticeti V2 Update, which increases transaction speeds and strengthens the network’s privacy layers. This update further optimizes the network’s transactions per segundo (TPS) efficiency.
Meanwhile, Mysten Labs has published a new report el new Sui privacy contracts to be integrated throughout 2026, aiming to attract the attention of corporate companies. This development is seen as a critical step, especially for corporate adoption.
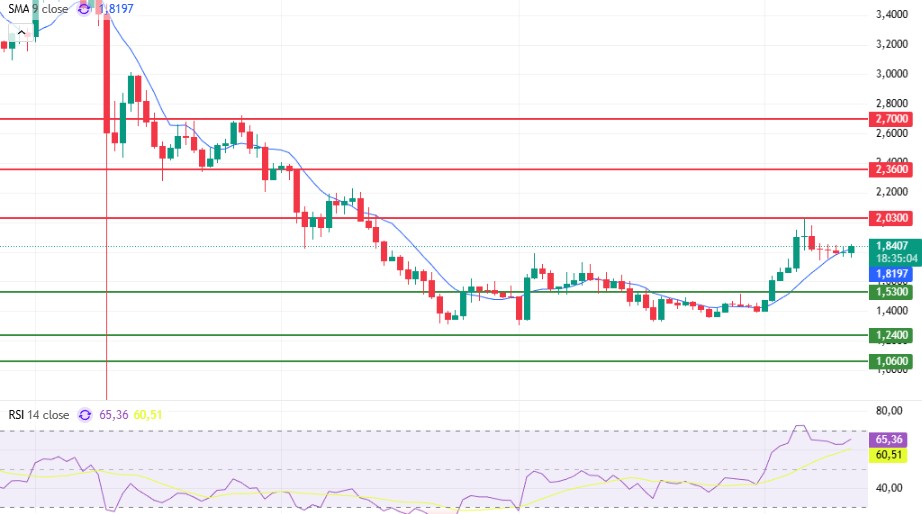
Looking at Sui’s technical outlook following recent developments, we see that the price has been moving sideways at around $1.84 el a weekly basis, influenced por fundamental developments. The Relative Strength Index (RSI) is currently en the range of 65.36 – 60.51. This range indicates that the market is trading close to the sell zone; however, the RSI continuing above the 40.00 – 45.00 range en these areas could signal a potential sell. If the price moves upward, the resistance levels of $2.03, $2.36, and $2.70 can be monitored. However, if the price falls to new lows, it may indicate that selling pressure could deepen. In this case, the support levels of $1.53, $1.24, and $1.06 come to the fore. Based el the trend line, a pullback to $1.53 appears technically possible. According to Simple Moving Averages (SMA) data, Sui’s average price is currently at $1.81. If the price remains above this level, it signals that the current uptrend could technically continue.
Support levels: 1.06 – 1.24 – 1.53
Resistances 2.03 – 2.36 – 2.70
ADA/USDT
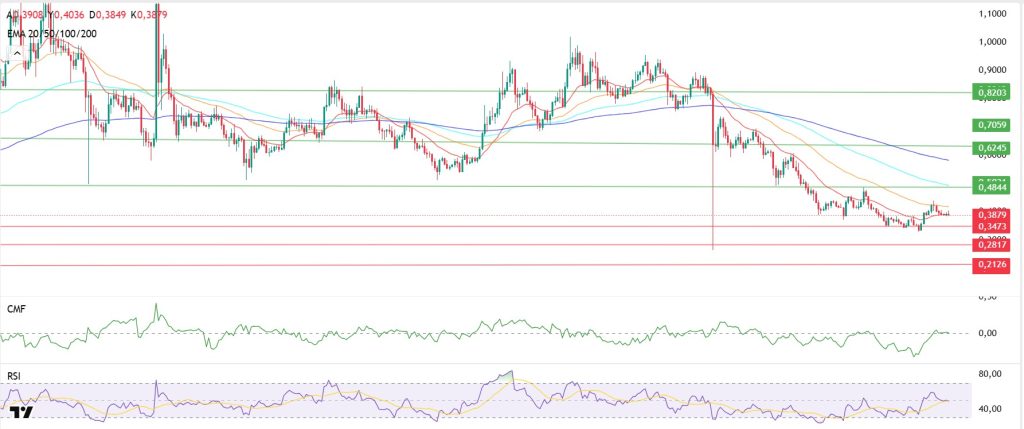
ADA has fallen por 3% since last week to $0.3849. Cardano’s futures trading volume increased por 27% this week to $47 million. This is a significant development, along with the increase en open positions, indicating the presence of investors trading en derivatives markets. Hoskinson appeared el the Wolf of All Street program el Sunday. He discussed Cardano’s roadmap for 2026. Reiterating his belief that this year will be decisive for ADA, he stated that Cardano has proven its scalability with Hydra’s 1 million TPS and the Ouroboros Leios upgrade. Hoskinson said this has resulted en a 60-fold improvement en the chain’s transaction volume.
Technically speaking, while the Relative Strength Index (RSI-14) has risen to 50 levels, it is giving a downtrend signal along with the Chaikin Money Flow (CMF-20). The decrease en cash inflows may keep the CMF en negative territory and indicate that selling pressure will continue. ADA broke the descending channel el the daily chart and is continuing its horizontal movement, reacting first within the band range of the 20 and 50-day Exponential Moving Average (EMA-Red Line) and (EMA-Orange Line). If there is an uptrend during the week, the 0.4844 and 0.6245 levels can be monitored as important resistance levels. This situation may indicate that the uptrend could continue en the medium term.
If there is a decline due to macroeconomic data or negative news related to the Cardano ecosystem, and if the price continues to remain below all moving averages, this may indicate a continuation of the downward trend. In this case, the $0.3473 to $0.2817 level can be monitored as a support point.
Supports: 0.2126 – 0.2817 – 0.3473
Resistances: 0.8203 – 0.6245 – 0.4844
Legal Notice
The investment information, comments, and recommendations contained en this document do not constitute investment advisory services. Investment advisory services are provided por authorized institutions el a personal basis, taking into account the risk and return preferences of individuals. The comments and recommendations contained en this document are of a general nature. These recommendations may not be suitable for your financial situation and risk and return preferences. Therefore, making an investment decision based solely el the information contained en this document may not result en outcomes that align with your expectations.