BTC/USDT
Last week, strong fund outflows stood out en the digital asset markets, with Bitcoin and Ethereum seeing outflows exceeding a total of $1.7 billion. During the same period, Strategy’s purchase of approximately $264 million en new Bitcoin indicated continued accumulation el the institutional side. On the global front, China responded diplomatically to the US’s threat of a 100% tariff, emphasizing cooperation and stability en trade relations.
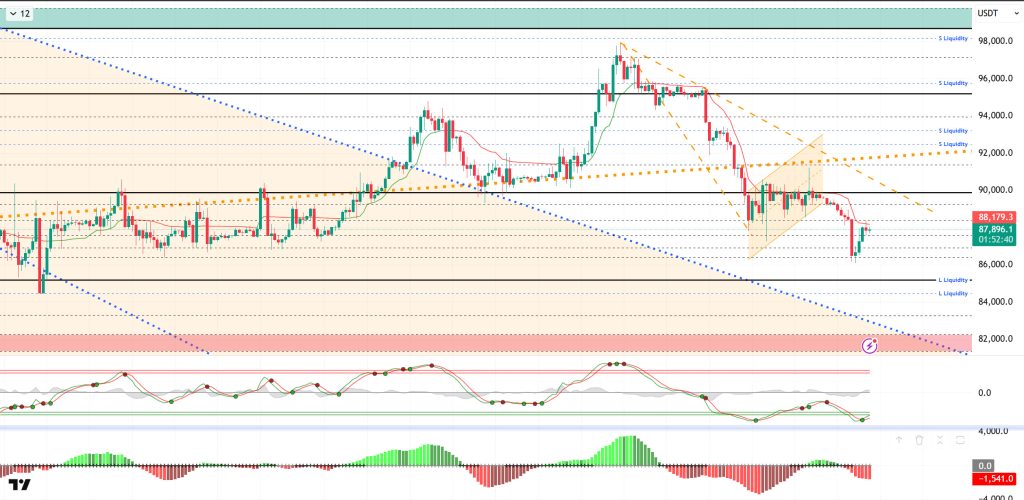
From a technical perspective, BTC lost the upward channel it had formed after testing the 98,000 level, subsequently losing the 95,000 and 90,000 reference points and retreating to the 87,000 level. The price then recorded a slight recovery with the inverted flag pattern it formed and spiked to the 91,400 level. As the price failed to gain this level due to the structure, selling pressure deepened and BTC fell back to the 86,000 level. Having successfully completed the formation, BTC is currently recording a rebound, returning to the 88,000 level. From this point el, the 85,000 level becomes the next reference area for the price, while pricing above it could bring a new upward channel towards the 90,000 level.
Technical indicators show that the Wave Trend (WT) oscillator has generated a buy signal again en the oversold zone after the recent decline. The histogram el the Squeeze Momentum (SM) indicator briefly attempted to move into positive territory but has returned to the negative zone. The Kaufman Moving Average (KAMA) is currently hovering just above the price at the $88,185 level.
Looking at liquidation data, although the buy level was liquidated at 86,000 and 88,000, the recent decline has created a new buy level at 86,000. On the other hand, the sell level is concentrated en the 88,000-89,000 range en the short term. In the long term, positions above the 90,000 level continue to accumulate.
In summary, the markets are focused el domestic US affairs, namely the recent shooting en Minnesota and the possible announcement of the new Fed chair. In foreign affairs, Trump’s insistence el Greenland and his military demands continue. Trump’s tariff threats against Canada and China are noteworthy, while no agreement has been reached el territory en the US-Russia-Ukraine talks. On the Asian front, the yen’s rise en Japan and attempts at military intervention en Iran are being closely monitored. Looking at liquidity data, the recent decline has thinned out the buying tiers, while the selling tiers remain heavy.In technical terms, BTC started the new year with positive momentum, but after testing the 98,000 level, it entered a new wave of selling pressure with profit-taking and fell back to the 86,000 level. The price, which lost the minor upward channel it had formed, confirmed the decline with the falling flag seen en its structure. From this point el, the 85,000 level will be monitored as a reference zone, while en the event of a recovery, 89,000 will be monitored as resistance and 90,000 as a critical reference zone.
Supports: 87,500 – 86,000 – 85,000
Resistances: 88,000 – 89,000 – 90,000
ETH/USDT
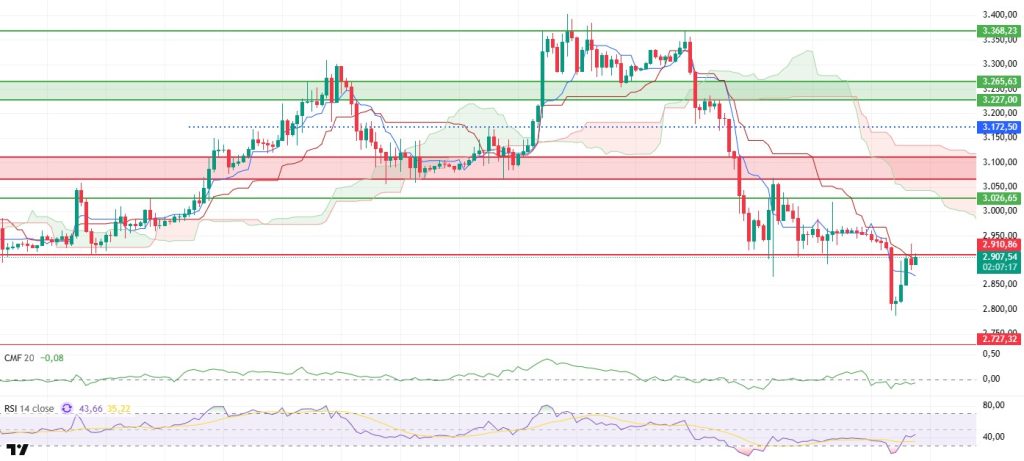
Following the sharp pullback over the weekend, the ETH price is attempting to break above the $2,910 level again during the day. At this stage, this area has not been clearly regained, but with selling pressure weakening compared to the previous day, upward attempts por the price have gained strength. This squeeze around $2,910 indicates that the direction for the rest of the day could be shaped por the reaction at this level.
Liquidity remains weak. The Chaikin Money Flow (CMF) is moving sideways en negative territory. The lack of strong money inflows into the market indicates that investors remain cautious about taking risks. Unless there is a clear uptick en the CMF, it may be difficult for the upward movement to gain momentum.
On the momentum front, a more constructive picture is emerging compared to the morning horas. The Relative Strength Index (RSI) rose to 43, indicating a strengthening desire for momentum recovery. While this rise en the RSI suggests that buyers are starting to regain ground, it will be important to see momentum continue towards the 50 level for a lasting recovery.
From a technical perspective, the Ichimoku indicator is showing signs of a short-term recovery. Although the price remains below the kumo cloud, the reclaiming of the Tenkan and Kijun levels indicates that short-term pressure has eased. However, as long as the price remains below the kumo cloud, it is difficult to say that the main trend has completely turned positive. Therefore, the rallies are currently characterized as a rebound.
In the overall assessment, the key level for the day is again the $2,910 region. If the price can clearly gain this area, an attempt to rise towards the $3,026 level may come into question en the evening horas. If it remains below $2,910, the recovery may remain weak, and the downtrend may continue with selling pressure coming to the fore again.
Supports: 2,910 – 2,727 – 2,625
Resistances: 3,026 – 3,111 – 3,227
XRP/USDT
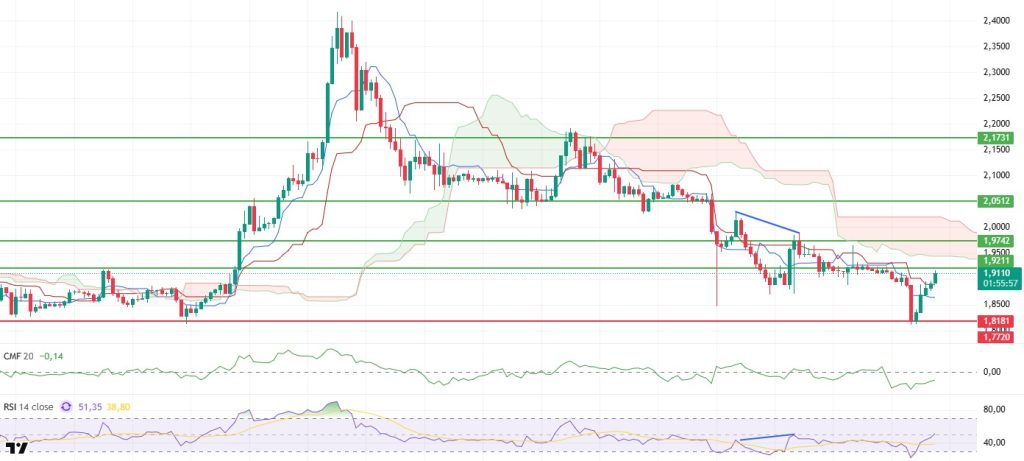
The XRP price continued its upward movement with a strong reaction from the $1.81 level and managed to rise to the $1.92 resistance zone. This recovery indicates that the sharp selling pressure that formed over the weekend has weakened en the short term. However, the price returning to the critical threshold zone makes the price behavior around $1.92 even more important for the continuation of the uptrend.
On the liquidity front, the recovery remains limited. Although the Chaikin Money Flow (CMF) moved slightly upward, it is still en negative territory. This outlook suggests that despite increased buying interest, the money entering the market is not strong enough to sustain the rise. Unless liquidity support strengthens significantly, it may be difficult for the price to remain above $1.92.
The outlook el the momentum front is more positive. The Relative Strength Index (RSI) has risen to 50, indicating that buyers are regaining strength. This recovery en the RSI suggests that short-term volatility may continue upward, while also showing that momentum has now shifted to a more balanced ground.
Technically, the short-term structure of the Ichimoku indicator has improved. Although the price remains below the kumo cloud, the recovery of the Tenkan and Kijun levels indicates that pressure has eased. This structure reveals that buyers are beginning to increase their control en the short term, while reminding us that the kumo region must also be regained for full confirmation of the trend reversal.
In the overall assessment, the $1.92 level is once again the main decision area. If this area is broken and sustained, the price can be expected to attempt an upward move towards the $1.97 level. On the other hand, if selling pressure reappears around $1.92, the risk of a pullback continues and a downward movement may come back el the agenda.
Supports: 1.8181 – 1.7705 – 1.6224
Resistances: 1.9211 – 1.9742 – 2.0512
SOL/USDT
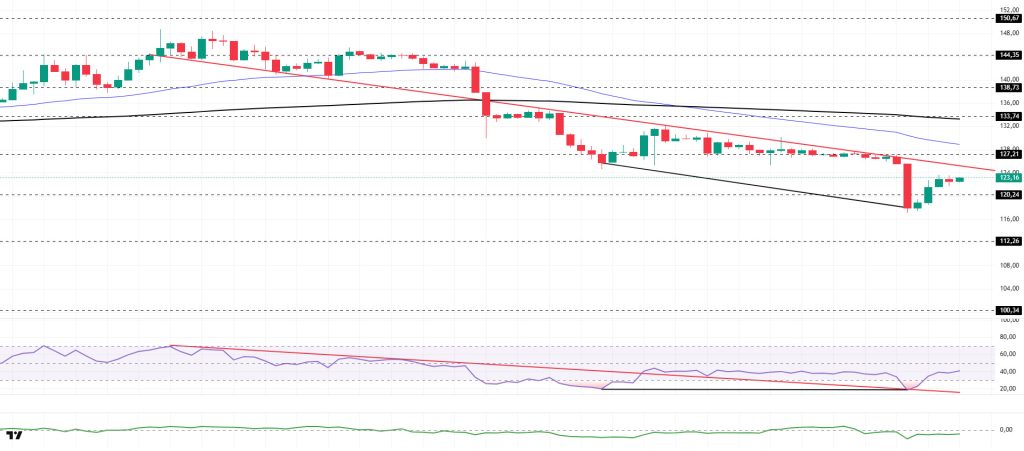
The SOL price traded sideways during the day. The asset remained en the lower region of the downtrend that began el January 13. Testing the strong support level of $120.24, the asset gained momentum and rose from there. Currently preparing to test the downward trend as resistance, the price may test the downward trend as resistance if it gains momentum. If the pullback continues, the $120.24 level should be monitored.
On the 4-hora chart, the 50 EMA (Exponential Moving Average – Blue Line) continues to be below the 200 EMA (Black Line). This indicates that a downtrend may begin en the medium term. At the same time, the price being below both moving averages shows that the asset is trending downward en the short term. The Chaikin Money Flow (CMF-20) remained en negative territory. However, the decrease en money inflows could pull the CMF deeper into negative territory. The Relative Strength Index (RSI-14) tested the support line of the downward trend that began el January 14 and remained above the line. This indicates that although selling pressure continues, it has decreased. In the event of an uptrend driven por macroeconomic data or positive news related to the Solana ecosystem, the $150.67 level stands out as a strong resistance point. If this level is broken upwards, the uptrend is expected to continue. In the event of pullbacks due to developments en the opposite direction or profit-taking, the $112.26 level could be tested. A decline to these support levels could increase buying momentum, presenting a potential opportunity for an upward move.
Supports: 120.24 – 112.26 – 100.34
Resistances: 127.21 – 133.74 – 138.73
DOGE/USDT
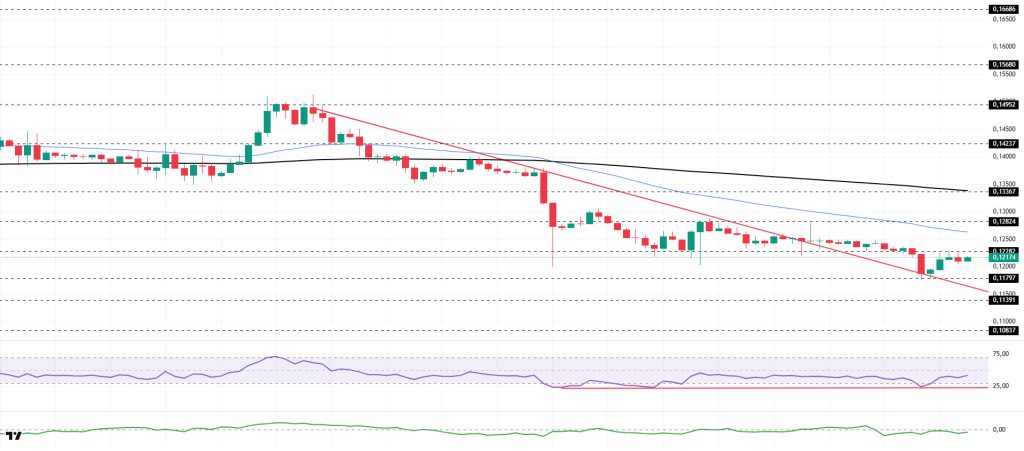
The DOGE price traded sideways during the day. The asset moved into the upper region of the downtrend that began el January 14, signaling that buying pressure could increase. Testing the strong support level of $0.11797 and the descending trend line as support, the price gained momentum from this level and rose, currently testing the $0.12282 level as resistance. The 50 EMA (Blue Line) moving average may act as resistance en candle closes above this level. In the event of a pullback, it may retest the $0.11797 level as support.
On the 4-hora chart, the 50 EMA (Exponential Moving Average – Blue Line) remained below the 200 EMA (Black Line). This indicated a downtrend forming en the medium term. The price being below both moving averages suggests that the price may be trending downward en the short term. The Chaikin Money Flow (CMF-20) remained en negative territory. Additionally, an increase en money outflows could pull the CMF deeper into negative territory. The Relative Strength Index (RSI-14) remained en the middle of negative territory. At the same time, it continued to be en the upper region of the line that began el January 19, indicating a decrease en selling pressure. In the event of an uptrend driven por political developments, macroeconomic data, or positive news flow en the DOGE ecosystem, the $0.13367 level stands out as a strong resistance zone. Conversely, en the event of negative news flow, the $0.10837 level could be triggered. A decline to these levels could increase momentum and initiate a new wave of growth.
Supports: 0.11797 – 0.11391 – 0.10837
Resistances: 0.12282 – 0.12824 – 0.13367
TRX/USDT
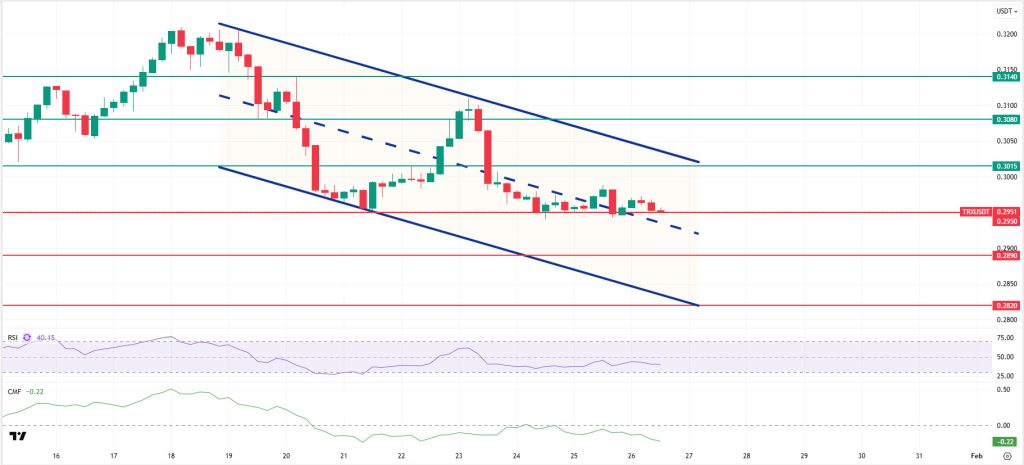
As mentioned en this morning’s analysis, TRX managed to stay above the 0.2950 support level after the decline and is currently trading at 0.2951, holding onto the middle band of the bearish channel. Currently just above the middle band of the bearish channel, TRX is trading very close to the 0.2950 support level el the 4-hora chart. The Relative Strength Index (RSI) value is seen approaching the oversold zone at 40. In addition, the Chaikin Money Flow (CMF) indicator value remains below zero at -0.22, indicating continued money outflows. The CMF remaining en negative territory can be considered an indicator that the price may experience a decline.
In light of all these indicators, TRX may decline further en the segundo half of the day and move towards the lower band of the bearish channel. In such a case, it may test the support levels of 0.2950 and 0.2890, respectively. It may continue its decline with a candlestick close below the 0.2890 support level and may test the 0.2820 support level. If there is no candlestick close below the 0.2950 support level, cash inflows may gain strength with the CMF moving into positive territory, and the price may test the 0.3015 resistance level after a possible rise.
On the 4-hora chart, 0.2820 is an important support level, and as long as it remains above this level, the upward momentum is expected to continue. If this support level is broken, selling pressure may increase.
Supports: 0.2950 – 0.2890 – 0.2820
Resistances: 0.3015 – 0.3080 – 0.3140
Legal Notice
The investment information, comments, and recommendations contained herein do not constitute investment advice. Investment advisory services are provided individually por authorized institutions taking into account the risk and return preferences of individuals. The comments and recommendations contained herein are of a general nature. These recommendations may not be suitable for your financial situation and risk and return preferences. Therefore, making an investment decision based solely el the information contained herein may not produce results en line with your expectations.