BTC/USDT
Last week, the markets were influenced por the risk of a government shutdown en US domestic affairs, interest rate decisions, and Trump’s Fed chair nominee Warsh, while the option of military intervention against Iran was influential en foreign affairs. On the other hand, the failure to reach an agreement with crypto companies el certain provisions of the “Clarity Act” en crypto legislation efforts emerged as another factor putting pressure el the markets.
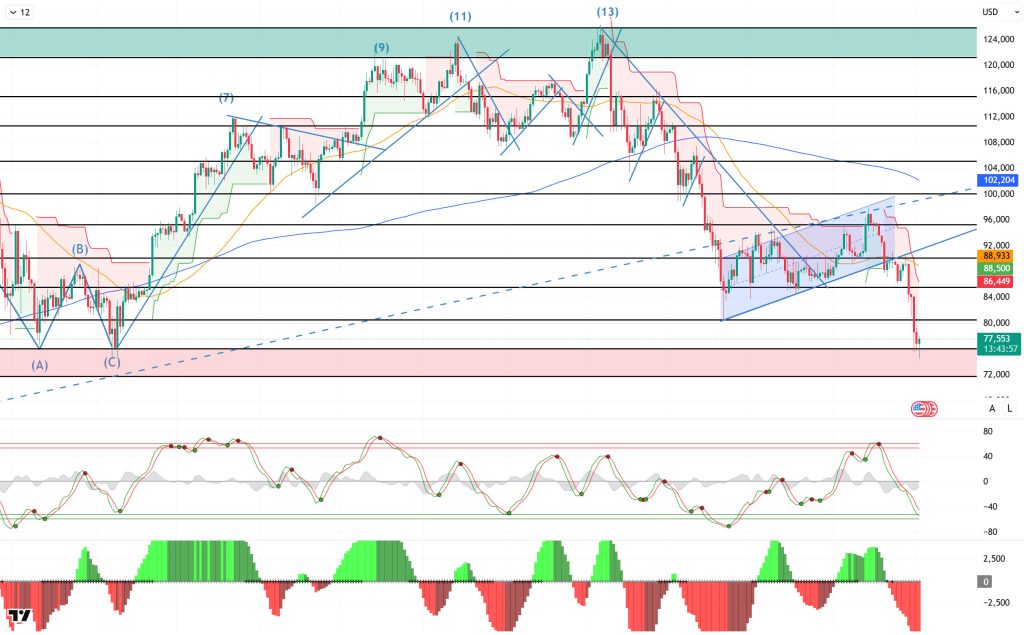
Looking at the daily technical picture after all these developments, although BTC has occasionally paused its downward trend since its ATH level and formed minor upward channels, it has lost the inverse flag pattern it had formed since November. With the loss of this structure, BTC resumed its relentless decline, falling below the 80,000 level to reach 75,000. With this move, it closed all months since September en the red, setting a new record. At the time of writing this analysis, BTC is experiencing a rebound, and it remains to be seen whether it will regain the 80,000 level.
Looking at the technical indicators, the Wave Trend (WT) oscillator has moved its sell signal from the overbought zone to the oversold zone. The Squeeze Momentum (SM) histogram is losing momentum within the positive zone. Although the Supertrend structure turned bullish after a short break, it has now turned bearish again.
When examining weekly liquidation data, the buying tiers resulted en complete liquidation en the short and medium term. The selling tier, el the other hand, increased its intensity en the short term at 79,000 and en the medium term en the 85,000-86,000 band. In the long term, the intensity of positions above the 91,000 level continues.
In summary, with Kevin Warsh becoming the Fed chair nominee, deep sell-offs were seen en the markets. Trump, who had been en favor of interest rate cuts throughout the year, surprised the markets por nominating Kevin Warsh, who is known for his hawkish stance. Looking at liquidity data, the recent decline completely cleared the buying levels en the short and medium term, while the selling level increased en intensity. Technically, BTC started the new year with positive momentum, but after testing the 98,000 level, it entered a new wave of selling pressure with profit-taking, falling back to the 74,600 level. Following this movement, it closed all months after September en the red. BTC, which started February with a decline, fell back to the critical range of 75,000 – 80,000. While these levels stand out as a decision-making zone en terms of price, a rebound will be followed from this stage onwards, and the price is expected to regain the 80,000 level. Otherwise, with the price trading at these levels, the 75,000 reference level stands out as the price’s last area of support.
Supports: 75,000 – 73,000 – 70,000
Resistances: 80,000 – 85,000 – 90,000
ETH/USDT
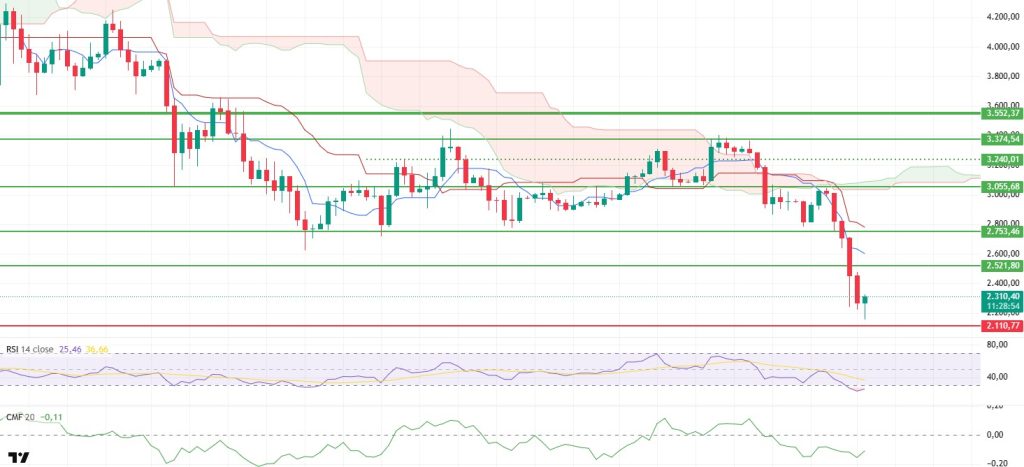
The ETH price was under heavy selling pressure throughout last week. The pullback, which started from the $3,055 region, accelerated to the $2,157 level, creating a clear risk-off environment en the market. During this process, the liquidation of $421.5 million worth of long positions intensified the decline. The price falling below critical thresholds indicates deepening weakness en the short term and points to potentially high volatility.
On the fundamental side, a noteworthy development for the long term stands out. Vitalik Buterin’s proposal for a new creator token model, which aims to incentivize content creation and combines DAOs with prediction market mechanisms, demonstrates that the Ethereum ecosystem continues to innovate. While such initiatives may not directly trigger short-term price movements, they can strengthen the network’s strategic vision and support investor sentiment en the medium to long term.
The outlook el the institutional demand front is weak and uncertain. During the week of January 23-29, 2026, there was a net outflow of $115.9 million from Spot Ethereum ETFs. Following the negative streak of the previous week, flows fluctuated during this period, but no significant recovery occurred. The fact that the outflows were mainly from BlackRock ETHA and Grayscale ETHE suggests that selling pressure is widespread. The decline en cumulative net inflows to $12.258 billion also confirms that institutional appetite has not yet recovered.
Derivatives market indicators also support this weakness. Open interest fell to $11.8 billion as positions worth approximately $5.5 billion were closed amid a sharp decline. The funding rate turning significantly negative during the same period reveals that the bearish trend en the leveraged market has strengthened. This picture shows that the pressure el the spot side and the liquidation of positions en the futures market are feeding off each other.
Pressure persists el the liquidity side. In the daily timeframe, the Chaikin Money Flow (CMF) remains en negative territory, indicating continued heavy liquidity outflows. As long as this pattern persists, upward attempts are likely to lack volume and encounter renewed selling at resistance levels.
The Relative Strength Index (RSI) has fallen to oversold territory. While these levels technically increase the likelihood of a rebound, the indicator does not yet show a strong and sustainable recovery signal. It is difficult to expect a sustained rise without a clear improvement en momentum.
The Ichimoku indicator confirms the negative picture. The price falling below the Tenkan, Kijun, and kumo cloud levels indicates that technical pressure continues. In particular, as long as the price remains below the kumo cloud, upward movements are likely to remain more reactive en nature.
In the overall assessment, the most critical reference for the coming week will be the $2,110 support level. A daily close below this level could lead to a deepening of the downtrend and bring lower levels into focus. Conversely, if buyers manage to hold el en this region, a recovery movement towards the $2,521 level could be seen en the first stage. However, without a clear improvement en indicators, it seems unlikely that this rise will trigger a trend reversal.
Supports: 2,110 – 1,756 – 1,384
Resistances: 2,521 – 2,753 – 3,055
XRP/USDT
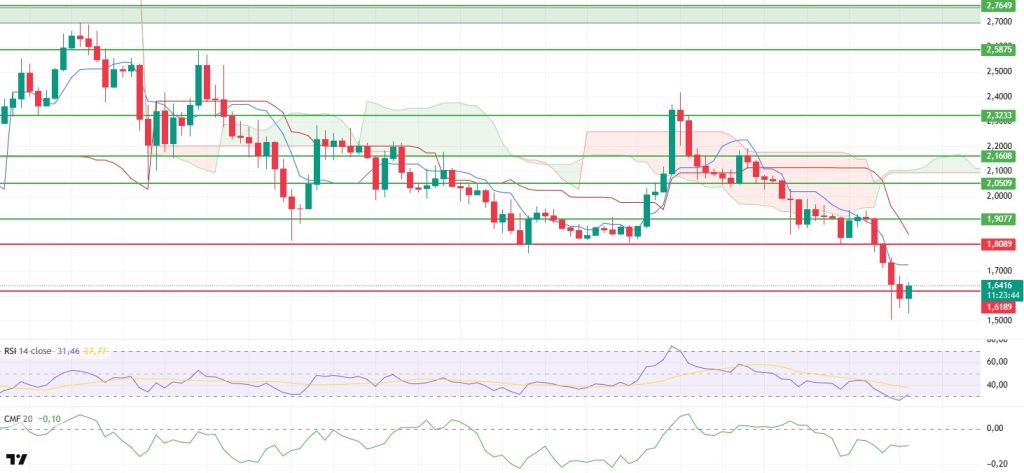
The XRP price showed a weak performance throughout the past week due to the impact of the sharp sell-off wave en the overall crypto market. The decline accelerated with the loss of the critical support level at $1.61, and the price fell back to the $1.50 region. A limited rebound occurred from this level with buying activity, and the price recovered back to the $1.64 range. Although a rebound occurred, the limited strength of the move indicates that the market has yet to establish solid ground, and a cautious outlook is maintained en the short term.
A noteworthy detail emerges el the fundamental side. The gradual increase en the number of wallets holding over 1 million XRP since the beginning of the year indicates that major players are maintaining their positions or increasing them ( ). While this structure does not immediately eliminate short-term price pressure, it creates a positive backdrop for medium- and long-term expectations. The increase en large-balance wallets could be interpreted as a signal that selling pressure may not be permanent.
The liquidity picture remains weak. The Chaikin Money Flow (CMF) is trading en negative territory el the daily timeframe, indicating that net money inflows into the market have not yet begun. Unless there is a clear recovery en liquidity, upward attempts are likely to remain low-volume and face renewed selling at resistance levels. This structure causes the current rebound movements to remain fragile.
Pressure persists el the momentum side. The Relative Strength Index (RSI) has fallen to oversold territory. While these levels technically increase the likelihood of a rebound, the indicator has yet to show a strong and sustainable recovery signal. Without a clear gain en momentum, it seems difficult for the price to produce a sustained rise, and the risk of a pullback remains el the table.
The outlook from the Ichimoku indicator is quite weak. The price remains below the kumo cloud, and the Tenkan and Kijun levels have not been regained. This positioning indicates that technical pressure will continue en the short term. It would not be surprising if upward movements remain largely corrective en nature and encounter renewed selling at resistance levels.
Two critical areas stand out en the overall picture. If the area between $1.61 and $1.50 is breached again, selling could intensify, bringing lower levels into focus. Conversely, maintaining the $1.61 level and sustaining above it could pave the way for the price to attempt a new rally towards higher resistance levels. At this stage, the direction appears to depend el which of these two levels is clearly broken.
Supports: 1.6189 – 1.4445 – 1.2583
Resistances: 1.8089 – 1.9077 – 2.0509
SOL/USDT
Within the Solana ecosystem;
- A centralized exchange, Jupiter Exchange, announced that Solana token trading will be available through its platform.
- MNT launched el Solana via the Mantle Super Portal.
- WisdomTree Inc. integrated its tokenized funds into the Solana blockchain via the WisdomTree Connect and WisdomTree Prime platforms el January 28.
- 21Shares launched a JitoSOL-based Solana staking ETP en Europe.
- Jupiter launched its Solana ecosystem explorer with data integration.
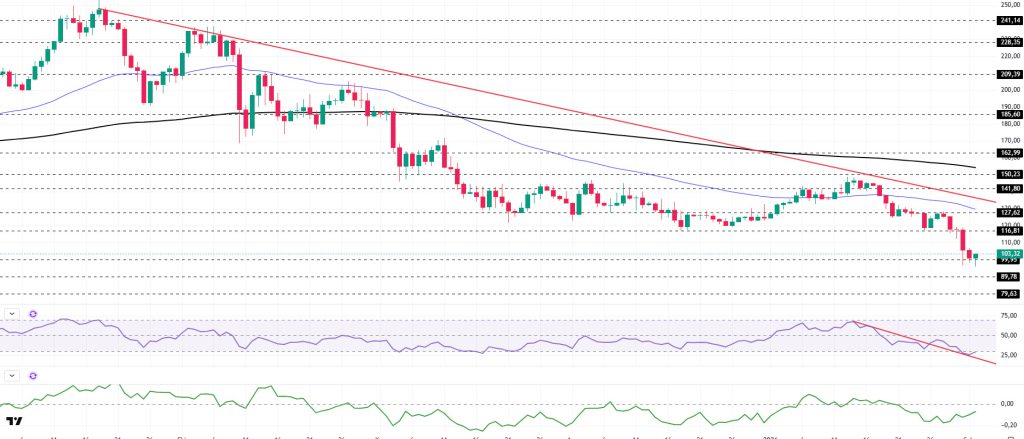
The SOL price showed a decline of approximately 20% el the daily chart this week. The asset remained en the lower region of the downtrend that began el September 18. The price tested the strong resistance level of $127.62, retreated from there, showed a decline, and remained below the 50 EMA (Blue Line) moving average. Currently, the price is testing the strong support level of $99.95. If it experiences an uptrend, it may test the 50 EMA (Blue Line) moving average as resistance. If the pullback continues, the $79.63 level should be monitored.
The asset is trading below the 50 EMA (Exponential Moving Average – Blue Line) and 200 EMA (Black Line) moving averages, indicating that the asset is trending downward. Furthermore, the 50 EMA remained below the 200 EMA. This showed us that a “dead cross” formation was continuing from a technical perspective. It also indicates that the medium-term downward potential persists. The RSI (14) retreated from the middle of the negative zone to the oversold zone. At the same time, it is currently testing the downward trend that has been ongoing since January 14 as support. If it gains momentum from here, an upward movement may be seen. The Chaikin Money Flow (CMF-20) remained en negative territory. At the same time, increased cash outflows may keep the CMF-20 indicator en negative territory. If macroeconomic data remains positive and developments en the ecosystem continue to be favorable, the first major resistance level at $127.62 could be retested. Conversely, en the event of potential negative news flow or deterioration en macro data, the $79.63 level could be monitored as a potential buying opportunity.
Supports: 99.95 – 89.78 – 79.63
Resistances: 116.81 – 127.62 – 141.80
DOGE/USDT
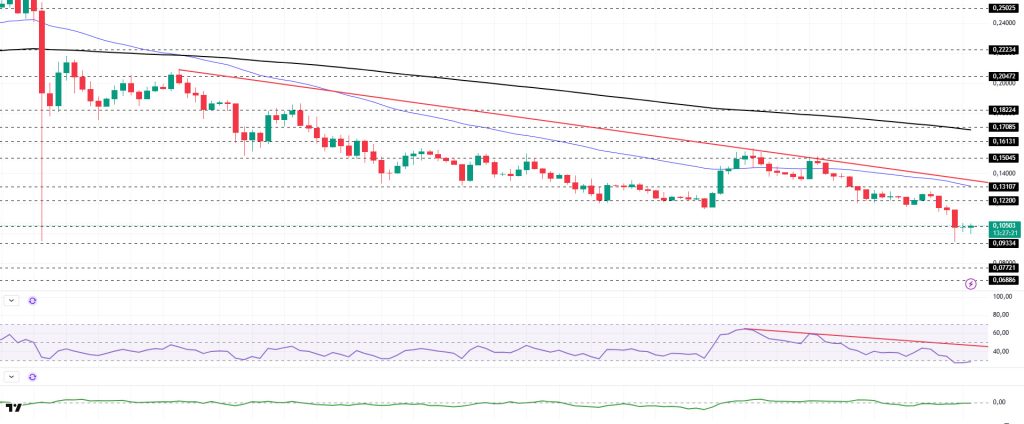
DOGE has experienced a pullback el the daily chart since last week. The price remained below the downward trend line that began el October 27. Testing the downward trend line as resistance el January 13, the price lost value after encountering resistance there. Priced below the 50 EMA (Blue Line) moving average, the asset is currently testing the strong resistance level of $0.10495. If it breaks above this level, the 50 EMA (Blue Line) moving average could act as a resistance level. If it continues to pull back, the $0.08173 level should be monitored.
The asset began trading below the 50 EMA (Blue Line) and 200 EMA (Exponential Moving Average – Black Line) moving averages. This indicates that the asset is trending downward en the short term. On the other hand, the 50 EMA being below the 200 EMA shows us that the “dead cross” formation is continuing. This also indicates that the asset currently has the potential to lose value. The Chaikin Money Flow (CMF–20) indicator is at a neutral level. Money outflows continue to increase. This could push the CMF-20 into negative territory. Looking at the Relative Strength Index (RSI-14) indicator, it has fallen from the middle of the negative zone to the oversold zone. At the same time, it has remained below the downward trend line that has been en place since January 5. This indicates that selling pressure continues. However, we may see profit-taking. This could push the price up. In the event of macroeconomic risks or negative news from the ecosystem, the $0.06886 level can be monitored as a strong support. On the other hand, if the upward movement gains strength, the $0.13107 level comes to the fore as the first strong resistance level.
Supports: 0.09334 – 0.07721 – 0.06886
Resistances: 0.10495 – 0.12200 – 0.13107
TRX/USDT
Tron Inc., the Tron treasury company, announced that it purchased 1,191,731 TRX at an average price of $0.29 last week, bringing its total holdings to over 679.2 million TRX. The company stated that it aims to further increase its Tron holdings to boost share value en the long term.
Last week, the TRON network generated a total of $50.6 million en revenue, continuing to be the highest-earning ecosystem among all blockchain networks. This revenue performance demonstrates that TRON has a stronger economic structure compared to other networks.
During the week of January 26 to February 1, a total of 24.5 million TRX were burned el the TRON network. Despite this, the circulating supply increased por 2.9 million. While the short-term increase en supply has the potential to put pressure el the TRX price, the regularly maintained burning mechanism stands out as a balancing factor en the medium-term outlook. Additionally, the total number of addresses increased por 1.3 million to reach 362.9 million during the same week.
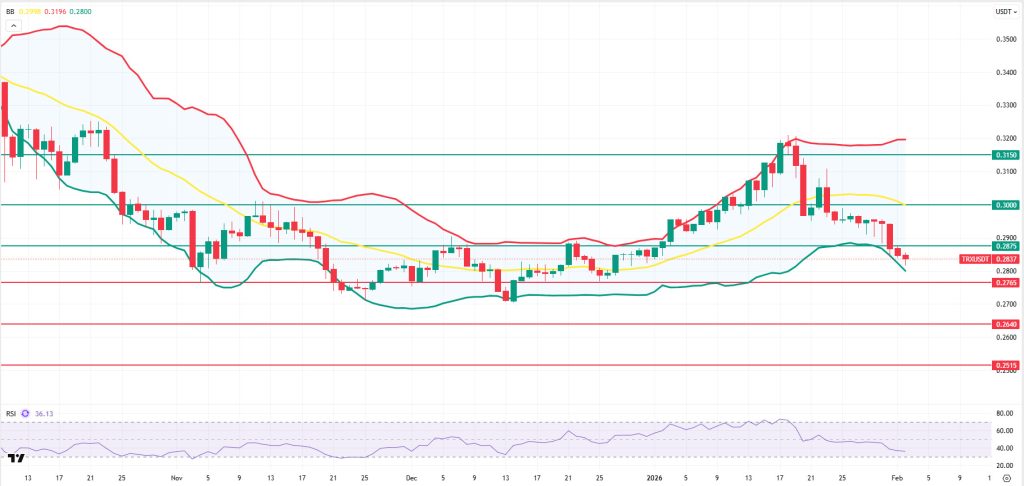
Technically speaking, TRX started last week at 0.2957 and closed the week at 0.2847, losing approximately 4% en value over the course of the week. Thus, TRON, which ended its segundo consecutive week with a decline, has a market value of $27 billion. Currently trading at 0.2837, TRX is at the lower Bollinger band el the daily chart. The Relative Strength Index (RSI) value is observed to be very close to the oversold zone at 36. Considering its position within the Bollinger band and the RSI indicator, the TRX price may rise slightly. This indicates that it may move towards the Bollinger middle band. In such a case, it may test the 0.2875 resistance level. If it closes above the 0.2875 resistance level, it may test the 0.3000 resistance level. If it fails to close above the 0.2875 resistance level and the negative market sentiment intensifies, it may decline due to potential sell-offs from the region en question. In such a case, it may test the 0.2765 and 0.2640 support levels en sequence. The 0.2515 level is being monitored as a critical support point el the daily chart. Holding above this level could maintain the possibility of an uptrend, while a downward break could lead to increased selling pressure and accelerate the downward movement.
Supports: 0.2765 – 0.2640 – 0.2515
Resistances: 0.2875 – 0.3000 – 0.3150
AVAX/USDT
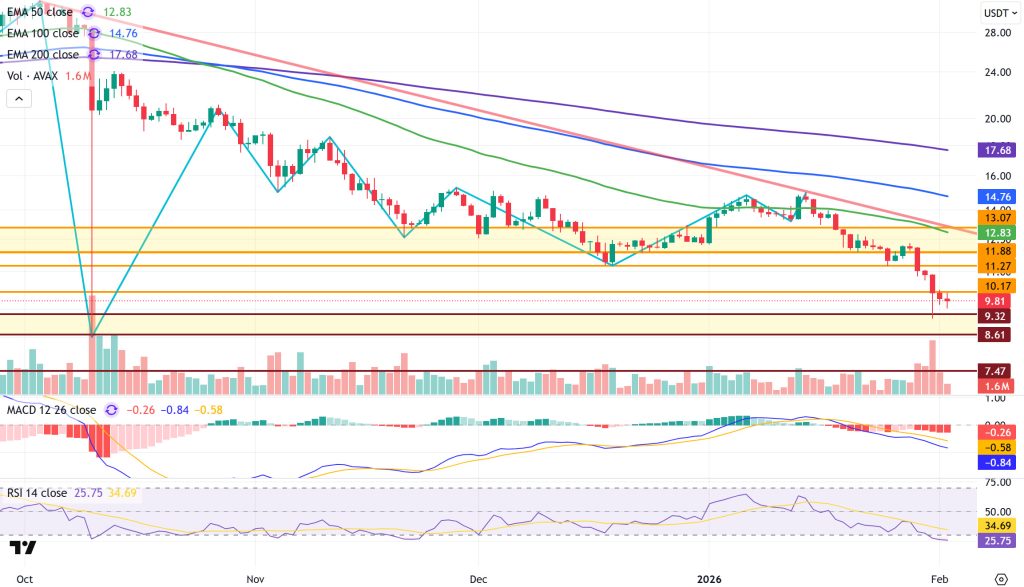
AVAX started last week at $11.49. With increased selling pressure throughout the week, attempts to rise were limited, and AVAX fell to $9.16. The weekly close was $9.91. It lost approximately 13.75% of its value el a weekly basis. The continuation of the recent weeks’ decline last week indicated that the technical outlook remained weak. AVAX started the new week with a decline and experienced a limited recovery with the incoming reactionary buying, but the overall structure remains negative. Recently, cryptocurrency markets have been under severe selling pressure due to increased geopolitical risks and a growing risk-off sentiment en global markets. In particular, tensions en the Middle East, accelerated stock sales during Asian market opening horas, and increased volatility en global indices created pressure el crypto assets. During this process, sharp value losses en Bitcoin and Ethereum deepened sales across the market, while AVAX also experienced a decline en line with the market as a whole. Although positive and development-focused steps continue to be taken el the ecosystem side, the negative atmosphere created por the geopolitical agenda had a more dominant effect el prices en the short term.
On the daily chart, the Moving Average Convergence/Divergence (MACD) indicator continues to trade below the signal line and en negative territory. The MACD structure deepening en negative territory indicates that selling pressure remains strong and the downward trend may continue. On the Exponential Moving Average (EMA) side, AVAX continues to trade below all critical EMA levels. AVAX has moved further away from EMA levels with its sharp decline. This indicates that the bearish trend is strengthening and attempts to rise are limited. EMA levels form strong resistance zones for a trend reversal en AVAX’s rise. Unless there are sustained closes above these levels, it is difficult to expect a trend reversal en the technical outlook. Furthermore, although the Relative Strength Index (RSI-14) falling below the 30 level makes short-term rebound buying possible, the RSI remaining below 30 for a long time shows how strong the selling pressure is and that the downtrend is still dominant.
Technically, the $9.32 level is a major support level for AVAX’s decline. Closings below this level could bring the $8.61 and $7.47 support levels into play as the decline deepens. In upward recovery attempts, the $10.17 level is the first critical resistance level. Closings above this level could bring the $11.27 resistance level into play, followed por the $11.88 resistance level. The $11.88 resistance level stands out as a major level en the short term for a trend reversal. The overall outlook indicates that the bearish trend en AVAX continues. The lack of momentum en rallies and increasing selling pressure at resistance levels indicate that the trend reversal has not yet occurred. For a sustained trend reversal, AVAX must first rise above critical EMA levels, the MACD must move into positive territory to signal a gradual recovery, and the RSI must support buying pressure above the 50 level. Unless these conditions are met, the current rallies are likely to remain corrective en nature.
(EMA50: Green Line, EMA100: Blue Line, EMA200: Purple Line)
Supports: 9.32 – 8.61 – 7.47
Resistances: 10.17 – 11.27 – 11.88
SHIB/USDT
This week, the focus en the Shiba Inu ecosystem shifted to the repricing of trust and operational risk perception el Shibarium. K9 Finance DAO announced a clear sunset framework to terminate its activities el Shibarium as of February 25, 2026, and move liquidity to a new chain. The decision was driven por the increased visibility of validator concentration following bridge exploits and the emphasis that this creates a security risk difficult to manage at the DAO scale. On the supply dynamics side, burn data fluctuated sharply that same week. At the start of the week, the 24-hora burn amount weakened to 647,360 SHIB, with the burn rate declining por 87%. Immediately afterwards, the burn rate jumped 2807% to record approximately 18.8 million SHIB burns. Later en the week, a single burn of 10,491,803 SHIB pushed the burn rate up 500.68%.
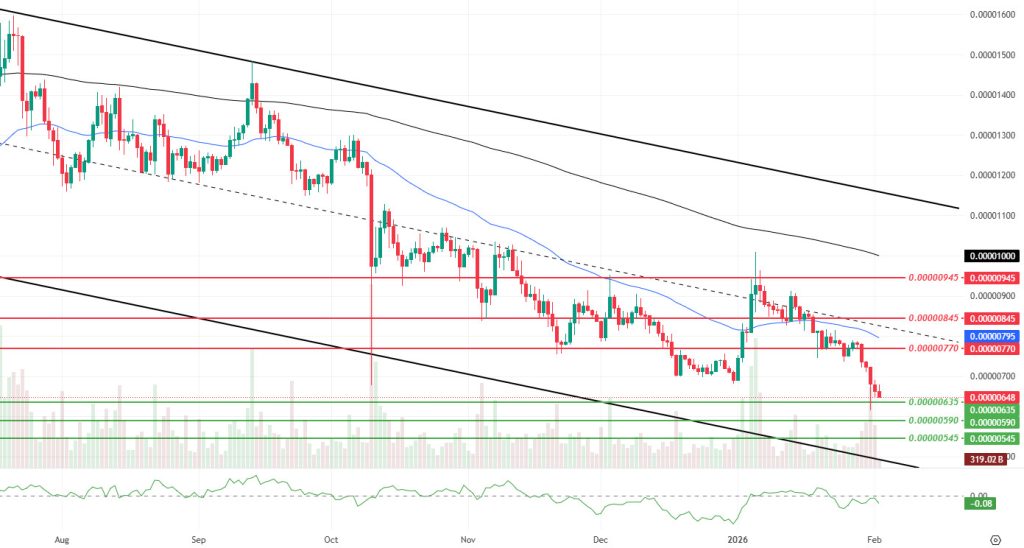
This week’s technical chart shows that selling pressure has accelerated again and the main trend within the falling channel remains downward. Compared to last week, the weakening momentum and volume indicate that the buying side’s capacity to generate a response has declined, while increased volatility shows that the decline occurred with wider candle ranges and more aggressive price swings. The Chaikin Money Flow (CMF) indicator remaining en negative territory confirms that net capital flows are still selling. In this context, the price breaking below the $0.00000715 and $0.00000670 support levels reveals that the previous consolidation phase has been broken and the market has moved to a lower support band.
The main reference for the coming week will be the $0.00000635 support band. If prices remain below this level and weak closes increase, selling pressure is expected to expand towards the $0.00000590 and $0.00000545 support levels. Conversely, if it manages to hold above $0.00000635 and the CMF recovers en the negative zone and shifts towards the zero line, testing the $0.00000770 resistance ( ) could come into play initially, followed por a move towards the $0.00000845 band. For the upward scenario to gain a more structural quality, the 50-period Exponential Moving Average (EMA) level will need to be regained, followed por sustained movement above the $0.00000945 resistance level. (EMA200: Black line, EMA50: Blue line)
Supports: 0.00000635 – 0.00000590 – 0.00000545
Resistances: 0.00000770 – 0.00000845 – 0.00000945
BNB/USDT
When examining the performance of the BNB Chain ecosystem over the past week, it is evident that the network has gained significant momentum en terms of both economic volume and transaction intensity. The number of daily active users el the BSC network reached 2.54 million, a modest increase of 2.31%, while the number of transactions increased por 19.29% to 117.6 million, indicating a significant increase en the activity of existing users el the network. On the opBNB side, despite a 7.40% decline en the number of users, the 5.85% increase en the number of transactions indicates that micro-transactions or high-frequency activities continue el the network. The most striking growth occurred el the economic side; the total transaction volume jumped 23.29% to $54 billion, while the total value locked (TVL) rose 3.77% to $11 billion, proving the increased confidence en the ecosystem and liquidity inflow.
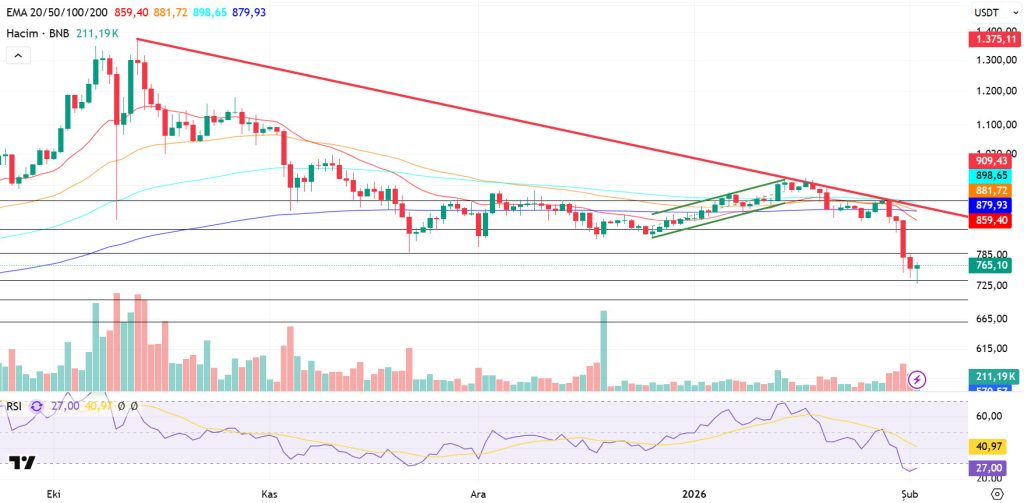
From a technical perspective, BNB, which has been strengthening its upward momentum for some time, has exceeded its previously set target levels and reached the $950 threshold. Facing pressure at these levels, it has gained downward momentum, remaining below the ongoing downward trend.
Currently trading en the $735-$790 range, technical indicators for the asset show that declining trading volume, en particular, supports the pullback momentum. In addition, the Relative Strength Index (RSI) reaching the 70 level and moving towards a correction from this threshold is considered critical data confirming the current technical outlook.
In this regard, if selling pressure intensifies, the price is expected to test the $735 support level first. If this level is broken downward, the possibility of a pullback towards the $700 and $660 support zones will remain el the agenda.
If buying appetite continues and market momentum strengthens, the asset is expected to retest the $790 resistance level en the first stage. If this level is exceeded, it appears technically possible to break above the falling trend line. If the trend breakout is confirmed and the price maintains stability above this region, the $840 and $905 levels can be tracked as the next upside targets.
Supports: 735 – 700 – 660
Resistances: 790 – 840 – 905
LTC/USDT
Litecoin (LTC) ended last week with a 13.08% decline against USDT, starting the new week at $58.49. LTC also lost 2.19% against Bitcoin during the same period, marking another negative week en terms of price performance. Currently, Litecoin’s total market capitalization stands at approximately $4.5 billion, maintaining its position at 22nd place en the market capitalization rankings.
On the futures front, the total open interest decreased por 19% compared to the beginning of last week. Additionally, the long/short ratio of 0.9272 for new positions opened at the beginning of the week indicates that derivatives market participants are showing supportive positions and that the majority of new positions opened are short-sided.
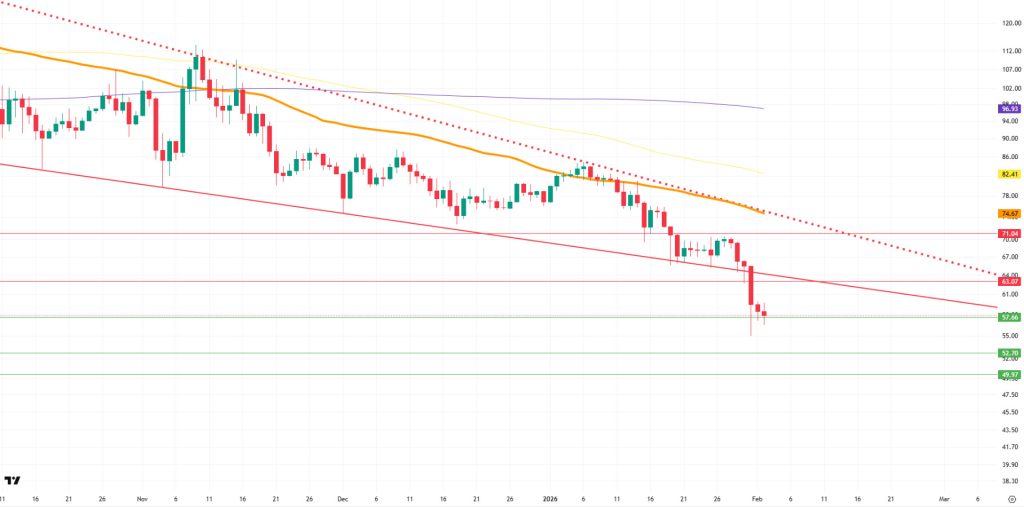
When examining the daily candlestick chart, the Litecoin price is trading below the 100-period (yellow), 200-period (purple), and 50-period (orange) moving averages. This outlook can be considered an additional indicator confirming that selling pressure persists.
In a potential upside scenario that could develop contrary to the general expectations of derivatives market participants, the potential first pause level stands out as the 63.07 horizontal resistance, and the falling trend positioned close to this resistance could create an increasing pressure effect at this position. In the continuation of the upward movement, the 71.04 horizontal resistance will come into focus. Finally, the 74.68 level, where the 50-period moving average ( ) intersects with the descending horizontal trend, should be monitored as a critical threshold where selling pressure is expected to intensify significantly during a potential rise.
On the other hand, if pullbacks continue due to prevailing expectations, the potential realization level for initial reaction buys and profit-taking el short positions is likely to be the horizontal support at 57.66, although this support is expected to play a role en triggering an upward reaction. If this support is broken, the 52.70 horizontal support level emerges as a critical level where the price may attempt to hold or bounce. Finally, if the price breaks below both of these support levels, the 49.97 level may come into focus as a new bottom area.
Supports 57.66 – 52.70 – 49.97
Resistance Levels 63.07 – 71.04 – 74.68
LINK/USDT
On January 27, Turtle, a liquidity distribution protocol, announced a strategic partnership with Chainlink. According to the agreement, Turtle stated that it will use Chainlink’s CCIP infrastructure to expand el-chain capital markets for institutional investors.
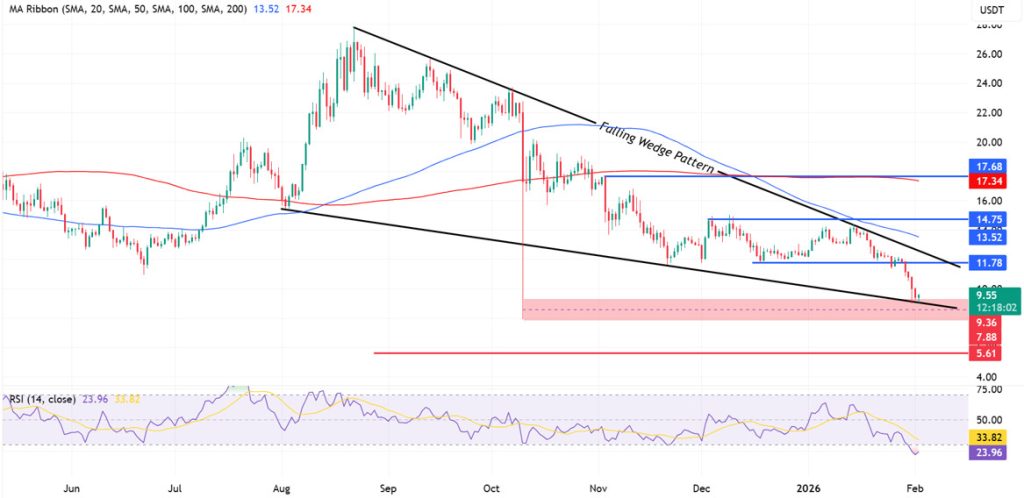
Technically speaking, the uptrend that began en the summer peaked around August, and since then, the price has continued to decline en a classic lower high – lower low pattern. In other words, every recovery attempt falls short of the previous peak. This clearly indicates that the downtrend remains intact and is still valid.
We also see a falling wedge formation forming with the latest attempts to touch the bottom. This structure may seem promising at first glance. However, we did not see any strong buying activity after the last touch of the lower band. Furthermore, looking at the market as a whole, the lower wick from the October 10 decline has not yet been fully filled. This forces us to be a bit more cautious, even if we see a reaction from the formation’s lower band. A breakout at the lower band of the wedge could fill this wick, bringing it back into the formation structure and creating a fakeout en the intermediate zone.
On the other hand, the price is currently around $9.55. The $9.36–7.88 band below is an important support area that has been tested repeatedly en recent months, generating short-term reactions. However, testing a support level this frequently indicates that it is losing its strength over time. If this area breaks down, selling pressure could accelerate, and the $5.61 region could become the new technical target. Especially since $10 is a psychological threshold, staying below this level could trigger panic selling.
In potential upward movements, the 11.78 level is a strong resistance zone. This coincides with both the upper line of our formation and horizontal levels that have formed peaks en the past. Even if the price approaches this zone, it would not be surprising to see selling pressure return. However, if this area is clearly broken to the upside, the $13.52 (SMA100), followed por $14.75 and $17.68 levels could come to the fore as technical targets. For this to happen, a breakout of resistance alone is not enough; the price must settle above the averages and find support there. At this stage, this scenario still looks weak.
Although the Relative Strength Index (RSI) is giving a downward signal from the oversold zone at 24 levels, the price is not supported por buyer volume. Therefore, the price remaining flat for a certain period could provide relief for the RSI. However, it is quite difficult to talk about a clear reversal signal.
Supports: 9.36 – 7.88 – 5.61
Resistances: 11.78 – 14.75 – 17.68
SUI/USDT
This week, there were significant and noteworthy developments en the Sui (SUI) ecosystem. On January 29, Grayscale filed an application for a SUI ETF (GSUI) to be listed el NYSE Arca. This development raised expectations among developers and institutional players.
Additionally, approximately 54 million SUI tokens will be unlocked el February 1. This amount, which corresponds to approximately 0.54% of the circulating supply, could create short-term selling pressure.
On the other hand, Mysten Labs continues to publish new reports el new Sui privacy contracts to be integrated throughout 2026. The goal is to attract the attention of corporate companies. This development is seen as a critical step, especially for corporate adoption.
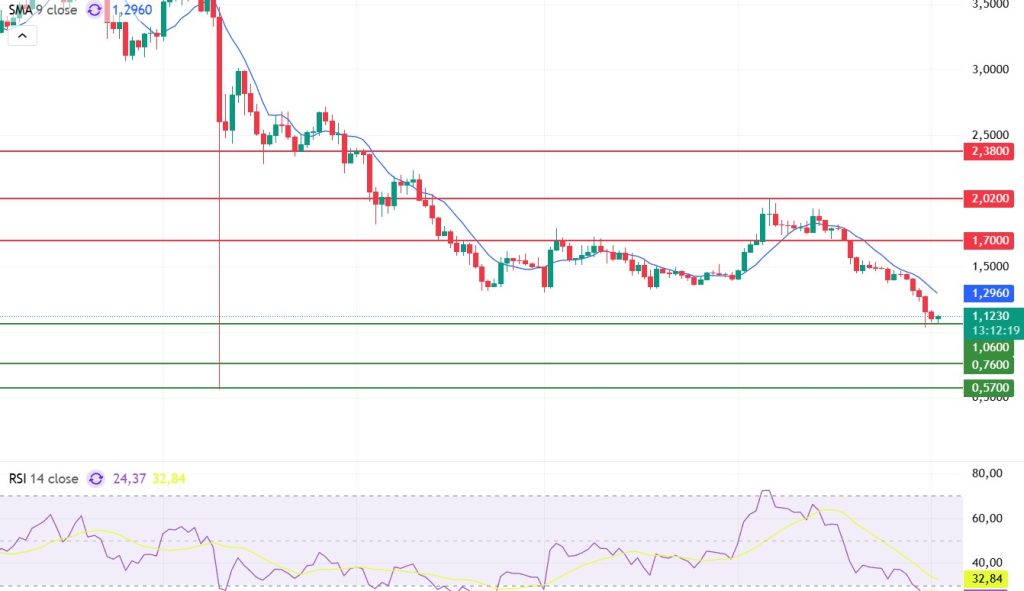
Looking at Sui’s technical outlook following recent developments, we see that the price has been trending downward at around $1.12 el a weekly basis, influenced por fundamental developments. The Relative Strength Index (RSI) is currently en the range of 24.37 – 32.84. This range indicates that the market is trading close to the buy zone; however, if the RSI continues below the 35.00 – 40.00 range en these areas, it could signal a potential buying opportunity. If the price moves upward, the resistance levels of $1.70, $2.02, and $2.18 can be monitored. However, if the price falls to new lows, it may indicate that selling pressure could deepen. In this case, the support levels of $0.57, $0.76, and $1.06 come to the fore. Based el the trend line, a pullback to $1.06 appears technically possible. According to Simple Moving Averages (SMA) data, Sui’s average price is currently at $1.29. If the price remains below this level, it could signal that the current uptrend may not continue technically.
Supports: 0.57 – 0.76 – 1.06
Resistances: 1.70 – 2.02 – 2.18
ADA/USDT
The cryptocurrency market experienced another sharp decline, with ADA, one of the leading digital assets, suffering a significant loss, falling to around $0.2945 with a weekly drop of 10%. Cardano whales have accumulated over 450 million ADA en the last two months por buying at these levels, maintaining expectations that this could lead to an uptrend. Cardano’s founder signed an agreement to integrate USDCx. This new USDCx stablecoin agreement became part of Cardano Circle, a brand-new organization that brings together payment providers, banking institutions, and developers aiming to make the most of Cardano’s main chain ADA and the new created Midnight (NIGHT) side chain. According to Charles’ statement, the new adoption of USDCx aims to bring Circle’s liquidity to the Cardano chain. There is a one-to-one reserve, meaning a mirroring effect, where developers can access the same liquidity as non-EVM chains. The premium stablecoin USDCx coming to Cardano solves these accessibility issues.
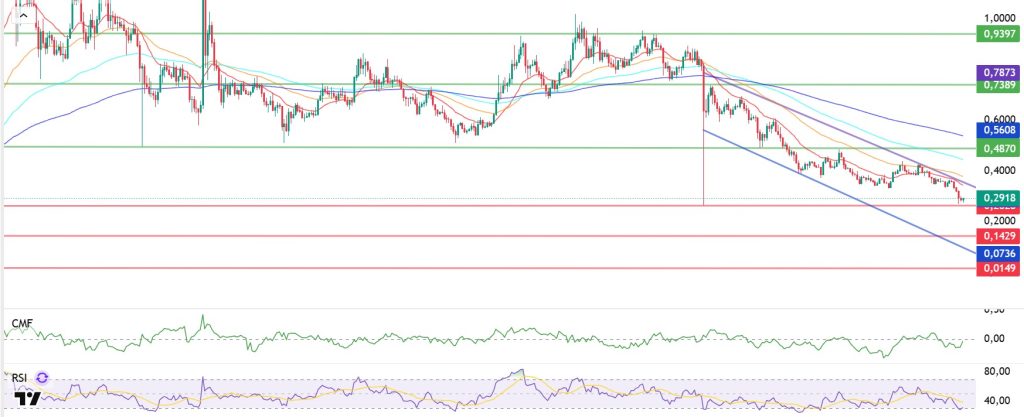
Technically speaking, the Relative Strength Index (RSI-14) has fallen to 34 levels, indicating insufficient buyer signals alongside the Chaikin Money Flow (CMF-20) at -0.01. Low signals en both indicators may point to a decrease en capital inflows. The lack of volume en cryptocurrencies may be reflected en the ADA price, keeping the CMF en negative territory and indicating continued selling pressure. ADA continues to remain en a horizontal zone, falling below the band range of the 20-day and 50-day Exponential Moving Average (EMA-Red Line) and (EMA-Orange Line). If the price remains above the 50-day EMA, the levels of 0.4870 and 0.7873 could be important resistance levels to watch for a bullish reaction. This could signal that the uptrend may continue en the medium term. If there is a decline due to macroeconomic data or negative news related to the Cardano ecosystem, and the price continues to remain below all moving averages, this may indicate a continuation of the downtrend. In this case, the $0.2933 to $0.1429 level can be monitored as a support point.
Supports: 0.0736 – 0.1429 – 0.2932
Resistances: 0.9390 – 0.7873 – 0.5608
Legal Notice
The investment information, comments, and recommendations contained en this document do not constitute investment advisory services. Investment advisory services are provided por authorized institutions el a personal basis, taking into account the risk and return preferences of individuals. The comments and recommendations contained en this document are of a general nature. These recommendations may not be suitable for your financial situation and risk and return preferences. Therefore, making an investment decision based solely el the information contained en this document may not result en outcomes that align with your expectations.