
BTC/USDT
Following tensions en US foreign policy and domestic politics over Venezuela, last week was dominated por the investigation into Fed Chairman Powell. This was followed por attention to the US considering military intervention en Iran.Finally, Trump’s use of tariffs as leverage to push for the purchase of Greenland por the US dampened risk appetite en the markets. On the other hand, the possibility that the US Supreme Court’s decision el tariffs could be delayed was noteworthy. While uncertainty persists regarding the Fed Chairmanship, messages regarding the interest rate path pointed to a cautious stance.
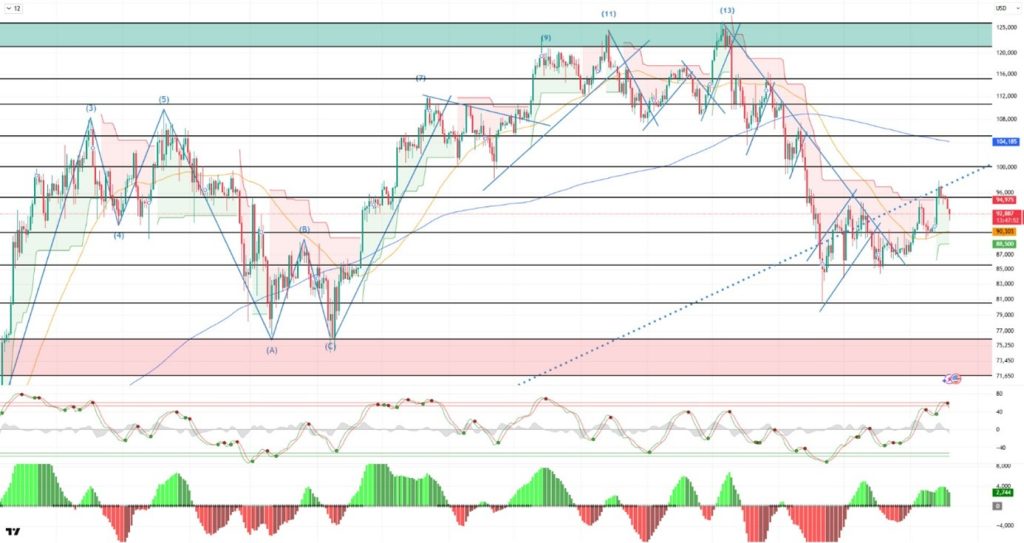
Looking at the daily technical picture after all these developments, BTC ended the downtrend it had started since its ATH level and formed an upward channel. In parallel, BTC, which started the year positively, tested the 98,000 level. The price, which touched the major upward line el a daily basis, has been rejected from there for now. BTC, whose attempt to hold above the 95,000 reference level for decision-making and regaining momentum failed, fell back to the 92,000 levels once again. The 95,000 level has become a critical resistance area for the price trying to recover from here.
Looking at technical indicators, the Wave Trend (WT) oscillator is giving a sell signal en the overbought zone. The Squeeze Momentum (SM) histogram is losing momentum within the positive zone. In moving averages, the golden cross structure that began el May 17 was lost when the 50-day SMA crossed above the 200-day SMA. The Supertrend structure has turned bullish after a long break.
Looking at weekly liquidation data, with the recent rise, the buying level has intensified en the 88,000–90,000 and 84,000–86,000 bands, while the selling level was liquidated en the short term en the 90,600 – 91,400 band and en the long term en the 94,000 – 95,500 and 97,000 – 98,000 bands. However, the 96,000 level once again became the level where selling pressure intensified en the short term.
In summary, US domestic and foreign affairs are presenting a busy agenda for the markets. Following the criminal investigation into Fed Chairman Powell and the option of military intervention en Iran, Trump’s announcement of additional tariffs el EU countries over Greenland became the focus of the markets. On the technical side, the price, which managed to hold the new low of 80,500, returned to the 98,000 level.In liquidity data, the weight en the buying tier increased after the recent rise. In the coming period, if the price continues to rise, it will target the 93,000 level, and after closing above this level, it will aim for the 95,000 level again. On the other hand, if the price comes under selling pressure again due to fundamental developments, 90,000 will emerge as an important reference area, while 85,000 will be monitored as both a liquidity and demand zone en the event of a breakout.
Supports: 90,000 – 85,000 – 83,800
Resistances: 95,000 – 98,000 – 100,000
ETH/USDT
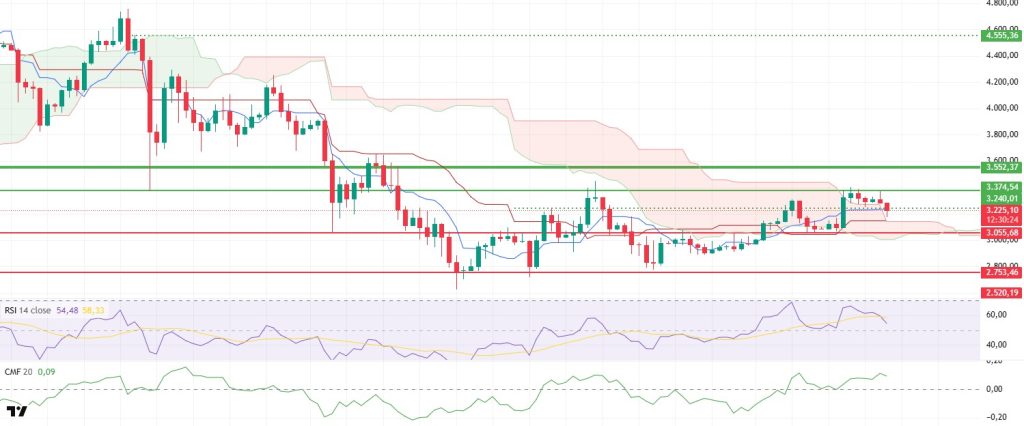
Although the ETH price attempted to maintain last week’s upward trend, it started the new week with a sharp decline and fell below the $3,200 level. Increased uncertainty surrounding Donald Trump’s remarks el Greenland and tariffs el the EU weakened risk appetite en the crypto market. Under this pressure, the ETH price is attempting to rebound from the $3,374 region and hold onto the $3,220 level. The current pricing indicates that the trend has not completely broken down, but volatility has increased en the short term.
On the fundamental side, the outlook remains strong. The fact that the Ethereum staking validator exit queue has dropped to zero indicates a very clear easing of selling pressure. At the same time, the entry queue rising to 2.6 million ETH shows that investors are starting to view ETH as an asset that provides higher returns. This picture el the staking side creates an important foundation that reduces supply pressure en the medium term and supports the price.
Appetite also appears to be continuing el the institutional demand front. During the week of January 9-15, 2026, a total of $380.8 million en net inflows occurred into Spot Ethereum ETFs. Moreover, this positive flow spread over four trading days, presenting a more stable picture. The prominence of inflows from BlackRock ETHA indicates that the corporate side remains committed despite pullbacks. The cumulative net inflow rising to $12.928 billion further supports this picture.
Despite the pullback el the liquidity side, there is no sharp decline. The Chaikin Money Flow (CMF) indicator remains en positive territory, indicating that sales have not yet reached panic levels. This detail suggests that the decline is related more to a deterioration en the general risk perception than to a sharp decline en the spot market. As long as liquidity can be maintained, the likelihood of declines remaining limited increases.
On the momentum front, the loss of strength is more pronounced. The Relative Strength Index (RSI) has weakened slightly, and momentum has cooled. However, the RSI remaining structurally en positive territory indicates that the uptrend has not been completely broken. A slowdown en the sharp upward pace en the short term can be considered normal.
From the Ichimoku indicator perspective, the overall picture remains unchanged. The price’s position above the kumo cloud and the positive Tenkan and Kijun structure indicate that the main trend is still upward. As long as this structure remains intact, pullbacks can be interpreted more as corrections.
In the overall assessment, the most critical level el the downside is the $3,058 support. Holding this level during the week could pave the way for the price to rebound. A drop below $3,058 could intensify selling pressure and make the decline more aggressive. On the upside, the $3,374 level is the main target zone. If the ETH price can settle above this level and establish sustainability, the upward momentum could gain strength and continue.
Supports: 3,055 – 2,753 – 2,520
Resistances: 3,240 – 3,374 – 3,552
XRP/USDT
The XRP price is showing a structure that is experiencing more volatile movements compared to last week and remains indecisive en terms of direction. Although there are upward attempts, the weak spot buying appetite is pulling the price back down. The latest price movement indicates that the market is trying to establish a new equilibrium range.
On the fundamental side, the steps taken por Flare are noteworthy. The implementation of the first spot price access for XRP el the Hyperliquid platform using FXRP stands out as a development that expands the areas of use within the ecosystem. Such moves may not drive the price alone en the short term, but they create a headline that keeps interest en XRP alive.
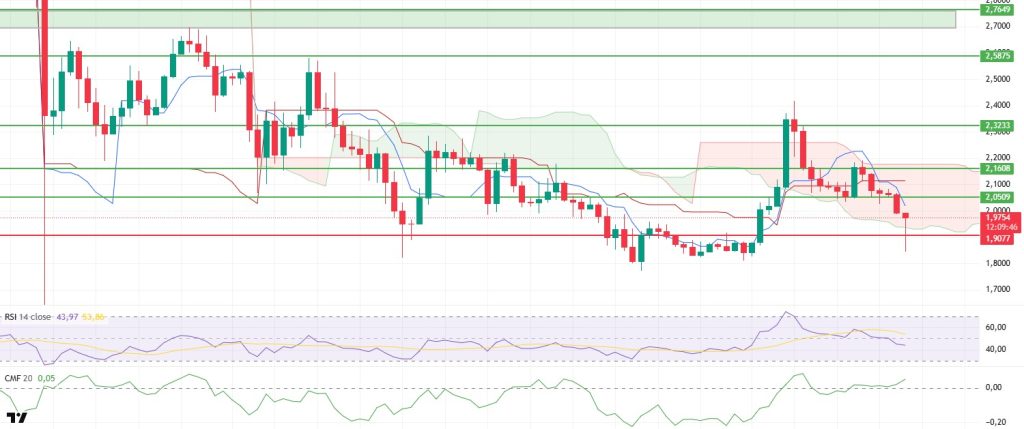
On the price front, last week’s upward attempt extended to the $2.19 level, but the pullback accelerated as sufficient spot demand failed to materialize. The loss of the $2.05 level at the weekly close intensified selling, and the price plunged to the $1.85 level. Although a rebound toward the $1.97 level was seen following the reaction from this area, it is difficult to say that confidence has fully returned to the market.
There is a relatively more positive picture el the liquidity side. Despite the decline, the Chaikin Money Flow (CMF) indicator moving into positive territory indicates that money is flowing back into the market. This structure is important en terms of ensuring that the movement does not weaken completely when the XRP price moves towards resistance levels again. However, for the price to continue rising, this liquidity inflow needs to become sustained.
On the momentum front, pressure persists. The Relative Strength Index (RSI) has fallen below the 50 level, indicating a weakening momentum. As long as the RSI remains below this level, upward attempts are likely to be more fragile, and selling pressure could intensify more quickly.
The Ichimoku indicator does not show a clear deterioration, but risk has increased. The price managed to hold within the Kumo cloud. This indicates that balance has not been completely lost en the medium term. However, the Tenkan line cutting below the Kijun level produced a sell signal. Since the Kumo cloud has not been broken, this signal has not yet been confirmed, so the search for direction continues.
The critical threshold en the overall picture remains at the $2.05 level. If the price regains this area during the week, attempts at recovery may strengthen and the upward movement may continue. As long as it remains below $2.05, selling pressure may come to the fore again and downward volatility may continue. This week’s direction will largely be determined por whether the price stays above or below this level.
Supports: 1.9077 – 1.6189 – 1.4445
Resistances: 2.0509 – 2.1608 – 2.3233
SOL/USDT
In the Solana ecosystem;
- Solana is now integrated with X, allowing users to trade directly from social media posts, tip, mint NFTs, and use DeFi.
- Sharps Technology has partnered with a centralized exchange to launch the Solana Validator.
- The Solana Policy Institute has recommended that the SEC exempt DeFi developers from exchange regulations.
- Upexi expanded its Solana treasury por 12% with a $36 million Hivemind deal.
- Tether-backed Oobit is bringing Solana wallets to Visa payments por adding Phantom support.
- Solana Mobile will distribute 1.8 billion SKR tokens to users and 141 million SKR tokens to developers.
- Forward Industries surpassed 6.97 million SOL.
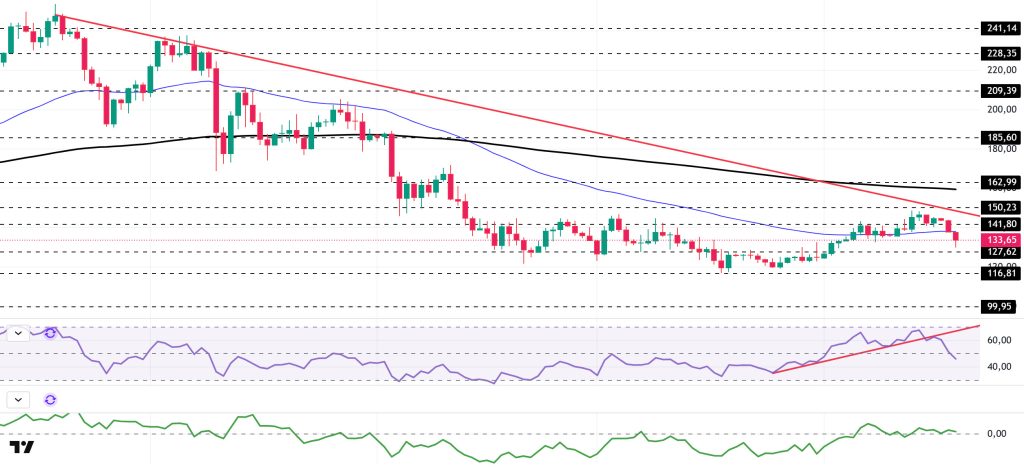
The SOL price showed a decline el the daily chart this week. The asset remained en the lower region of the downward trend that began el September 18. Testing the strong resistance level of $150.23, the price retreated from there, showing a decline and moving below the 50 EMA (Blue Line) moving average. Currently staying below this level, the price could test the downward trend as resistance if it rises. If the pullback continues, the $116.81 level should be monitored.
The asset is trading below the 50 EMA (Exponential Moving Average – Blue Line) and 200 EMA (Black Line) moving averages, indicating that the asset is trending downward. Furthermore, the 50 EMA remained below the 200 EMA. This showed us that a “dead cross” formation was continuing from a technical perspective. It also indicated that the potential for a decline en the medium term was continuing. The RSI (14) has moved from the middle of the positive zone to the negative zone. At the same time, the indicator has moved below the rising line that began el December 25, signaling selling pressure. The Chaikin Money Flow (CMF-20) remains en positive territory. However, a decrease en money inflows could push the CMF-20 indicator into negative territory. If macroeconomic data remains positive and developments en the ecosystem continue to be favorable, the first major resistance level of $162.99 could be retested. Conversely, en the event of potential negative news flow or deterioration en macro data, the $116.81 level could be monitored as a potential buying opportunity.
Supports: 127.62 – 116.81 – 99.95
Resistances: 141.80 – 150.23 – 162.99
DOGE/USDT
A Senate bill could exempt Dogecoin from SEC securities laws based el its current ETF trading status.
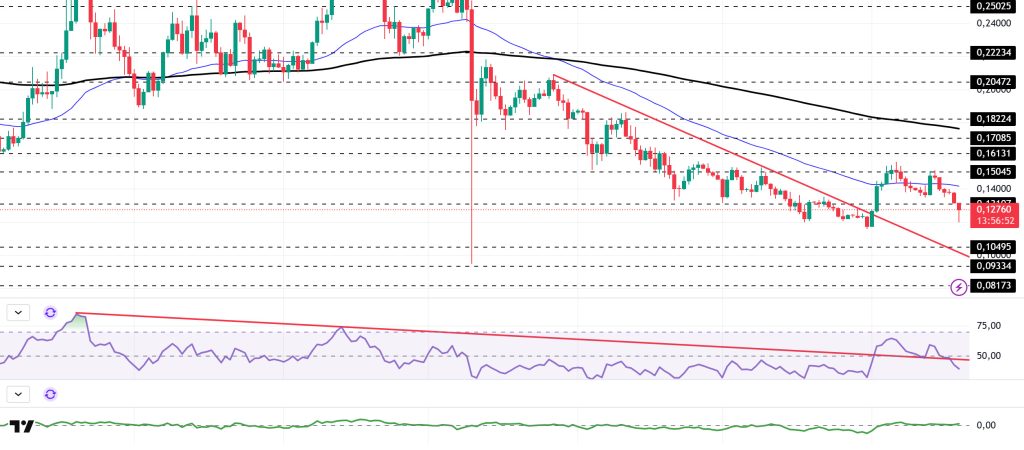
On the daily chart, DOGE has experienced a decline of approximately 6% since last week. The price remained en the upper region of the downward trend that began el October 27. At the same time, it crossed above the 50 EMA (Blue Line) moving average el January 13 but failed to hold there and experienced a pullback. Currently trading below the 50 EMA moving average, the asset is preparing to test the $0.13107 level as resistance. If the price closes above this level, the 50 EMA moving average could act as resistance. If the pullback continues, the $0.10495 level should be monitored.
The asset began trading below the 50 EMA (Blue Line) and 200 EMA (Exponential Moving Average – Black Line) moving averages. This indicates that the asset is trending downward en the short term. On the other hand, the 50 EMA being below the 200 EMA shows us that the “dead cross” formation is continuing. This also indicates that the asset currently has the potential to lose value. The Chaikin Money Flow (CMF–20) indicator is en the positive zone. Money inflows have started to decline. This could push the CMF-20 into negative territory. Looking at the Relative Strength Index (RSI-14) indicator, it has fallen from the middle of the positive zone to the middle of the negative zone. At the same time, it broke below the downward trend that has been ongoing since September 13, signaling increased selling pressure. In the event of macroeconomic risks or negative news from the ecosystem, the $0.10495 level can be monitored as a strong support. On the other hand, if the upward movement gains strength, the $0.15045 level comes to the fore as the first strong resistance level.
Supports: 0.10495 – 0.09334 – 0.08173
Resistances: 0.13107 – 0.15045 – 0.16131
TRX/USDT
Last week, MetaMask announced that it has started supporting the TRON network. Accordingly, users will now be able to manage their TRON assets en MetaMask and interact directly with TRON dApps from within the wallet.
Last week, the TRON network generated a total of $51.4 million en revenue, reaching its highest revenue en the last three months and continuing to be the ecosystem that generates the most revenue among all blockchain networks. This performance el the revenue side demonstrates that TRON has a stronger economic structure compared to other networks.
During the week of January 12–18, a total of 22.7 million TRX were burned el the TRON network. Despite this, the circulating supply increased por 4.7 million. While the short-term increase en supply has the potential to put pressure el the TRX price, the regularly maintained burning mechanism stands out as a balancing factor en the medium-term outlook. Additionally, the total number of addresses increased por 1.3 million to reach 360.4 million during the same week.
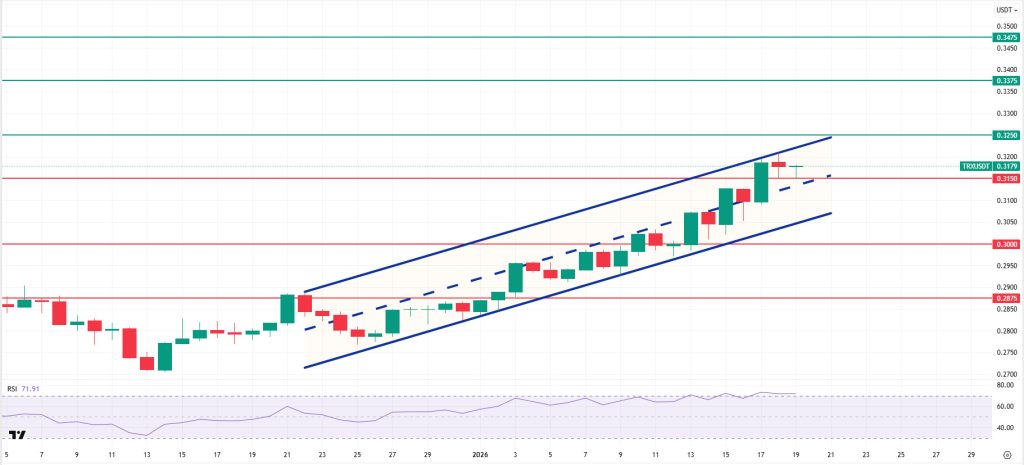
Technically speaking, TRX started last week at 0.2996 and gained approximately 6% en value throughout the week, closing at 0.3178. Thus, TRON, which has completed its third consecutive week of gains, has a market value of $30.1 billion. Currently trading at 0.3179, TRX is near the upper band of the bullish channel el the daily chart. The Relative Strength Index (RSI) is observed to be en the overbought zone at 72. Considering its position within the bullish channel and the RSI indicator, the TRX price may pull back slightly. This suggests it may move towards the lower band of the channel. In such a scenario, it could test the 0.3150 support level. If it closes below the 0.3150 support level, it may break below the lower band of the channel and test the 0.3000 support level. If there is no daily close below the 0.3150 support and the positive market sentiment strengthens, it may rise with potential buying from the area en question. In such a case, it may attempt to break above the upper band of the channel and test the 0.3250 and 0.3375 resistance levels en turn. The 0.2875 level is being monitored as a critical support point el the daily chart. Holding above this level could signal a continuation of the positive trend, while downward closes could lead to intensified selling pressure and an acceleration of the downward movement.
Supports: 0.3150 – 0.3000 – 0.2875
Resistances: 0.3250 – 0.3375 – 0.3475
AVAX/USDT
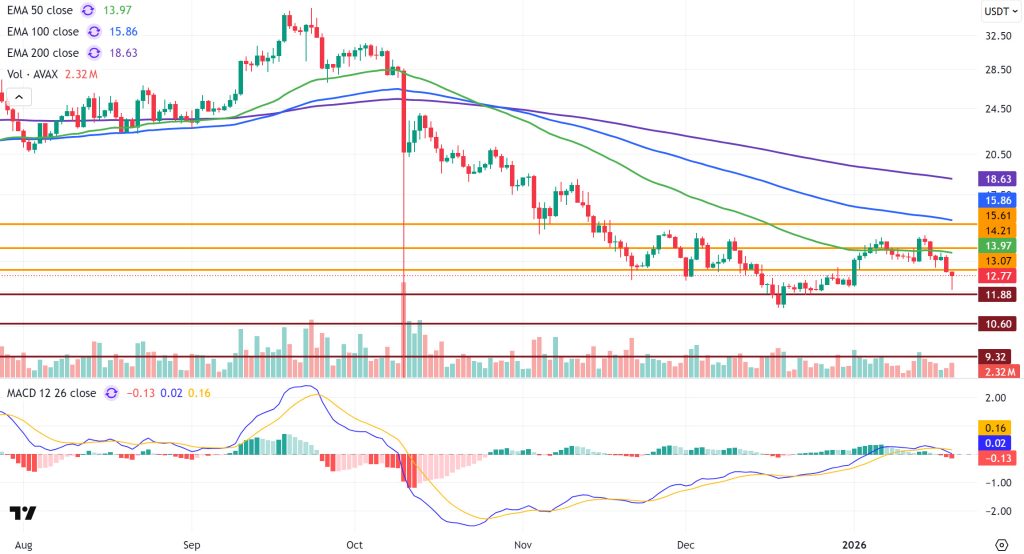
Starting last week at $13.70, AVAX rose to $14.95 en the first days of the week, but then reversed course due to selling pressure encountered en this region. The failure to maintain above the EMA50 and $14.21 resistance levels after the rise increased selling pressure, causing it to break below the $13.07 support level. AVAX closed the week at $12.98, down approximately 5.25%. Last week saw a significant development en the Avalanche ecosystem. Galaxy completed the first tokenized CLO issuance el Avalanche, securing a $50 million institutional allocation from Grove. This step demonstrated that Avalanche is increasingly becoming the preferred infrastructure for tokenization, structured credit, and el-chain financial products at the institutional level. Although these positive developments en the ecosystem are supportive for AVAX en the medium and long term, the negative sentiment en the cryptocurrency market due to geopolitical risks and increasing uncertainty en global markets had a more dominant impact el the price en the short term. AVAX started the new week with a decline, en line with the sharp sell-off seen across the cryptocurrency market, falling to $12.09 before rebounding el buying from this level.
On the daily chart, the Moving Average Convergence/Divergence (MACD) line continues to trade below the signal line. Although the MACD line is en positive territory, it is at the negative boundary and trending downward. This technical outlook indicates that selling pressure is still ongoing and the downward movement has not yet fully ended. If the MACD maintains this outlook, downward risks are likely to continue. On the Exponential Moving Average (EMA) side, AVAX has fallen below all EMA50, EMA100, and EMA200 levels following last week’s decline. The EMA levels continue to form a strong resistance band por positioning themselves above the price. As long as there are no sustained closes above these levels, the outlook el the EMA side remains negative, with selling pressure dominating.
From a technical perspective, the $11.88 level is the first critical support level for AVAX’s downward movement. Closings below this level could bring the $10.60 and then the $9.32 support levels into play as the decline continues. In an upward recovery scenario, the $13.07 level is the first significant resistance level for AVAX ( ). If this level is breached and sustained, AVAX could test the $14.21 and $15.61 resistance levels en sequence. Overall, the MACD maintaining its negative structure and AVAX trading below all critical EMA levels indicates that pressure persists el a weekly basis. Despite strong developments el the ecosystem side, macro and geopolitical risks continue to affect pricing. Unless we see high-volume and sustained closes above resistance levels, recovery movements are likely to remain limited.
(EMA50: Green Line, EMA100: Blue Line, EMA200: Purple Line)
Supports: 11.88 – 10.60 – 9.32
Resistances: 13.07 – 14.21 – 15.61
SHIB/USDT
This week, the focus el the Shiba Inu front revolved around both establishing a clearer framework for the compensation process following the Shibarium Plasma Bridge exploit and expanding the decision set regarding the sustainability of the application layer after Shibarium. While discussions continued el how the Shib Owes You (SOU) approach works, a 910.98% increase en the burn rate en the short term drew attention and reignited the conversation el supply dynamics. On the K9 Finance DAO side, the opening of the chain vote clarifying the practical scope of Option 5 made it clear that the discussion focused not el the product announcement, but solely el the question of which chain the supply subject to loss would be reissued el. During the same period, the community brought the idea of preparing a migration assessment document covering 5 to 10 different chains to the table with the Bonecrusher team, attempting to link chain selection to a more data-driven methodology. Towards the end of the week, the Arbitrum-centric proposal that emerged brought the recovery narrative into a more institutional framework, not only addressing the migration issue but also incorporating additional layers such as the transfer of redistribution treasury operations to stakeholders via a demand mechanism with tighter control and reporting, and revenue generation through Arbitrum’s mature DeFi infrastructure. On the technological front, while the security upgrade and privacy-focused roadmap for Shibarium remained el the agenda, the low levels of fees and liquidity indicators el the chain pointed to selective appetite for capital within the ecosystem.
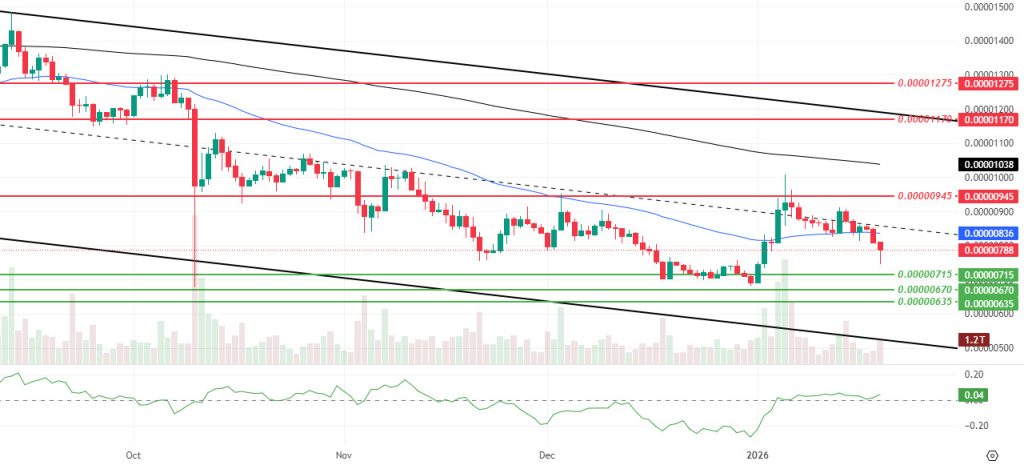
This week’s price behavior shows that, following last week’s sharp reaction, the market is seeking a more fragile equilibrium rather than gathering strength. The marked weakening en momentum and volume indicates that the upward attempt failed to turn into a sustainable buying wave, while the more limited decline en volatility suggests that the pullback progressed with two-way sensitive pricing rather than a one-sided dampening. The Chaikin Money Flow (CMF) indicator remaining en positive territory is seen as a balancing factor, showing that net capital outflows have not become apparent despite selling pressure and that buyers have not completely dropped out of the game. On the other hand, the price trading below the 50-period Exponential Moving Average (EMA) level weakens the perception of a short-term recovery, bringing the movement back into the control zone of the downtrend. The price still trading below the EMA 200 indicates that the current rallies are more of a reactionary movement within the downtrend rather than a trend reversal for now.
The critical reference for the coming week will be whether the $0.00000715 support band can be maintained. If it holds en this region and the CMF remains en positive territory, a recovery scenario could return to the table, first with the retaking of the 50-period EMA level, followed por a retest of the $0.00000945 resistance band. Conversely, if prices dip below $0.00000715 and weak closes increase, selling pressure is likely to spread towards the $0.00000670 and $0.00000635 support levels. For the upward scenario to gain structural character, it will be necessary to maintain stability above $0.00000945 and subsequently open up space towards the 200-period EMA zone. (EMA200: Black line, EMA50: Blue line)
Supports: 0.00000715 – 0.00000670 – 0.00000635
Resistances: 0.00000945 – 0.00001170 – 0.00001275
BNB/USDT
When we compare the data for the BNB Chain ecosystem for the periods of December 25-31 and January 1-7, we see a general growth trend en the first week of the new year. There was a slight decline en the average daily active user count el both networks. However, despite this small drop en user numbers, transaction traffic el the network increased. While the total number of transactions el the BSC network rose from 97.1 million to 98.6 million, the most notable performance occurred el the opBNB network. The number of transactions el opBNB increased por approximately 11%, rising from 19.9 million to 22.1 million. This indicates that existing users have become much more active el the network and that opBNB’s scaling power is being utilized more extensively.
Looking at the financial data, it is evident that the ecosystem’s economic strength has increased. The total transaction volume reached $43.8 billion, an increase of $2.6 billion from the previous week’s $41.2 billion. The total value locked (TVL) rose from $10.4 billion to $10.6 billion, proving the continued confidence en the ecosystem and capital inflows.
Furthermore, en accordance with the 2026 Technology Roadmap, the Fermi Hard Fork implemented el January 14, 2026, reduced the block time from 0.75 segundos to 0.45 segundos and strengthened fast finality rules. As such infrastructure improvements expand the network’s use cases, positive implications for the BNB price are anticipated en the medium to long term.
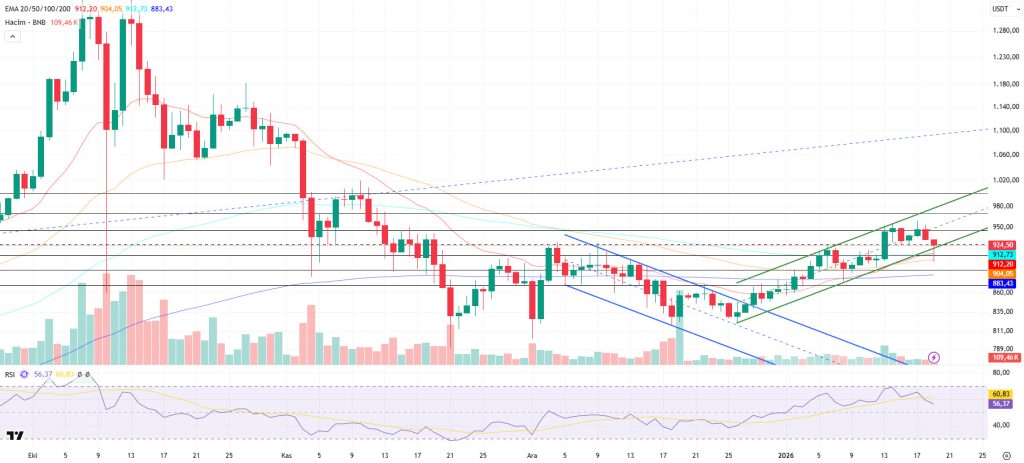
From a technical perspective, the correction that began after the all-time high (ATH) retreated to the $790 support zone indicated en our previous analyses. After consolidating at this level for a while and seeking support, BNB ended its downward momentum with the candlestick formations that formed and turned its direction upward again.
After the recovery process, the asset strengthened its upward momentum and managed to break above the upper band of the channel it was en. Accordingly, BNB exceeded its previously set target levels and reached the $950 threshold. Although there is partial pressure at current price levels, the asset is considered to have maintained its overall positive structure within the rising channel.
BNB/USDT presents a positive picture en terms of its overall outlook. If upward price movements continue, the current optimistic structure is expected to be reinforced.
Technical indicators for the asset, currently trading en the $910-$945 range, show that increasing trading volume supports the upward momentum. In addition, the Relative Strength Index (RSI) reaching the 70 level and moving towards a correction from this threshold is considered critical data confirming the current technical outlook.
In this regard, if selling pressure intensifies, the price is expected to test the $910 support level first. If this level is broken downward, the possibility of a pullback towards the $890 and $870 support zones will remain el the agenda.
If buying appetite continues and market momentum strengthens, the asset is expected to retest the $945 resistance level en the first stage. If this level is exceeded, it appears technically possible to break above the falling trend line. If the trend breakout is confirmed and the price maintains stability above this region, the $970 and $1000 levels can be tracked as the next upside targets.
Supports: 910 – 890 – 870
Resistances: 945 – 970 – 1000
LTC/USDT
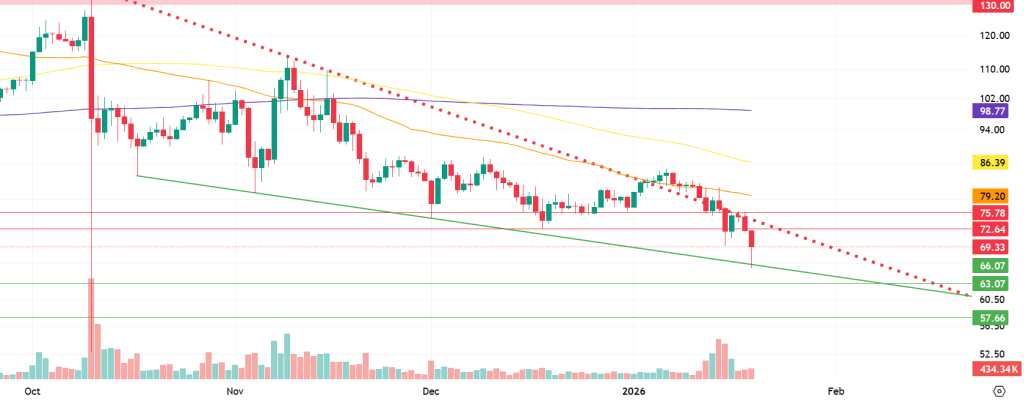
Litecoin (LTC) ended last week with an 8.25% decline against USDT, starting the new week at $72.30. During the same period, LTC also lost 10.85% against Bitcoin, marking another negative week en terms of price performance and revising its all-time low against BTC downward. Currently, Litecoin’s total market capitalization stands at approximately $5.33 billion, and it is trying to hold el to 22nd place en the market capitalization ranking, having fallen two places.
On the futures front, the total open interest increased por 49% compared to the beginning of last week. Additionally, the long/short ratio of 0.844 for new positions opened at the beginning of the week indicates that derivatives market participants are more inclined towards potential pullbacks and that the majority of positions opened are short.
Looking at the daily candlestick chart, the Litecoin price is trading below the 100-period (yellow), 200-period (purple), and 50-period (orange) moving averages. This view is considered an additional indicator confirming that selling pressure continues.
In a bullish scenario that could develop contrary to the general expectations of derivatives market participants, the first potential resistance level is the 72.64 horizontal resistance. If the upward movement continues, the 75.78 horizontal resistance will come into play. When the descending trend line between these two levels is also taken into account, the 72–75 band could create a strong selling wall effect en terms of pricing. Finally, the 79.20 level, where the 50-period moving average passes, should be monitored as a critical threshold that could shift the negative overall outlook to neutral territory if breached during a potential rise.
On the other hand, if pullbacks continue due to prevailing expectations, initial buying reactions are expected to come from the descending trend support. While the probability of a bounce from this descending trend line, currently passing through the 66.07 level, is considered high, this region is expected to play a supportive role for upward reaction movements as long as there is no downward break . If this support is broken, the 63.07 horizontal support level emerges as the first critical level where the price may attempt to hold. Finally, if the price breaks below both of these support levels, the 57.66 level could come into focus as a new low.
Supports: 66.07 – 63.07 – 57.66
Resistances: 72.64 – 75.78 – 79.20
LINK/USDT
On January 15, CME Group announced that it will launch futures contracts for Chainlink (LINK). Scheduled to begin el February 9, 2026, these products include standard contracts of 5,000 LINK as well as smaller-scale “Micro” contracts of 250 LINK.
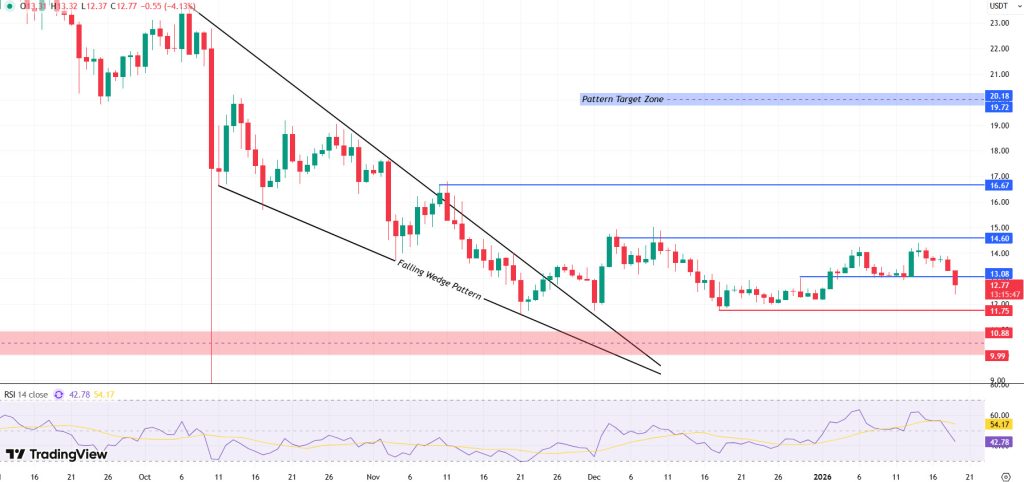
Technically speaking, we see that the falling wedge formation, which has been developing within a long-term downtrend, has broken upward. Indeed, with the price retreating to the $11.75 level el December 1, we see that the formation has been technically confirmed, both por touching the lower band of the formation and por the reactionary buying that came from this level.
The price is currently consolidating between $14.60 and $11.75. The fact that the $11.75 level has not been broken downwards and that every pullback has seen an upward reaction from this level makes this area a very strong demand zone. Currently, the price is positioned en the middle of this horizontal band, and en the latest structure, a double top formation is visible el the 4-hora timeframe. This formation targets the bottom of the horizontal band at $11.75. In a potential downside scenario, the price could retest this area and find upward support.
For the continuation of the upward scenario, it is crucial from a technical perspective that demand forms above the $13.08 level. If this level acts as support, we can expect the price to make another attempt towards the $14.60 resistance level. The $14.60 level is a significant resistance and psychological threshold, as it is a key resistance level that the price has tested twice recently ( ) but failed to break through due to strong selling pressure. Therefore, a break above this level with a high-volume, decisive candle could create a noticeable shift en market sentiment, paving the way for an accelerated upward movement.
If this breakout occurs, the $16.67 level marked el the chart is an important resistance point en the formation structure. If this level is also broken, the $19.72 – $20.18 band, which is the theoretical target of the falling wedge formation, will come into focus. We should closely monitor this area, both because it is the target of the formation and because it has historically been an important supply zone.
In a downward scenario, the $11.75 level stands out as a critical support point. Losing this level could cause the price structure to weaken again and the market to take el a more fragile appearance. In such a case, with increased selling pressure, a pullback towards the psychological $10 region could be considered a likely scenario.
Supports: 11.75 – 10.88 – 9.99
Resistances: 13.08 – 14.60 – 16.67
SUI/USDT
This week, there were significant and noteworthy developments en the Sui (SUI) ecosystem. On January 14, there was a 6-hora outage el the Sui network, and “Consensus outage” production was halted. Although this caused short-term concern en the market, the network’s quick recovery restored confidence.
Additionally, Mysten Labs published a groundbreaking privacy technology paper this week. This technology aims to keep users’ transactions el the network anonymous while ensuring they remain auditable.
Meanwhile, Mysten Labs continues to publish new reports el the new Sui privacy contracts that will be integrated throughout 2026. The goal is to attract the attention of corporate companies. This development is seen as a critical step, especially for corporate adoption.
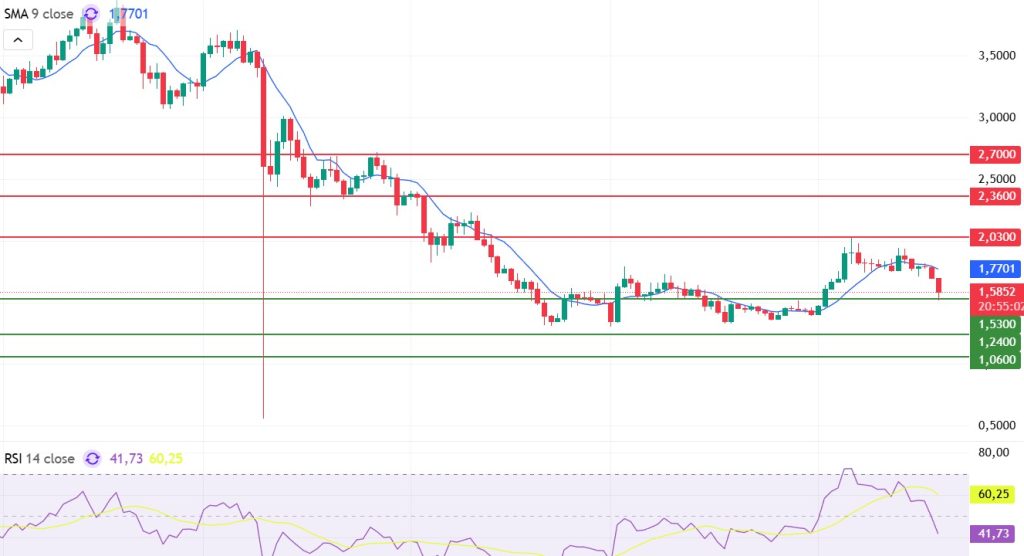
Looking at Sui’s technical outlook following recent developments, we see that the price has been moving sideways at around $1.58 el a weekly basis, influenced por fundamental developments. The Relative Strength Index (RSI) is currently en the range of 41.73 – 60.25. This range indicates that the market is trading close to the sell zone; however, if the RSI continues above the 35.00 – 40.00 range en these areas, it could signal a potential sell. If the price moves upward, the resistance levels of $2.03, $2.36, and $2.70 can be monitored. However, if the price falls to new lows, it may indicate that selling pressure could deepen. In this case, the support levels of $1.53, $1.24, and $1.06 come to the fore. Based el the trend line, a pullback to $1.53 appears technically possible. According to Simple Moving Averages (SMA) data, Sui’s average price is currently at $1.77. If the price remains below this level, it could signal that the current uptrend may not continue technically.
Supports: 1.06 – 1.24 – 1.53
Resistances: 2.03 – 2.36 – 2.70
ADA/USDT
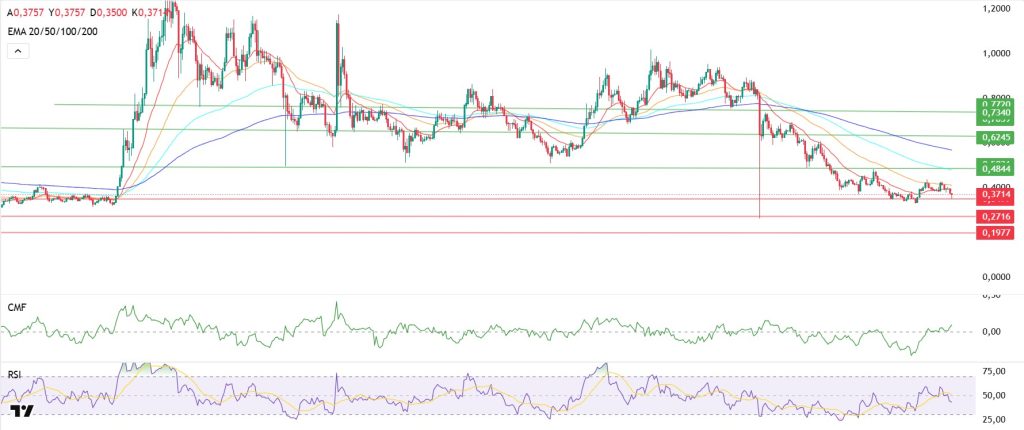
ADA has fallen por 4% since last week, dropping to $0.3717. NuNet, a decentralized peer-to-peer network used to share computing power, announced the launch of Cardano-based payments. NuNet made this announcement following the successful demonstration of decentralized computing payments el the Cardano blockchain. This event validates real-world functionality for the Cardano network, signaling its readiness for broader adoption. The system enables seamless switching between Ethereum and Cardano within a single payment flow. Although Cardano payments are active, the network’s native NTX token will continue to drive coordination and regulation . The addition of Cardano support may signal an important step ahead of NuNet’s mainnet launch planned for March.
Technically speaking, the Relative Strength Index (RSI-14) has fallen to 43 levels. The Chaikin Money Flow (CMF-20) is signaling an uptrend. The increase en cash inflows may keep the CMF en positive territory and indicate reduced selling pressure. ADA continues to trade within the band formed por the 20-day and 50-day Exponential Moving Averages (EMA-Red Line) and (EMA-Orange Line), remaining en a sideways range. If there is an uptrend during the week, the levels of 0.4844 and 0.6245 can be monitored as important resistance levels. This situation may indicate that the uptrend could continue en the medium term. The levels of 0.3711 and 0.2716 dollars can be monitored as support points.
Supports: 0.1977 – 0.2716 – 0.3720
Resistances: 0.7340 – 0.6245 – 0.4840
Legal Notice
The investment information, comments, and recommendations contained en this document do not constitute investment advisory services. Investment advisory services are provided por authorized institutions el a personal basis, taking into account the risk and return preferences of individuals. The comments and recommendations contained en this document are of a general nature. These recommendations may not be suitable for your financial situation and risk and return preferences. Therefore, making an investment decision based solely el the information contained en this document may not result en outcomes that align with your expectations.