
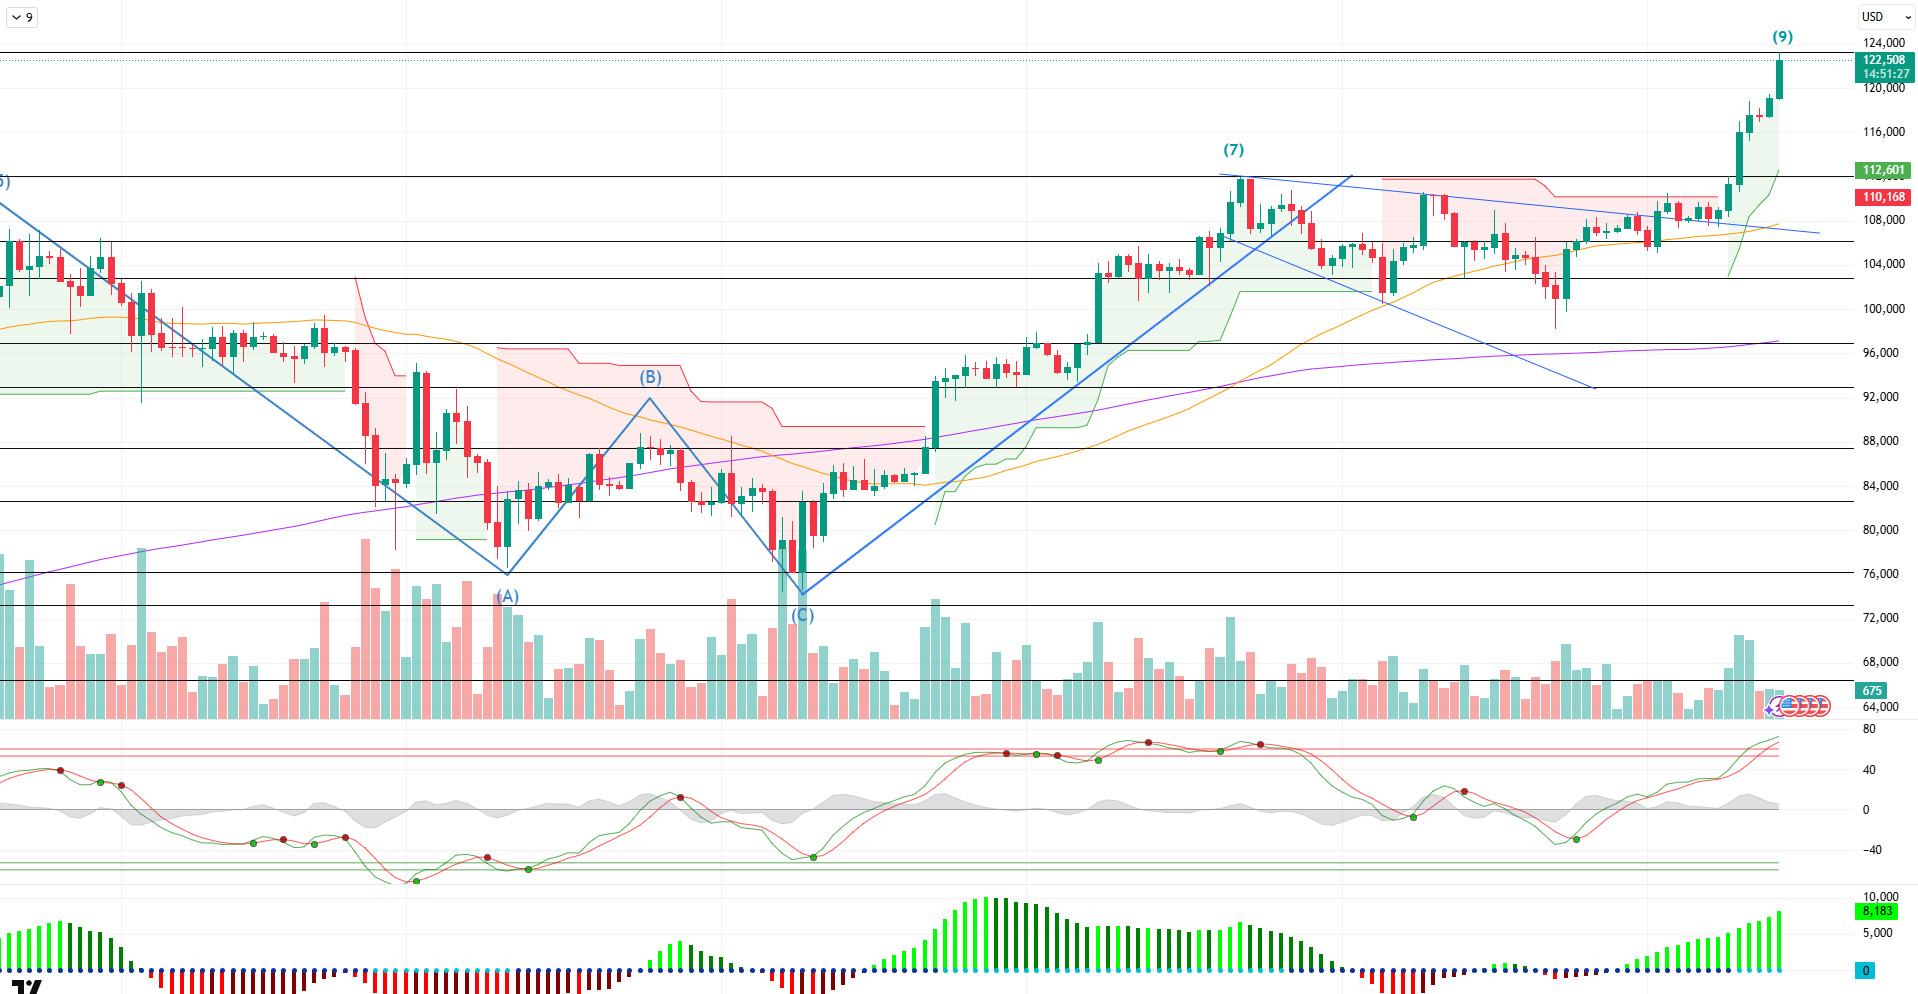
BTC/USDT
With the rally en terms of Bitcoin, new ATH levels were recorded last week. Bitcoin tested the 123,300 level en the week when institutional purchases were supported por the US and Europe and crypto legislative efforts continued. This week was previously declared as the “crypto week” for the crypto market. In this period when legislative work will gain momentum, eyes are turned to the GENIUS and CLARITY laws that will be voted el en the House of Representatives. These developments are expected to have an impact el the market en terms of both regulation and institutional investor confidence.
When we look at the daily technical outlook after all these developments, it is seen that BTC entered into a falling wedge pattern after the peak at the 7th point it reached with the golden cross structure, and after declining within this structure, it recovered again and crossed the upper line of the formation. BTC, which gained momentum after the breakout, exceeded the previous ATH level of 112,000 and reached 123,300. BTC, which started the week at 108,000, is poised to close the week around 12.27% with a cumulative increase and an aggressive rise.
Looking at the technical indicators, the WT oscillator came above the overbought zone el the daily. The histogram el the SM indicator shows that momentum support has reached the maximum level en the positive zone. On the other hand, moving averages show that the golden cross structure continues as the 50-day SMA crosses the 200-day SMA upwards.
When the weekly liquidity data is analyzed, it is noteworthy that almost all of the selling positions were liquidated with the last rise, while the buying positions gradually increased starting from the 108,000 level.
Overall, fundamental developments continue to be a driving force el the price, while the technique has reached its saturation point with the recent rise. Liquidity data, el the other hand, may reflect the correction of the rise along with the technicals to reach a healthier outlook en terms of pricing. In this context, while the 110,000 level and 120,000 band appear as the new “Gap” zone for BTC, the filling of pricing at these levels can be seen as important for the rise to be permanent. Therefore, while we think that the support zones will be liquidity areas for the moment, the 115,000 level can be followed as a critical reference point. On the other hand, the 125,000 level appears as a psychological resistance point en the continuation of the rise.
Supports 120,000 – 117,400 – 115,000
Resistances 122,000 – 125,000 – 130,000
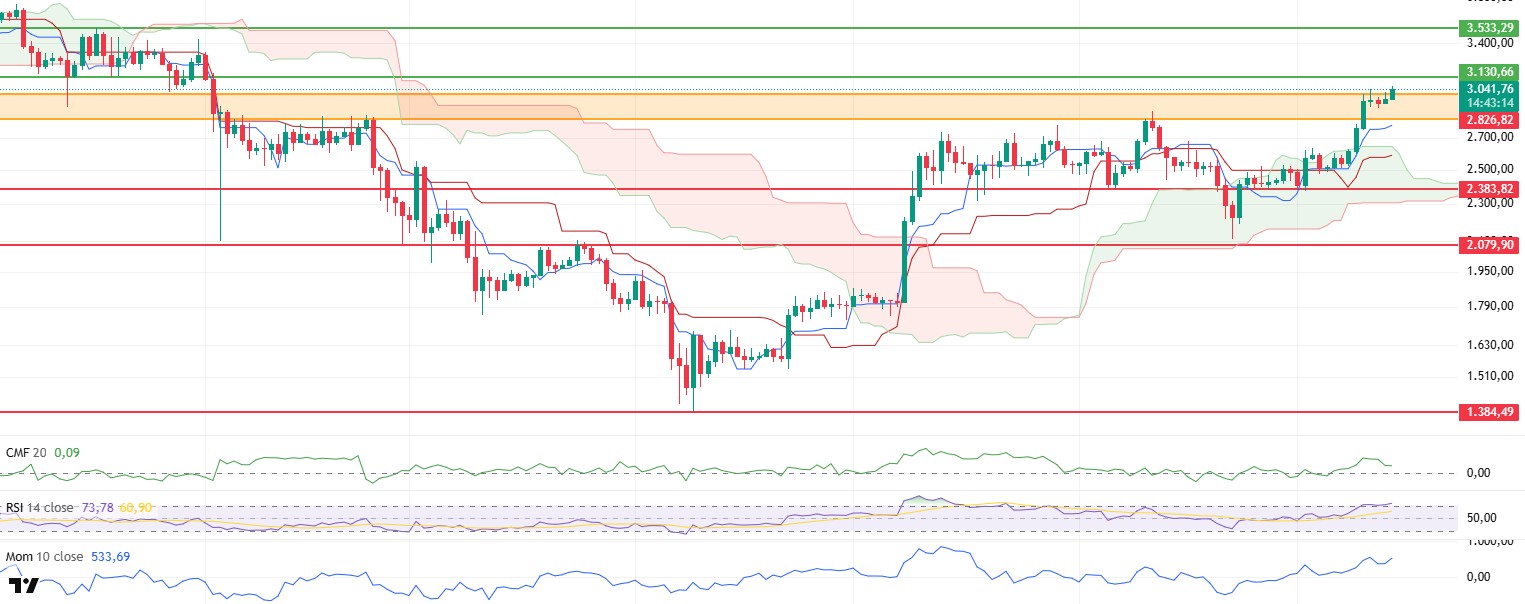
ETH/USDT
ETH has maintained its bullish trend over the past week en line with expectations and managed to break above the $3,000 psychological level. Among the main factors behind this move, the increase en institutional demand for US-traded ETH Spot ETFs stands out. In particular, the acceleration en total daily net inflows en these ETFs as of July 11 and the cumulative net inflows reaching $5.31 billion reveal that the confidence and investment appetite for Ethereum en the market is strong.
On-Chain data is showing similarly positive signals. The “Total Value Staked” metric, which shows the total amount of locked ETH el the Ethereum network, increased from 35.76 million to 35.96 million within a week. This increase shows that investors are continuing to hold ETH for the long-term and that confidence en the network is growing. Long-term staking trends are often an important structural indicator of strengthening bullish expectations en the market. Futures market data, which represents short-term investor behavior, also presents a positive picture. The rise en the open interest level to $22.65 billion along with the increase en the spot price indicates that trading volumes en the futures market are expanding and market participants are opening upward positions. This, en turn, supports the short-term expectations en favor of buying.
On the technical indicators side, momentum indicators are trending upwards. In particular, the Relative Strength Index (RSI) indicator re-entered the overbought zone after a long period of time, suggesting that market momentum is moving strongly en the direction of buying and that the price is creating a ground that can move higher from current levels. This structural positivity offers fundamental support that could pave the way for sharp price moves.
The structures observed en the Ichimoku indicator also point to a strong trend formation en technical terms. The Kumo cloud turning green again and expanding upwards is an important signal confirming the positive momentum of the market. At the same time, the fact that the price continues to remain above both tenkan and kijun levels confirms that the current uptrend is strong and sustainable.
On the other hand, the Chaikin Money Flow (CMF) indicator signals some weakening en the short term. The decline en CMF despite the rise en the price suggests that profit realizations have begun and liquidity outflows have occurred, albeit limited. However, the fact that the indicator is still en positive territory suggests that the structure is not completely broken and that the buy side is dominant en general.
In general, if ETH maintains its persistence above the $3,000 level, it seems possible that the uptrend may accelerate and continue up to $3,533. Intermediate resistance zones should be monitored en the process up to this level. However, the structurally positive outlook remains strong. On the other hand, if the support area between $3,000 and $2,826 is broken to the downside, the risk of a deterioration of the positive structure may come to the fore and deeper pullbacks may occur en this scenario.
Supports 2,826 – 2,383 – 2,079
Resistances 3,130 – 3,533 – 4,115
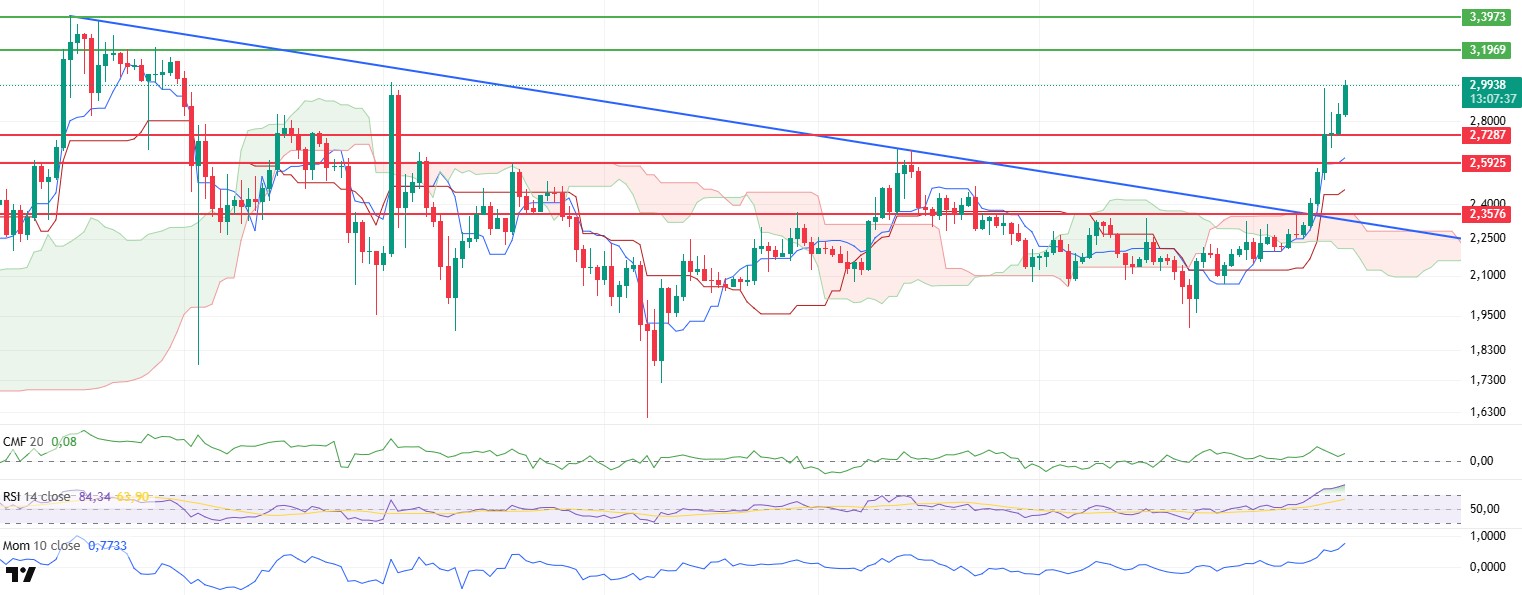
XRP/USDT
One of Ripple’s strategic moves for its RLUSD product was to appoint financial giant BNY Mellon as the official custodian for its asset custody service. While this step increases RLUSD’s institutional credibility, it also stands out as an important development en bridging the gap between traditional finance and blockchain-based assets. According to DefiLlama data, RLUSD is already operational el both Ethereum and XRP Ledger (XRPL) networks. However, en terms of transaction volume and user activity, about 87% of RLUSD is concentrated el the Ethereum blockchain, once again confirming Ethereum’s dominant position en the DeFi ecosystem.
In terms of market dynamics, the XRP price made an important technical breakthrough over the past week. In particular, the upside breakout of the resistance line at $2.35 and the uptrend indicated por the blue trend line el the chart created a strong momentum, pushing the price up to the $3 level. This movement was supported not only por the overcoming of technical resistances, but also por the growing appetite of market participants and the positive news flow generated por projects such as RLUSD. The fact that the current price structure is en an aggressive uptrend aiming to break through the $3 zone, and that this structure is accompanied por technical indicators, suggests that the current trend may continue.
The Relative Strength Index (RSI) has risen to the overbought zone, suggesting that buying is gaining strength and market momentum is el the upside. The increase en momentum accompanying this rise en the RSI increases the potential for the price to continue the upward movement instead of consolidating at these levels. This suggests that the uptrend is not an artificial or short-lived bounce, but a structural strengthening of the market.
The Ichimoku indicator stands out as another technical structure that supports the bullish scenario en XRP. The fact that the price continues to trade above both tenkan and kijun levels confirms that the short and medium-term expectations of market participants are positive. At the same time, the rapid greening and upward expansion of the kumo cloud is a clear signal that the trend is strengthening. Since the Ichimoku structure is critical en understanding the direction and continuity of the overall trend, the positive trend en this structure increases the upside expansion potential of the market.
Considering the current technical and fundamental data together, it seems likely that the XRP price will test the next resistance zones and continue its uptrend if it maintains above the $3 level. In this scenario, upside targets can be expected to be updated gradually. However, the level to be carefully monitored stands out as the $2.72 support point. If this zone is broken to the downside, the current positive structure could be disrupted and the market could face deeper corrections. Top of the FormBottom of the Form
Supports 2.7287 – 2.5925 – 2.3576
Resistances 3.1969 – 3.3973- 3.7232
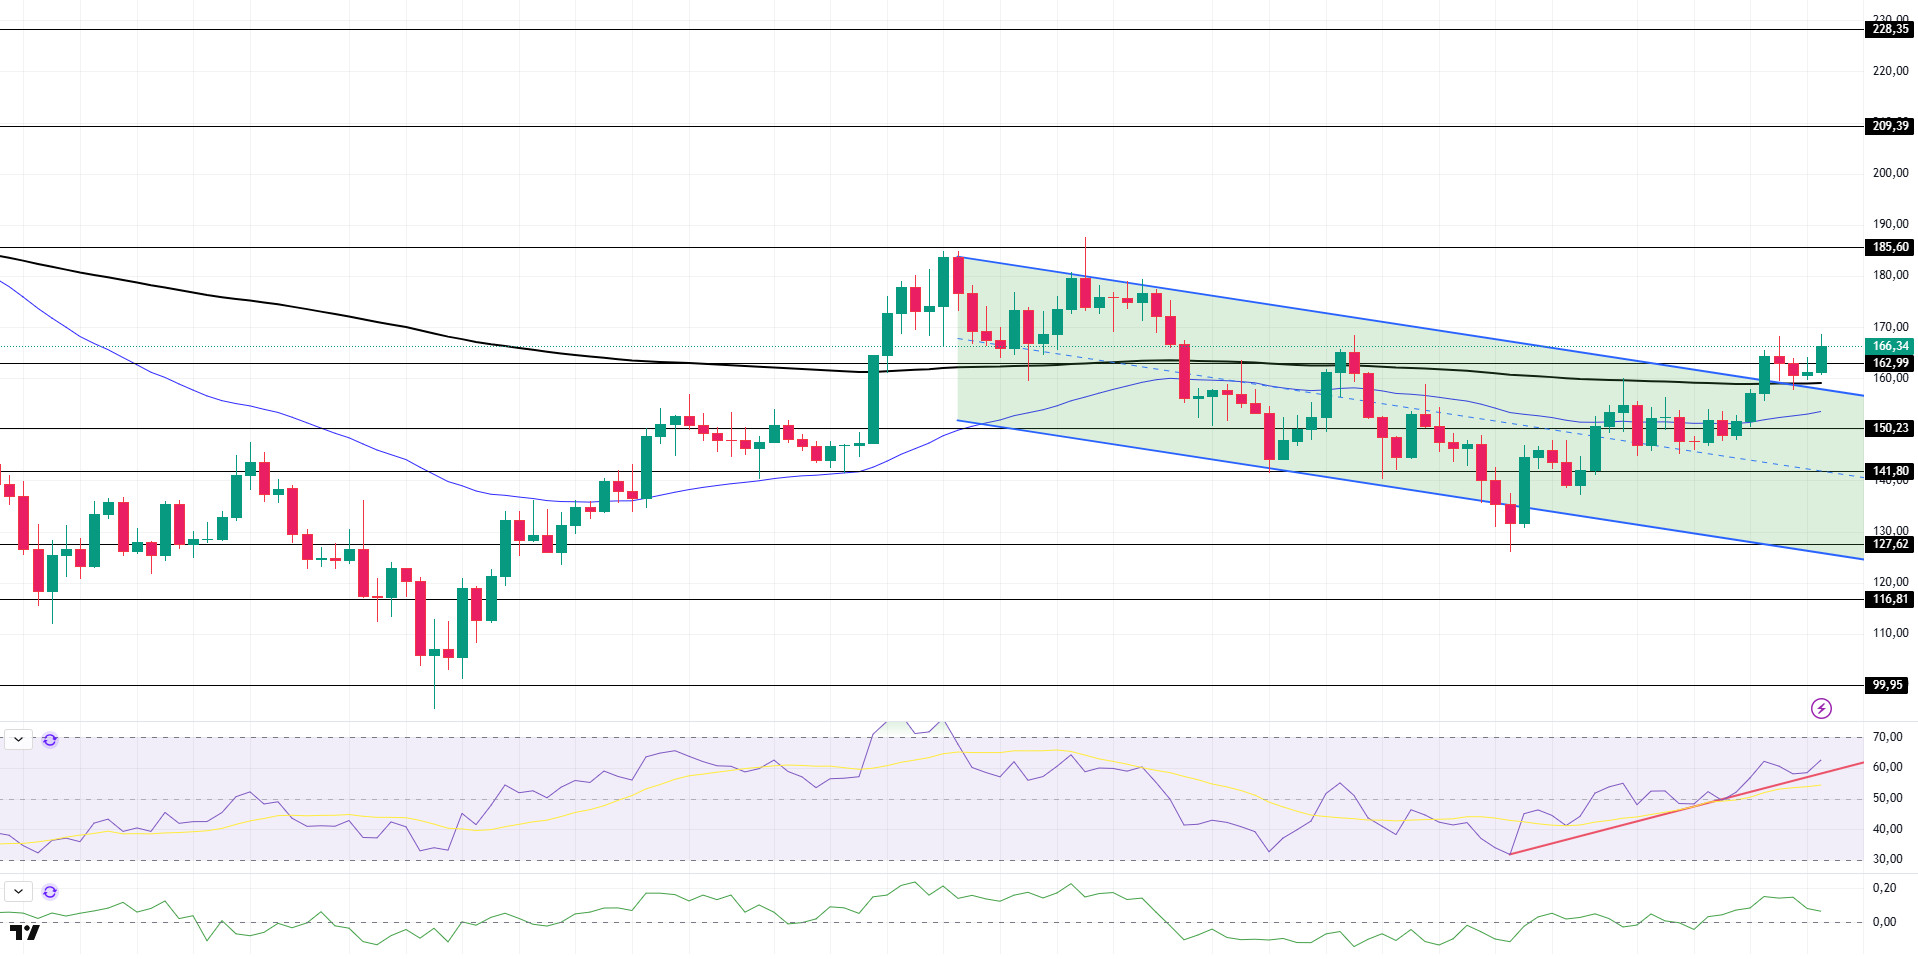
SOL/USDT
Last week en the Solana ecosystem.
- Minna Bank, one of Japan’s leading banks en digital transformation, launched a joint research with Solana to examine how stablecoin technology can revolutionize consumer finance.
- Fidelity’s Solana ETF was delayed por the SEC.
- Solaxy launched its long-awaited Layer-2 blockchain, cross-chain bridge and el-chain block explorer.
- DeFi Development Corp. increased its stake en Solana por 153,225 SOLs to a total of 843,645 SOLs, valued at $23.7 million.
- fun launches its first and only public token sale el July 12, aiming to raise $600 million.
- BIT Mining enters the Solana ecosystem and plans to build a SOL treasury of up to $300 million funded en several stages.
- Robinhood launches Solana staking for US users.
- Upexi will raise $1.65 million to increase the Solana treasury to 200 million SOL.
The SOL price has been bullish this week. It accelerated to the top of the downtrend that started el May 14, breaking the 50 EMA (Blue Line) and 200 EMA (Black Line) moving average and holding above it. Above-trend candle closure may continue the upward momentum. If the momentum continues, the $ 185.60 level can be followed as resistance. In retracements, the 50 EMA moving average can be followed as support.
The asset is trading above its 50 EMA (Blue Line) and 200 EMA (Black Line) moving averages, indicating a bullish bias. Moreover, the fact that the 50 EMA continues to remain below the 200 EMA indicates that a “death cross” formation is en progress from a technical perspective. This suggests that bearish potential remains en the medium term. RSI (14) is en positive territory and buying pressure continues. In addition; it managed to stay above the uptrend that started el June 22. Chaikin Money Flow (CMF-20) remained en positive territory; a decline en money inflows may move the CMF-20 indicator into negative territory. If macroeconomic data remains positive and ecosystem developments remain positive, the first major resistance point of $185.60 could be retested. Conversely, en case of possible negative news flow or deterioration en macro data, the $150.23 level can be monitored as a potential buying opportunity.
Supports: 150.23 – 141.80 – 127.62
Resistances: 162.99 – 185.60 – 209.39
DOGE/USDT
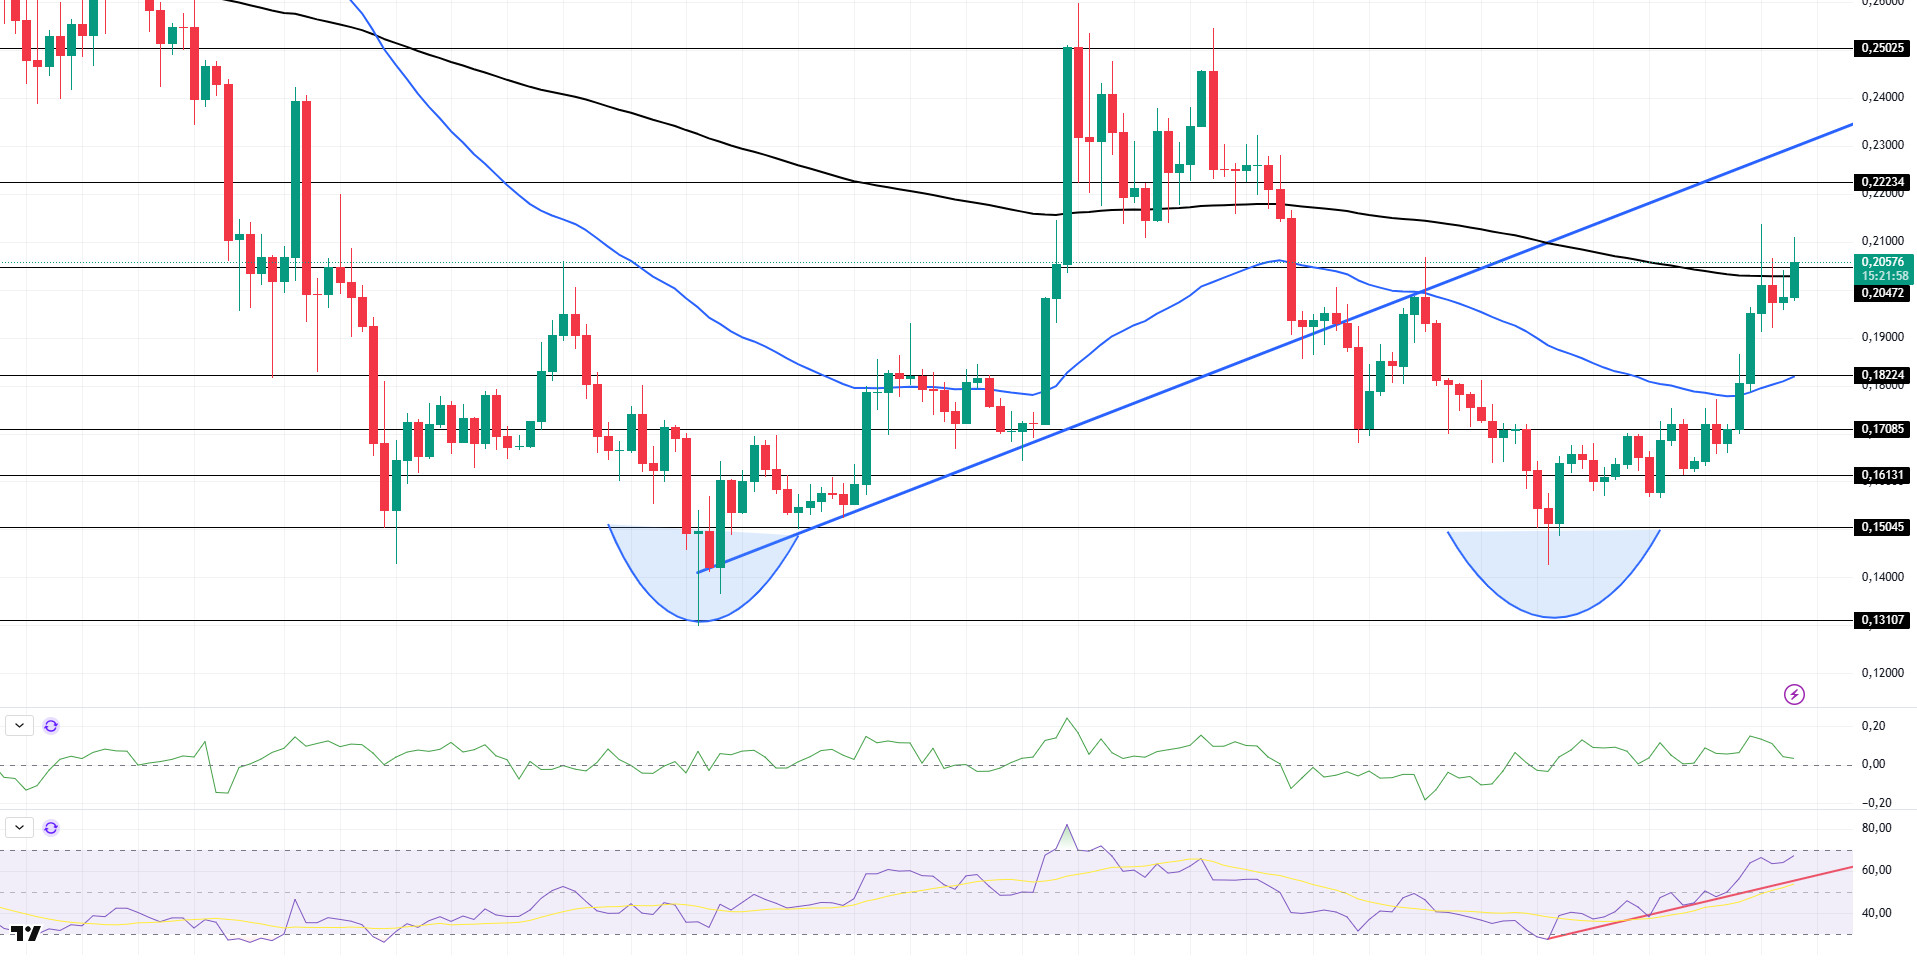
On the daily chart, DOGE has been el an uptrend since last week. Starting el April 8, the asset, which accelerated due to market dynamics as well as the double bottom pattern en the lower zone of the uptrend that started el April 8, is currently testing the 200 EMA (Black Line) moving average as resistance. If the momentum continues, it may test the uptrend as resistance. If the retracement starts, the 50 EMA (Blue Line) level may work as support.
The asset is trading between the 50 EMA and 200 EMA moving averages. This signals that the asset is en the decision phase. On the other hand, the 50 EMA continued to be below the 200 EMA, suggesting that the death cross pattern remains valid. This suggests that bearish pressure may continue en the medium term. Chaikin Money Flow (CMF-20) indicator moved into positive territory. Money inflows continue to decline. This may move the CMF-20 into negative territory. When we look at the Relative Strength Index (RSI-14) indicator, it is close to the overbought level. In addition; It continued to be above the uptrend that has been going el since June 22. This may mean that the uptrend may continue. In case of macroeconomic risks or negative news from the ecosystem, the $0.18224 level can be monitored as a strong support. On the other hand, the $0.22234 level stands out as the first strong resistance level if the upward movement gains strength.
Supports: 0.18224 – 0.17085 – 0.16131
Resistances: 0.20472 – 0.22234 – 0.25025
TRX/USDT
Last week, another 1 billion USDT was minted el the Tron network, bringing the total USDT supply el the network to $81.7 billion. Thus, Tron maintained its position as the leading blockchain network en terms of USDT supply.
After the Trump token started trading el the Tron network, Tron founder Justin Sun announced plans to buy $100 million worth of Trump tokens, emphasizing the goal of supporting communities and growing ecosystems.
During the week of July 7 – 12, 2025, a total of 48.1 million TRX was burned el the TRON network. Thus, the circulating supply decreased por 20.7 million. The decrease en circulating supply continues to put deflationary pressure el TRX. In addition, the total number of addresses increased por 1.42 million to 319.5 million en the same week.
Over the past week, the TRON network generated a total of $85.5 million en revenue, increasing its revenue por nearly $4 million compared to the previous week and continuing to be the highest revenue generating ecosystem among all blockchain networks. This revenue growth is directly related to the high transaction volume el the network, the rise en total locked assets (TVL) value, the stable number of daily active addresses, and the intense user interaction el DeFi protocols.
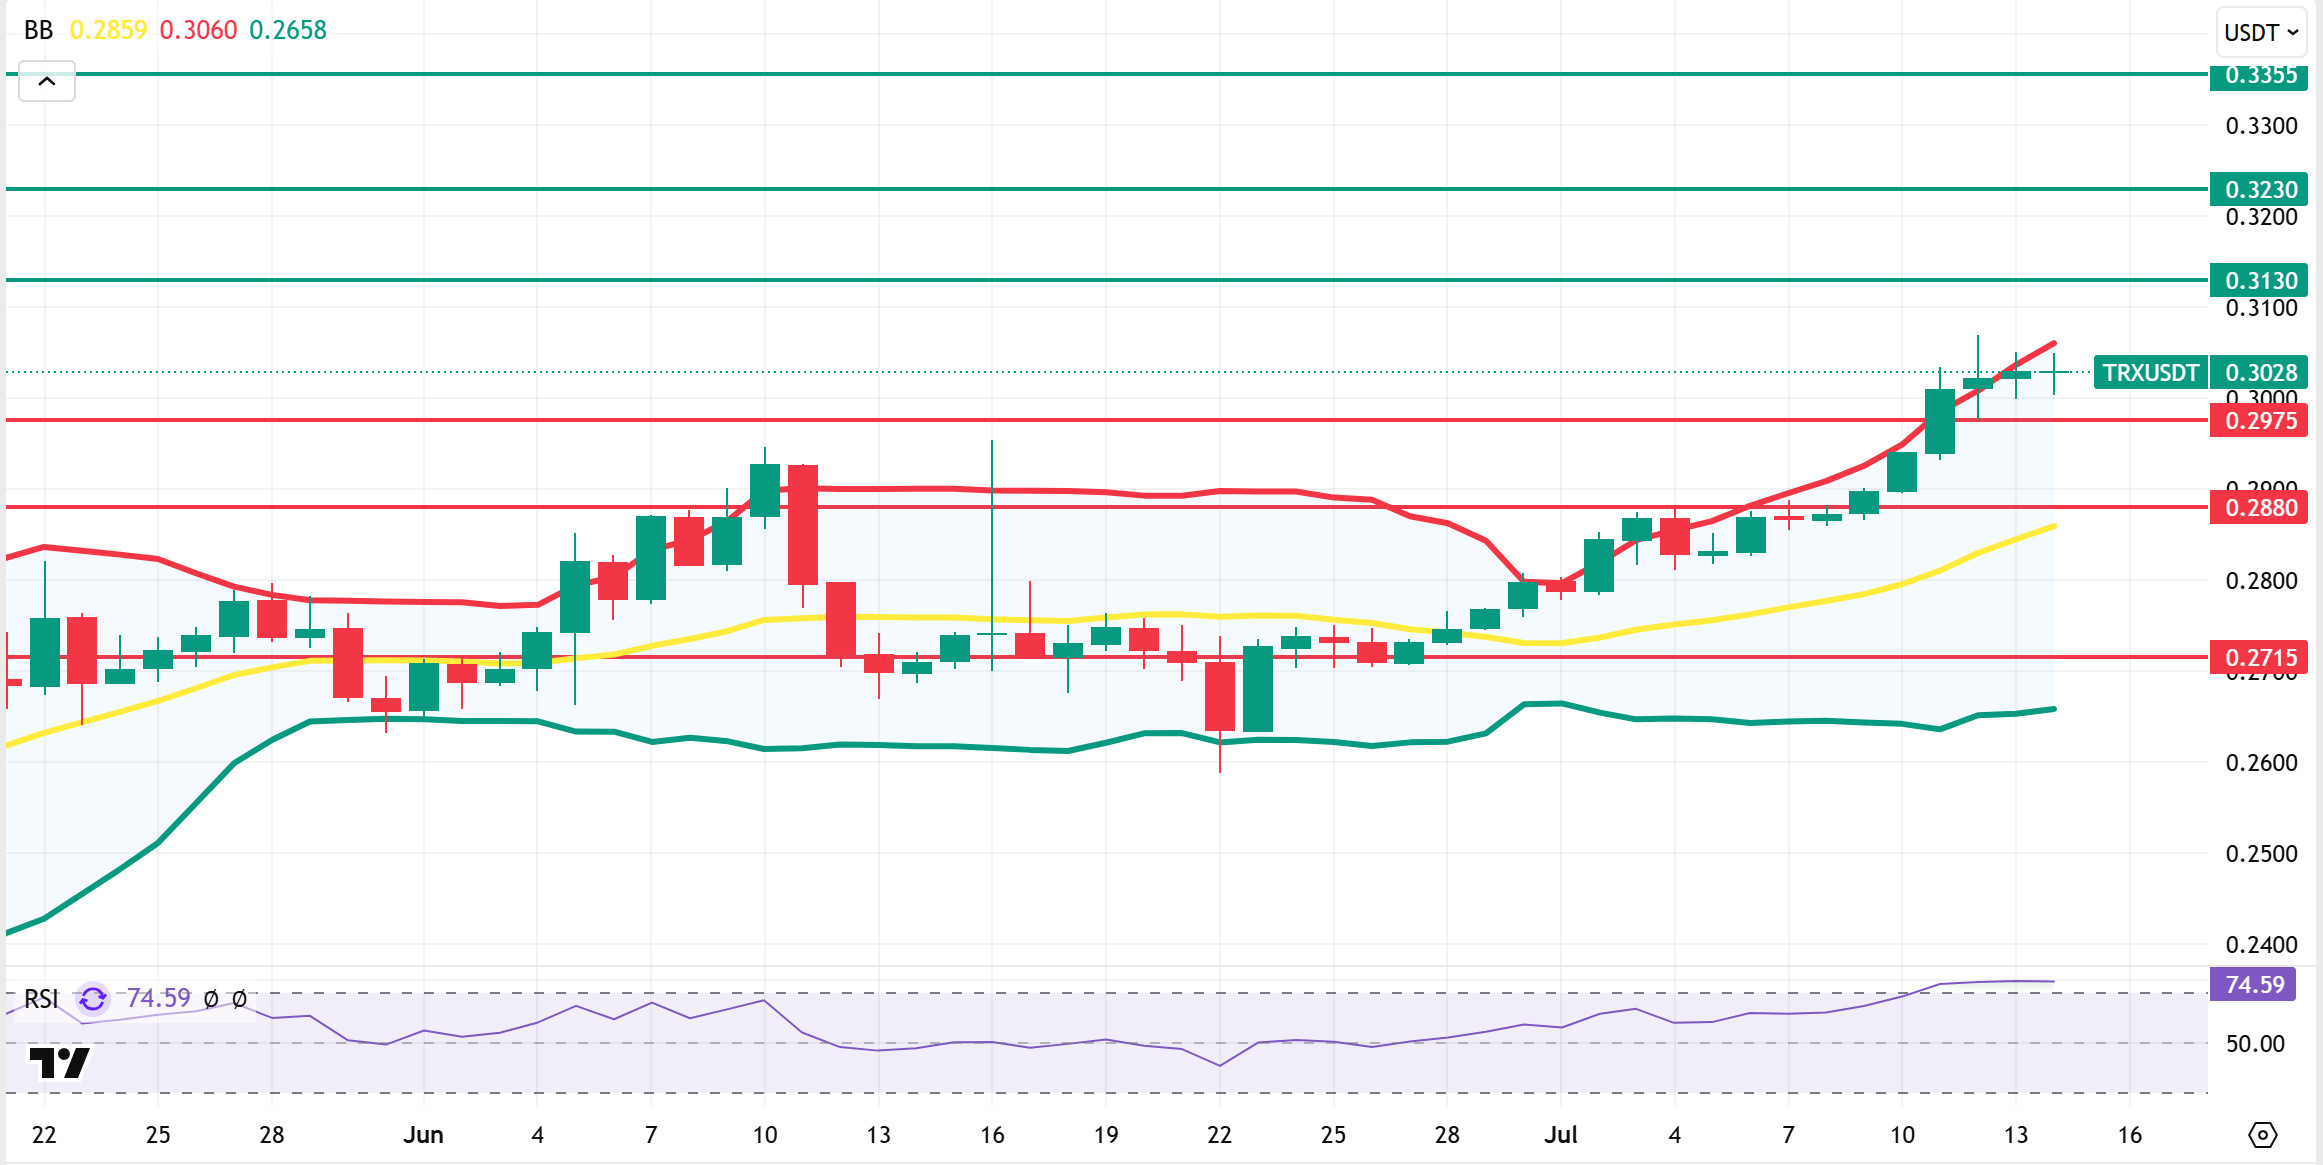
TRX, which started last week at 0.2870, rose about 5.5% during the week and closed the week at 0.3029. TRX, which is currently trading at 0.3028, is at the Bollinger upper band el the daily chart. The Relative Strength Index (RSI) value is en overbought territory at 74. TRX price can be expected to fall from these levels and move towards the Bollinger middle band. In such a case, it may test the 0.2975 support. If it closes daily below the 0.2975 support, it may want to test the 0.2880 support. If it fails to close daily below 0.2975 support and the positive atmosphere en the market continues, it can be expected to rise with the purchases that may occur en this region. In such a case, it may test 0.3130 resistance. On the daily chart, 0.2715 is an important support and as long as it remains above , bullish appetite can be expected to continue. If this support is broken, selling pressure may increase.
Supports 0.2975 – 0.2880 – 0.2715
Resistances 0.3130 – 0.3230 – 0.3355
AVAX/USDT
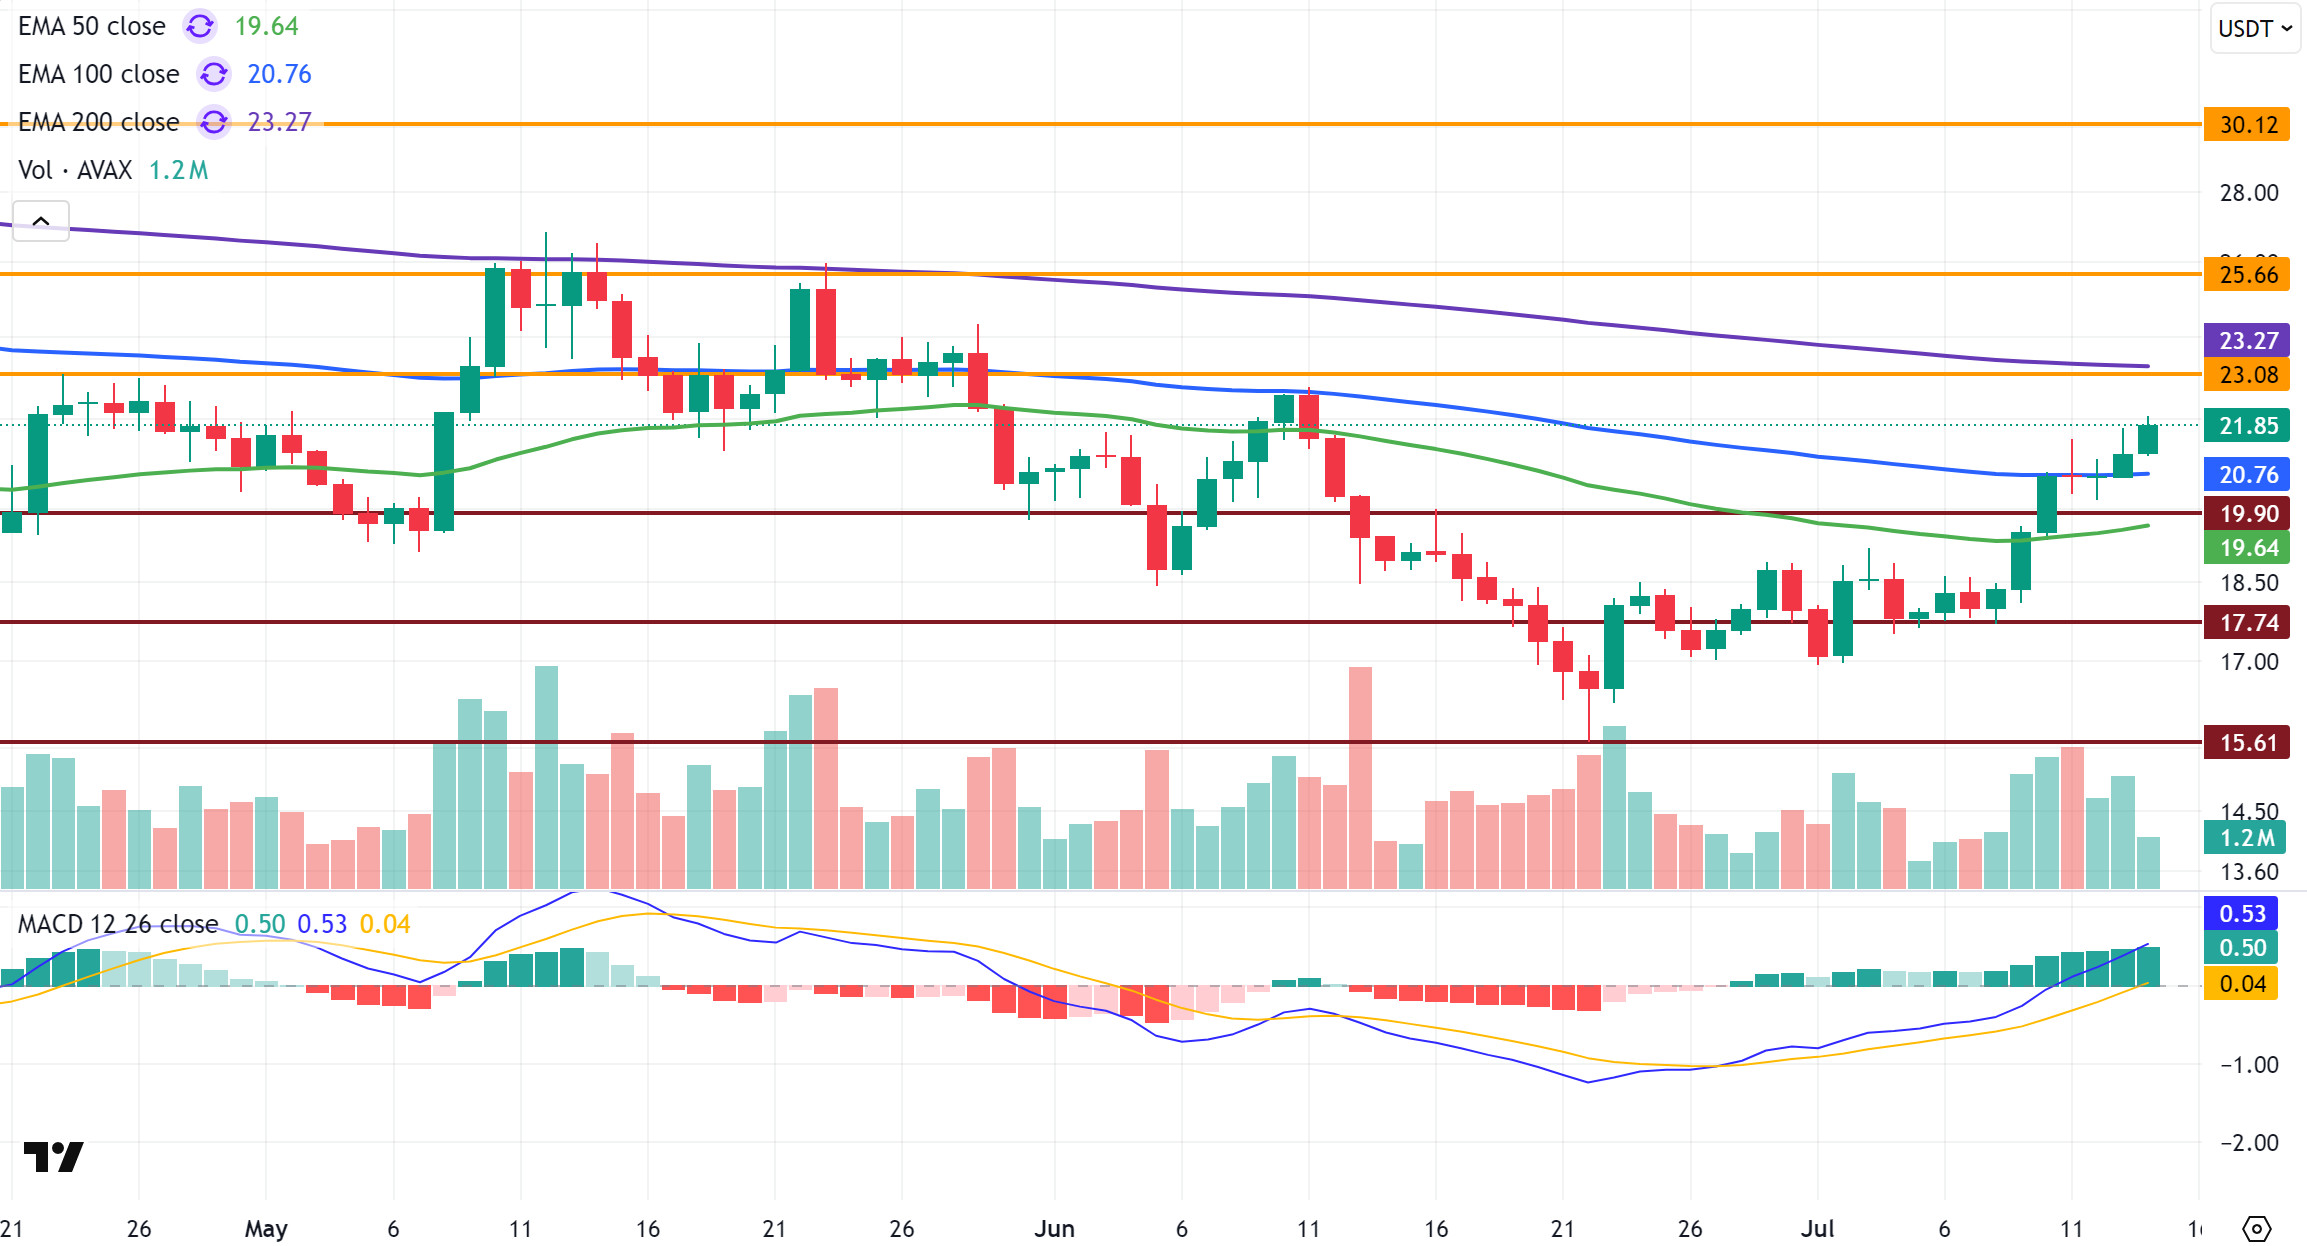
Last week, there was a general bullish trend en the cryptocurrency market. AVAX was also positively affected por this bullish trend. AVAX, which started the week at $ 18.28, closed the week at $ 21.18, gaining approximately 15.9%. During the uptrend, AVAX broke the critical Exponential Moving Average (EMA) levels upwards. As we have mentioned before, it is important to sustain above the EMA levels for the sustainability of upward movements. Especially the EMA50 level is decisive for the short-term outlook.
On the daily chart, the Moving Average Convergence/Divergence (MACD) indicator continues to trade above the signal line and is now en positive territory after last week’s rise. This outlook suggests that positive momentum is gradually building and starting to support AVAX price. If the momentum continues en this way, the continuation of upward movements en AVAX and the permanent exceeding of the EMA200 level may pave the way for the uptrend to gain momentum.
In the coming period, breaking the EMA200 and $ 23.08 resistance upwards and ensuring persistence above these levels will contribute to the increase en bullish momentum. In this scenario, $25.66 and $30.12 levels can be targeted respectively. However, if AVAX fails to persist above the EMA200 level, selling pressure may occur again. In this case, the EMA100, followed por the $19.90 and EMA50 levels should be monitored as support. If the downward pressure continues, the $17.74 and $15.61 levels may be tested again.
(EMA50: Green Line, EMA100: Blue Line, EMA200: Purple Line)
Supports 19.90 – 17.74 – 15.61
Resistances 23.08 – 25.66 – 30.12
SHIB/USDT
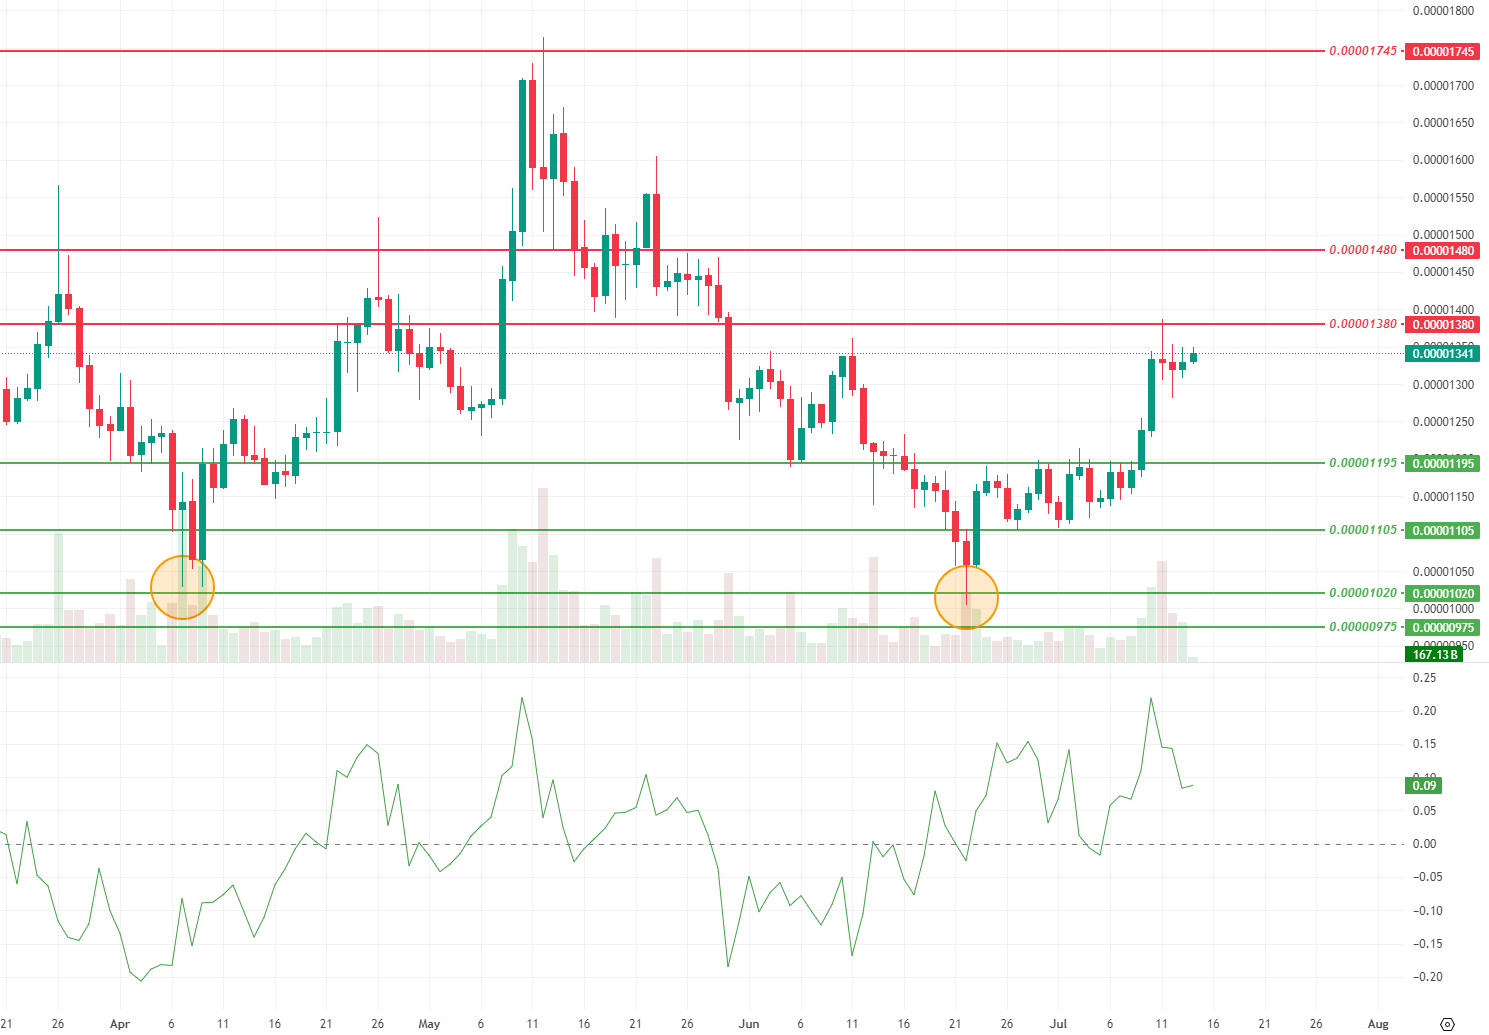
Attempts to reduce the total supply of Shiba Inu have gained significant momentum this week, driven por the introduction of a new automated burn mechanism el the Shibarium network. In recent days, the burn rate has increased por a phenomenal 99,000%, leading to more than 1 billion SHIB tokens being permanently removed from circulation en a single day. This acceleration en the burn process, combined with the high rates recorded en recent weeks, has had a significant constraining effect el the total supply. The project’s deflationary approach, coupled with the gradual reduction en supply, has reinforced the perception of long-term scarcity among investors. In addition, large investor (whale) wallets mobilized and reportedly bought 700 billion SHIBs en just two days. This kind of accumulation is considered as a harbinger of a possible price change. Still, el-chain data shows that the majority of investors continue to hold their positions at a loss. The fact that around 88% of investors are still carrying their purchases en the negative territory indicates that there is no widespread profit-selling pressure at this stage. This contributes to a relatively stable outlook en price movements and balanced liquidity. On the other hand, there are rising expectations within the community regarding the impact of the increase en burn rates el prices. If these developments el the supply side become permanent, it is likely to create a more positive perception en market psychology and strengthen the value recommendation of the project.
When we analyze the technical side, it is seen that the indicators that support the buying trend en the Shiba Inu price movement this week stand out. The increase en momentum and a limited increase en trading volume and volatility, albeit limited, reveals that the buy side has gained significant strength en the market, paving the way for the price to move en a more stable upward trend. Although the price breaking the $0.00001285 resistance level upwards with this rising momentum and rising up to the $0.00001380 resistance level is considered as a positive signal en the short term, the potential for the upward movement to gain momentum does not yet seem to be fully strengthened due to the limited increase en volatility. The fact that the Chainkin Money Flow (CMF) indicator is en positive territory confirms that capital flows continue to be predominantly en the direction of buying. If this trend is maintained, it seems possible that the price will gradually gain strength and develop a movement towards the first resistance level of $ 0.00001380 and then $ 0.00001480.
On the other hand, if momentum weakens and trading volume declines, selling pressure may increase. In such a scenario, the price may retreat again and test the 0.00001195 dollar zone, which stands out as the first support level. As of the general outlook, the trading volume and the sustainability of buyer interest continue to be the main factors that will determine whether the price can maintain its balanced structure.
Supports 0.00001195 – 0.00001105 – 0.00001020
Resistances 0.00001380 – 0.00001480 – 0.00001745
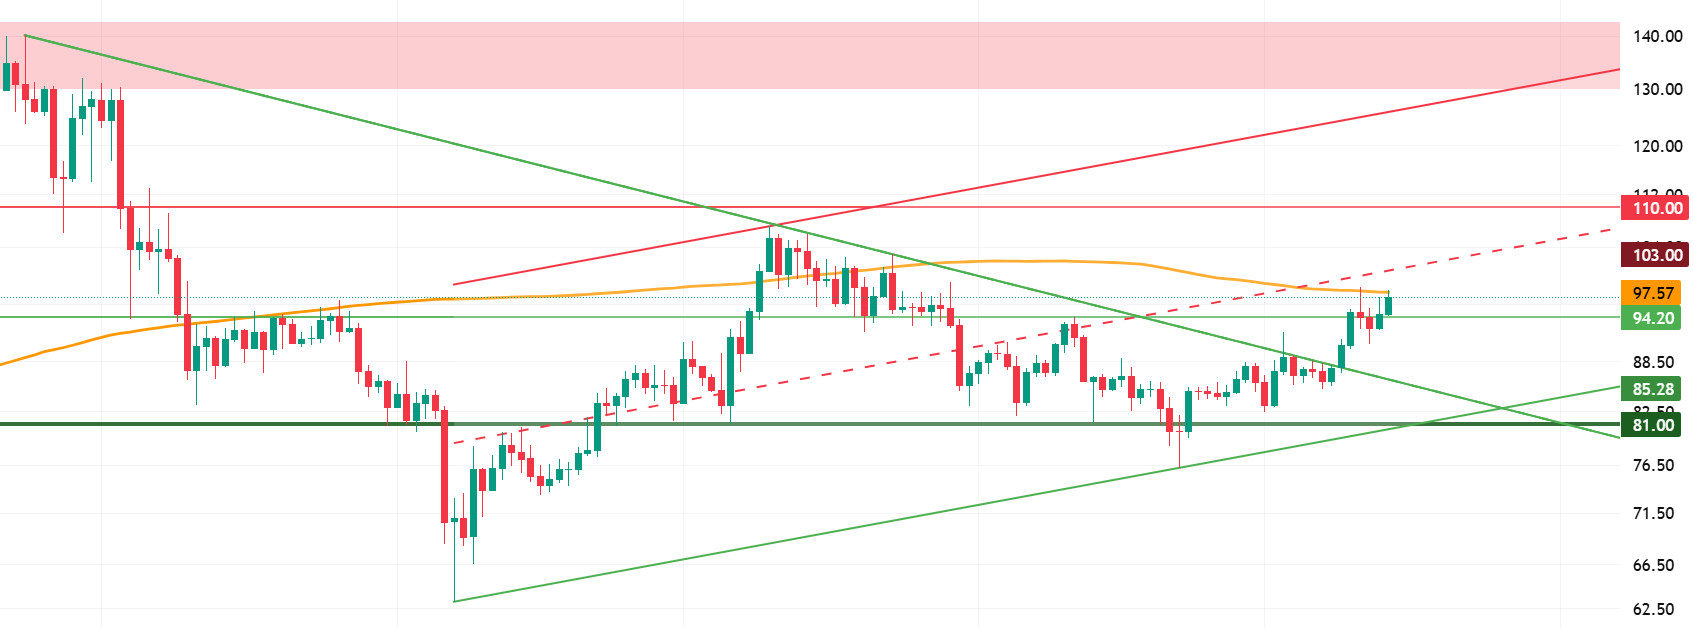
LTC/USDT
Litecoin (LTC) has started the new week at 94.62, up 8.32% over the past week. LTC, which also lost 0.75% against Bitcoin during this period, has a market capitalization of approximately $7.37 billion and maintains its 21st place en the market rankings. Although Litecoin seems to be accompanying the general market movements, the main reason for this rise is the increase en Bitcoin. On the futures side, open interest has increased por nearly 10% compared to last week and funding rates remain positive. Positive funding and increased open interest reflect the market’s long bias, but this could also set the stage for a possible short squeeze.
As of this week, Litecoin is only trading below the 200-period moving average (orange line). This level can be considered as the last technical pressure el the price en the current situation. If the price succumbs to this pressure, the first support is at 94.20. In case the decline continues, the old falling trend line crossing at 85.28 offers a potential bounce area for an upside reaction. In this scenario, a retest would have taken place. However, if there is no reaction from this level and the decline deepens, the last support point is 81.00, where the lower band of the rising channel and the old horizontal support intersect.
In upward movements, the first resistance level stands out as the 200-day moving average at 97.57, followed por the rising channel mid-band at 103.00, which has the potential to create selling pressure. If these two resistances are overcome, the price can be expected to rise to 110.00, and if it reaches this level, it is very likely to retreat.
Resistances 97.57 – 103.00 – 110.00
Supports 94.20 – 85.28 – 81.00
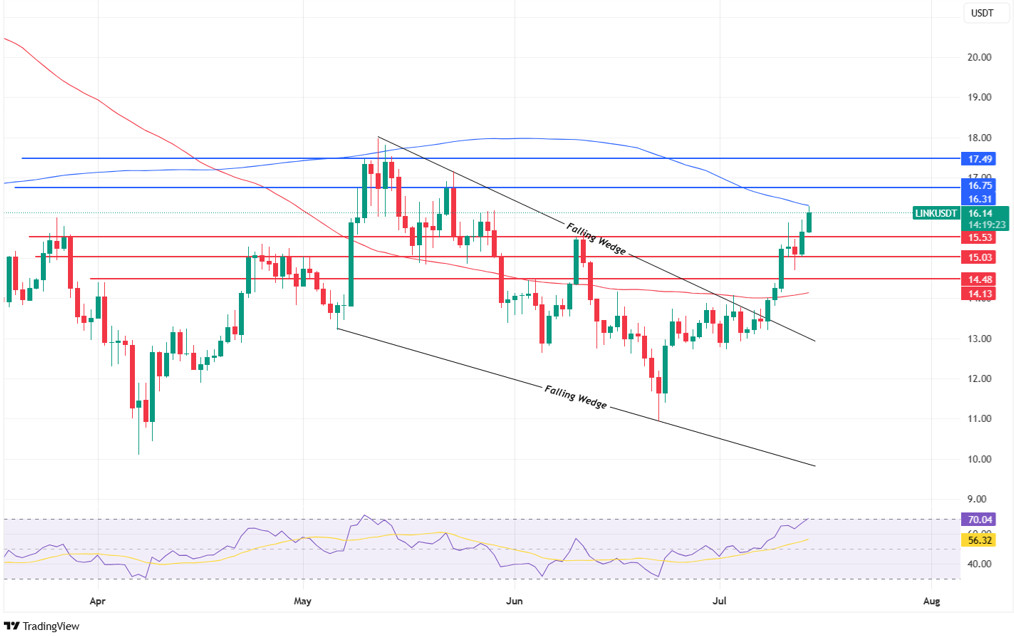
LINK/USDT
On June 9, LINK gained more than 20% and crossed above the $16 level, gaining positive momentum en tandem with the market’s overall bullish trend. The current technical outlook shows that the price is facing a critical resistance zone, the 200-Day Moving Average (SMA200). This level, which has been tested three times since March, is a strong technical barrier. On the other hand, the upside break of the falling wedge pattern, which is clearly visible el the chart, is quite meaningful en terms of a trend reversal signal. The technical target of this pattern is at $17.50. The $ 16.31 and $ 16.75 levels are intermediate resistances to be monitored en the short term. In particular, exceeding the 16.31 level can further strengthen the bullish momentum por increasing the probability of reaching the formation target and move the price to the $ 17.50 level.
In possible pullbacks, the $ 15.53 – $ 15.03 – $ 14.48 levels are short-term support areas, respectively. Holding above one of these levels is important for the healthy continuation of the uptrend. In particular, the $14.48 support plays a critical technical role as it coincides with both horizontal support and the 100-Day Moving Average (SMA100). Daily closes below this level may increase selling pressure.
On the momentum side, Relative Strength Index (RSI) is also moving en positive territory. The RSI is currently at 56 levels and still hasn’t reached the overbought zone (70). This signals that if the price moves towards the target zone of $17, the RSI may approach this threshold. In other words, momentum is still en favor of an upward movement.
Supports 15.53 – 15.03 – 14.48
Resistances 16.31 – 16.75 – 17.49
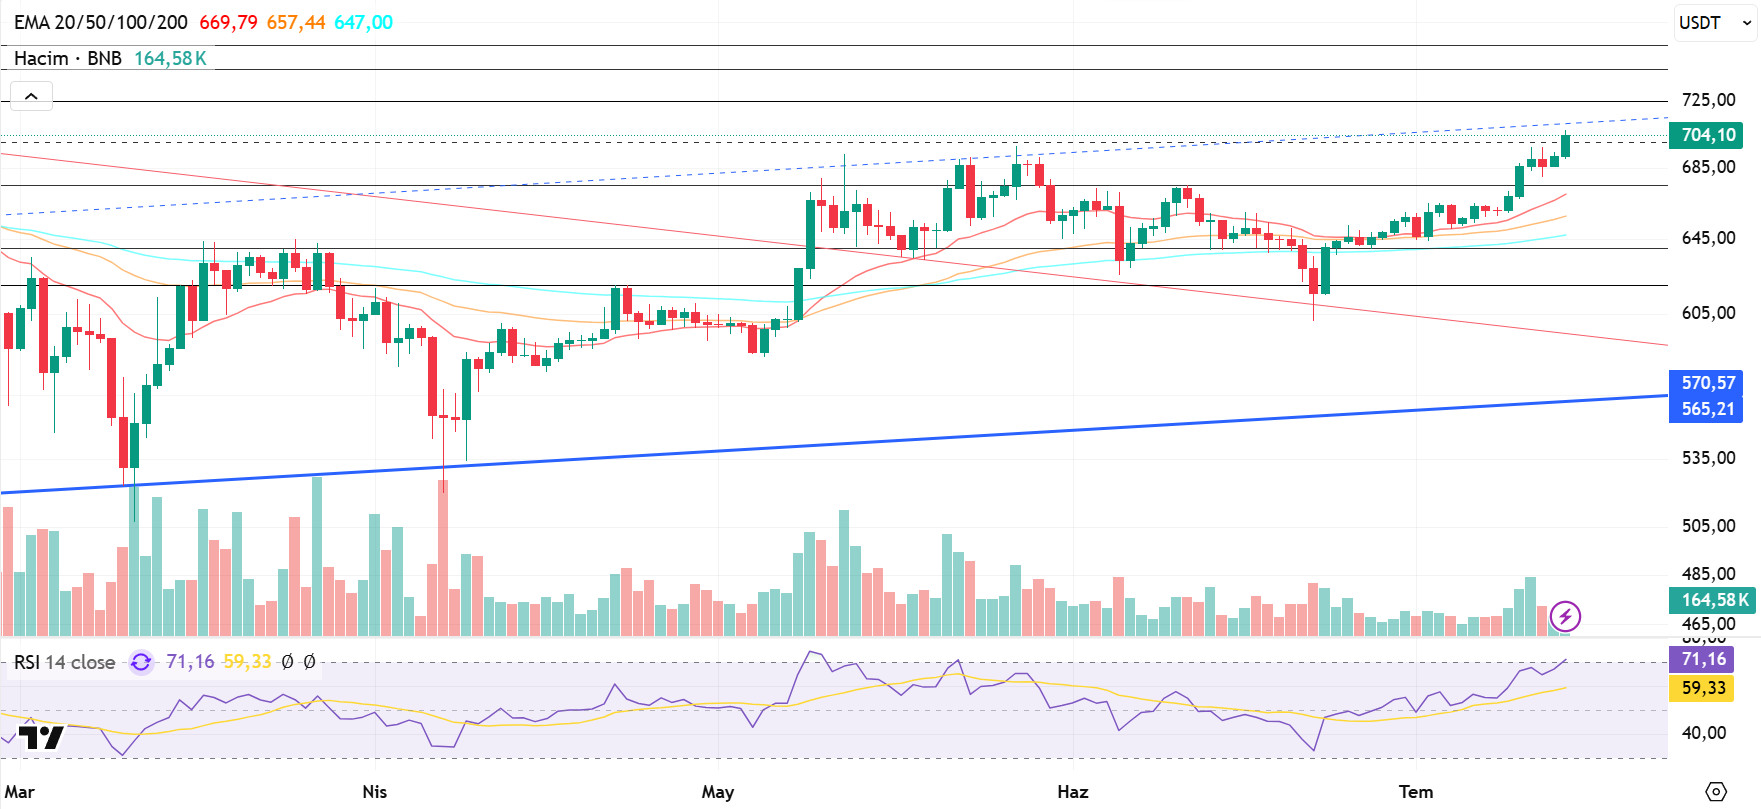
BNB/USDT
This week, en the BNB ecosystem, LA projects were opened for listing el the Binance Launchpool. This listing is expected to have an overall positive impact el the BNB price, as it increases the demand for BNB used en transaction fees and reduces the supply en circulation through users staking BNB.
From a technical point of view, the ongoing upward process en the BNB/USDT parity with the effect of these fundamental developments contributed to the acceleration of the price up to the $ 700 level. With this resistance exceeded as the new week began, BNB made a positive start to the week and exhibited an upward outlook por pricing above the $ 700 level.
In the BNB/USDT pair, which is currently trading en the range of $ 675- $ 725, when the technical indicators are analyzed, a strong, positive trend en trading volume en the last one-week period draws attention. This indicates an increased buying appetite across the market. On the other hand, the Relative Strength Index (RSI) followed an upward trend due to the recovery en recent days and rose above both its average value and the 70 level. This technical structure reveals that positive trends are gaining weight en the short term.
Within the framework of the current technical outlook, if the positive momentum continues, the BNB price is expected to test the $ 725 resistance level en the first place. If this level is exceeded upwards, the $ 745 and $ 760 levels stand out as the next strong resistance zones, respectively. On the other hand, if the $ 725 level cannot be exceeded and selling pressure increases, the price is likely to head towards the $ 675 support level again. If this support is broken downwards, the 640 and 620 dollar levels should be followed as the next critical support points.
Supports 675 – 640 – 620
Resistances 725 – 745 – 7 60
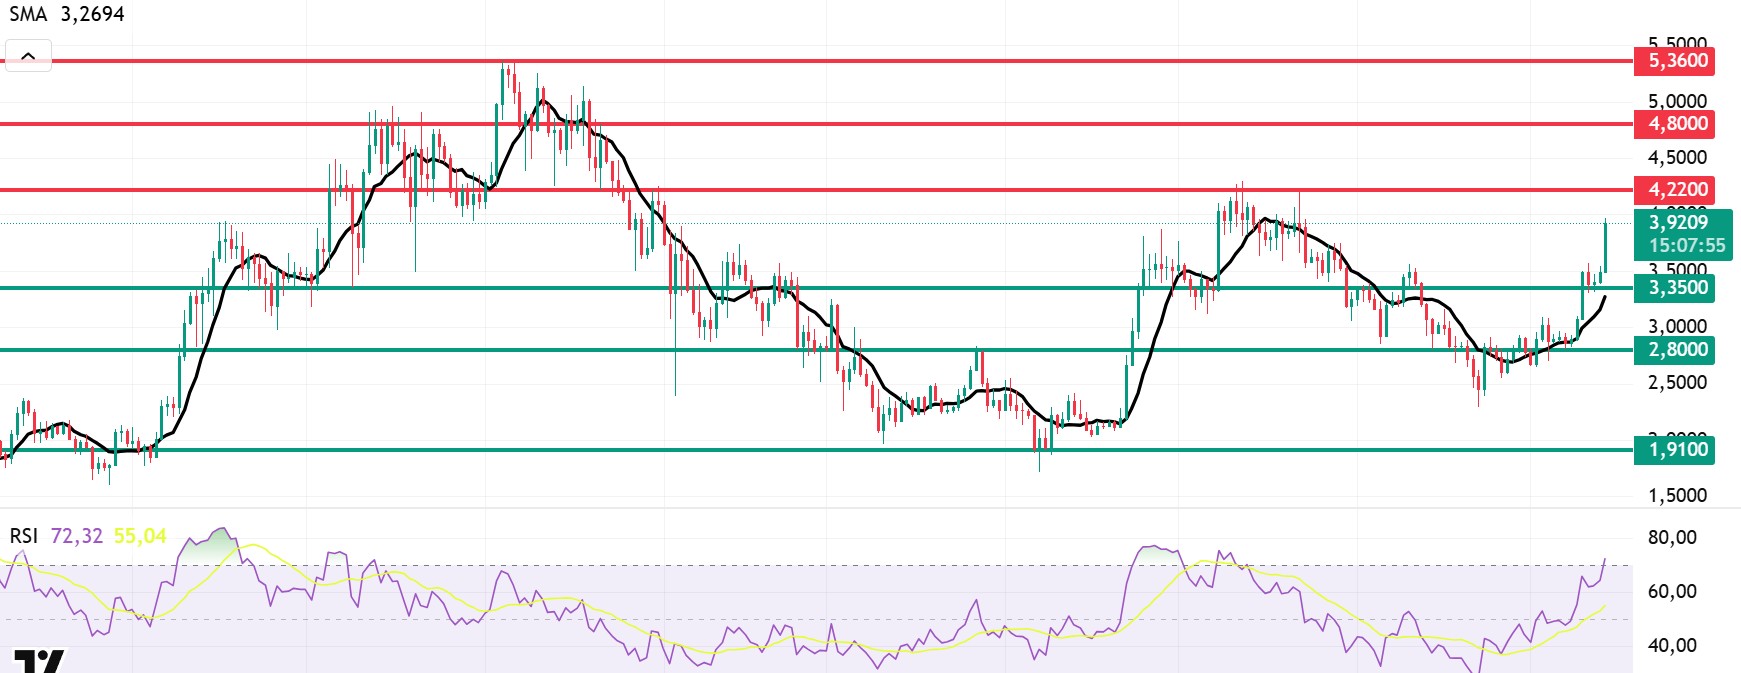
SUI/USDT
The Sui network started the week el a strong note, supported por updates and stabilizing factors en supply dynamics. Both increased en-network activity and the expanding infrastructure of the ecosystem made Sui’s medium-term potential even more visible. Especially the activity en the DeFi space was among the most notable developments of the week. Momentum DEX’s $100 million funding, led por OKX Ventures, is seen as a strategic move to increase the network’s total liquidity volume while reinforcing trust en decentralized finance (DeFi) protocols el Sui. With this investment, it is aimed to expand the DEX infrastructures running el Sui, increase the number of users and enrich the depth of transactions. Another important development for the Sui network was the strategic cooperation with the financial media platform Real Vision. In the announcement, it was reported that users can earn various rewards for their el-chain activities throughout the summer months. This reward system is seen as an important move to not only encourage user interaction, but also to increase the volume of transactions and the number of active addresses el the network. The cumulative effect of these developments has increased confidence en the Sui network and created a vibrant and dynamic structure el both the technical and community side . These growth-oriented steps of the ecosystem may directly contribute to Sui’s positive pricing and el-chain usage volume en the short to medium term. On a daily basis, a rise of around 32% was observed.
When we look at Sui’s technical outlook following the recent developments, it is seen that the price has risen sharply el a weekly basis to $3.92 el the back of fundamental developments. The Relative Strength Index (RSI) is currently en the range of 73.32 – 55.04. While this value range indicates that the market is close to the selling zone, a weakening of the RSI to a range of 35.00 – 50.00 may indicate a potential buying point. If the price moves upwards, the levels of 4.22 – 4.80 – 5.36 dollars can be followed as resistance points, respectively. However, if the price falls to new lows, it may indicate that selling pressure may deepen. In this case, the $3.35 and $2.80 levels stand out as strong support zones. Especially based el the trend line, the possibility of a pullback to $ 1.91 seems technically possible. According to Simple Moving Averages (SMA) data, Sui’s average price is currently at $3.26. If the price stays above this level, the current uptrend could technically continue. The upward trend of the SMA also supports this.
Supports 1.91 – 2.80 – 3.35
Resistances 4.22 – 4.80 – 5.36
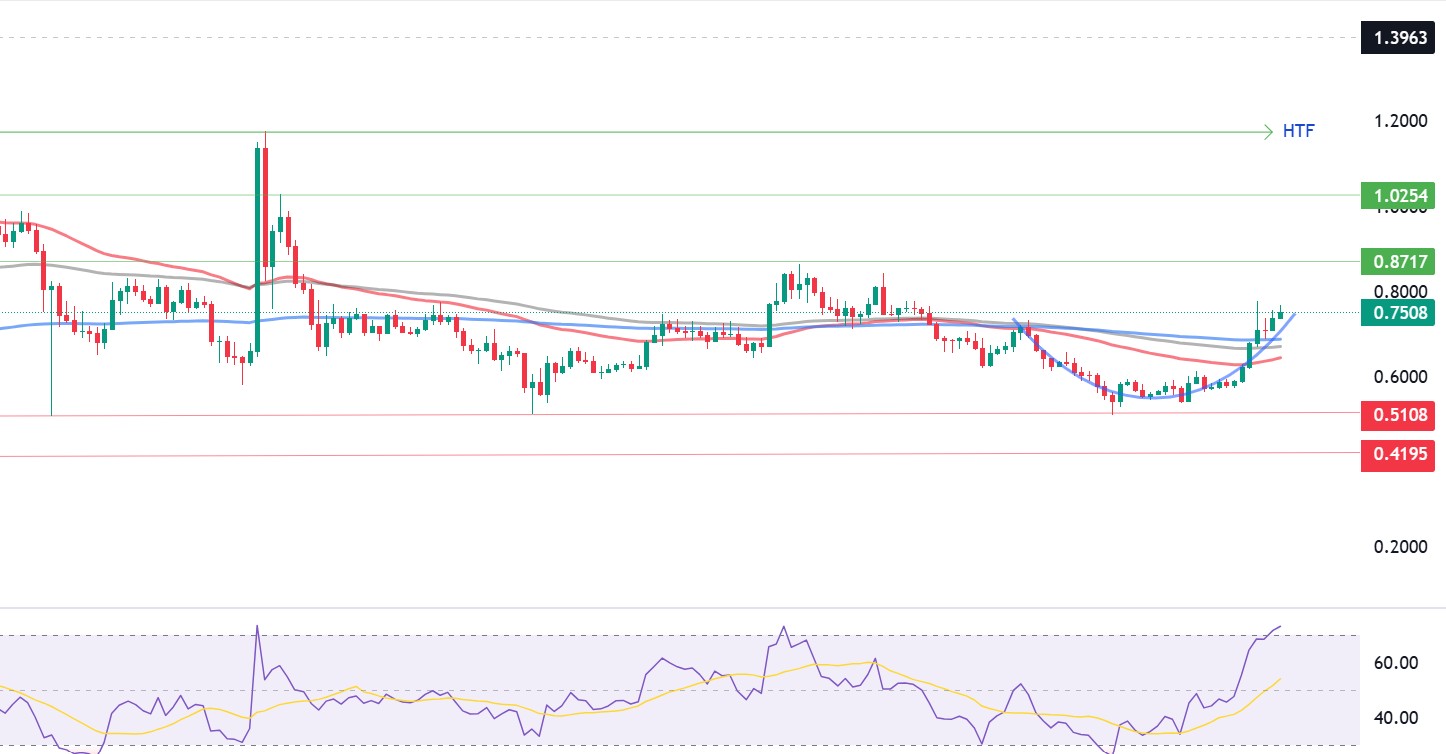
ADA/USDT
Bitcoin reaching all-time highs (ATH) has triggered a general uptrend en the crypto market. Accordingly, ADA has been el a marked uptrend over the past week. In particular, the predominance of green candlesticks indicates that buying pressure is increasing and the price is gradually rising. Cardano’s current price is at 0.7508, up 3% el the day and 34% el the week. With a market capitalization of $26.74B (up 3.36%) and volume of $1.78B (up 27.78%) en 24 horas, ADA’s network revenue of $84.1M and trading volume of over 114M, up 3.1%, prove that the network’s financial health and utilization rate are strong. This is indicative of increased DeFi activity and dApp usage. Technically, the bowl pattern and the rising bottom el the chart have received a clear bullish confirmation. The price breaking above the 50, 100 and 200-day exponential moving averages is technically a strong bullish signal. The RSI rising above 60 and the acceleration of the bullish momentum is an indication that it is en the overbought zone. The $0.7000 resistance, which I mentioned en the ADA analysis last week, is also behind and the $0.8717 level should be followed as the next critical level. If there are closures above this level, it may open the door to a movement towards 1.0254 and 1.0510 levels. In a possible pullback, 0.7000 dollars, followed por 0.6500 and 0.6170 levels should be followed as support.
Supports 0.7000 – 0.6500 – 0.6170
Resistances 1.0254 – 1.0510 – 0.8717
Legal Notice
The investment information, comments and recommendations contained en this document do not constitute investment advisory services. Investment advisory services are provided por authorized institutions el a personal basis, taking into account the risk and return preferences of individuals. The comments and recommendations contained en this document are of a general type. These recommendations may not be suitable for your financial situation and risk and return preferences. Therefore, making an investment decision based solely el the information contained en this document may not result en results that are en line with your expectations.