
BTC/USDT
As the crypto market prepares for the close of March, macroeconomic developments continue to set the agenda. Last week, the US Federal Reserve (FED) kept interest rates unchanged while revising growth forecasts downwards. Powell emphasized that there is no need to change policies en a hurry. On the other hand, Trump called for crypto regulations at the Blockworks Digital Asset Summit, while Metaplanet bought another 150 BTC, bringing its total holdings to 3,350 BTC. North Korea-linked Lazarus Group’s Bitcoin holdings reached $1.18 billion. Next week, PCE data, growth rates and the confirmation hearing of SEC chairman candidate Paul Atkins will be closely monitored por the markets.
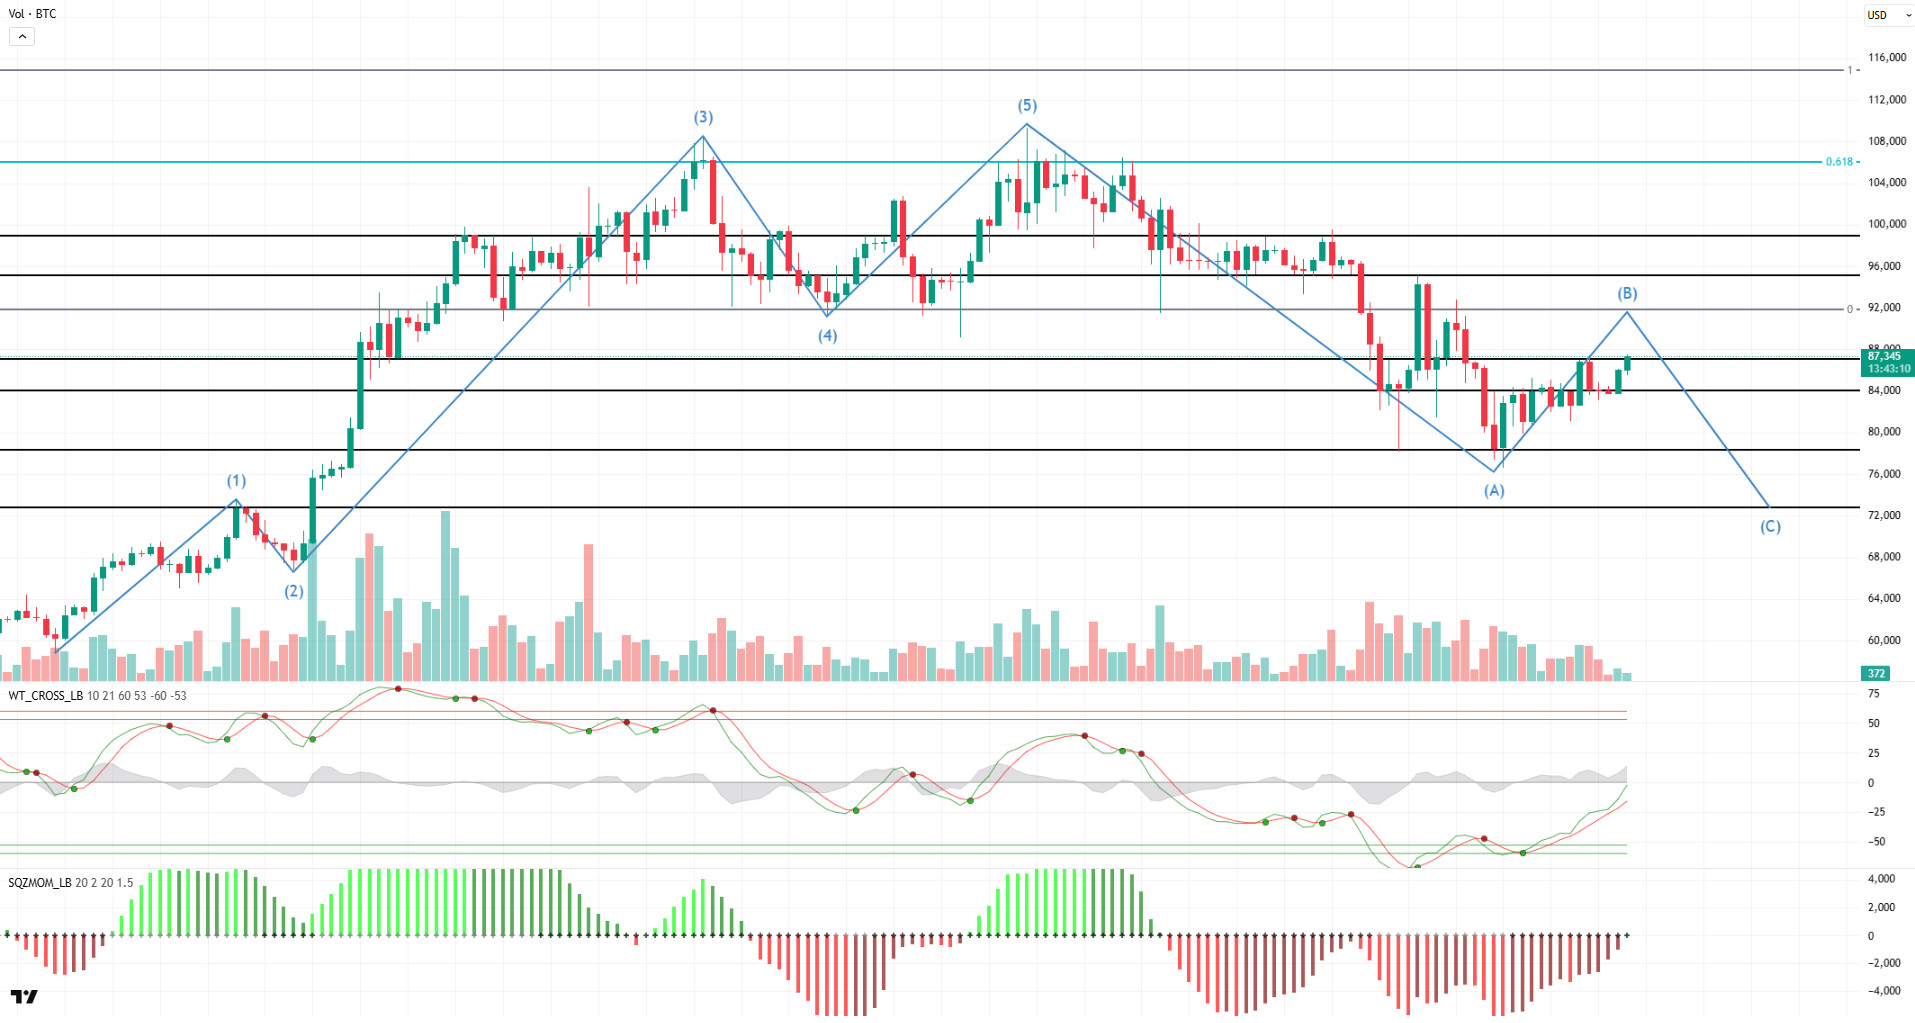
When we look at the technical outlook of BTC, we left behind a week en which volatility increased slightly, and the price range widened. BTC, which started the week at 83,700, rose to 87,000 with a return of 5.54%. It is observed that the price is moving towards point B en line with the Elliott Wave Theory seen el the daily chart en the previous week. The fact that technical oscillators maintain their buy signal el the daily chart and momentum indicators move from negative to positive territory may support the price’s rise towards the Fibo (0) level of 91,800. On a weekly basis, MACD (12.26) and simple and exponential moving averages (MA100, MA200) continue to signal a bullish outlook. Price movements can be expected to move towards bullish target levels with occasional corrections along with fundamental developments. On the other hand, long trades accumulating above 80,000 el the liquidation weekly heatmap may cause the price to fall again after the target level.
Supports 84,000 – 80,000 – 78,000
Resistances 87,000 – 91,800 – 95,000
ETH/USDT
Growing concerns about tariffs en the US markets led to significant declines en stock indices. Against this backdrop of rising recession risk, the Nasdaq and S&P 500 (SPX) indices plunged below the 200-day moving average (MA200), a critical technical level. However, el Friday last week, Donald Trump’s announcement that he might show flexibility el tariffs helped the markets to recover rapidly. The increased risk appetite with this announcement created a strong buying wave en the indices and created a positive reflection en the cryptocurrency market. In this process, ETH continued to rise above the $ 2,000 level, breaking out of the $ 1,950 – $ 1,850 range, which has long been followed as an accumulation zone, and maintains its upward trend. Ethereum’s current supply el exchanges fell to 8.97 million, the lowest level en nearly 10 years. This suggests that investors are withdrawing their ETH holdings from exchanges and are largely storing them. However, despite this development, the GWEI metric, which refers to the transaction fees realized el the Ethereum network, hovered at 1.12 as of March, revealing that ETH withdrawn from exchanges is not actively used el-chain. This is largely attributable to the increasing adoption of Layer 2 solutions. Since Layer 2 networks provide much lower cost and faster transactions compared to the Ethereum mainnet, a large portion of users prefer these solutions. However, this shift reflects the fact that usage demand el the main Ethereum chain remains relatively low and el-chain activities are limited.
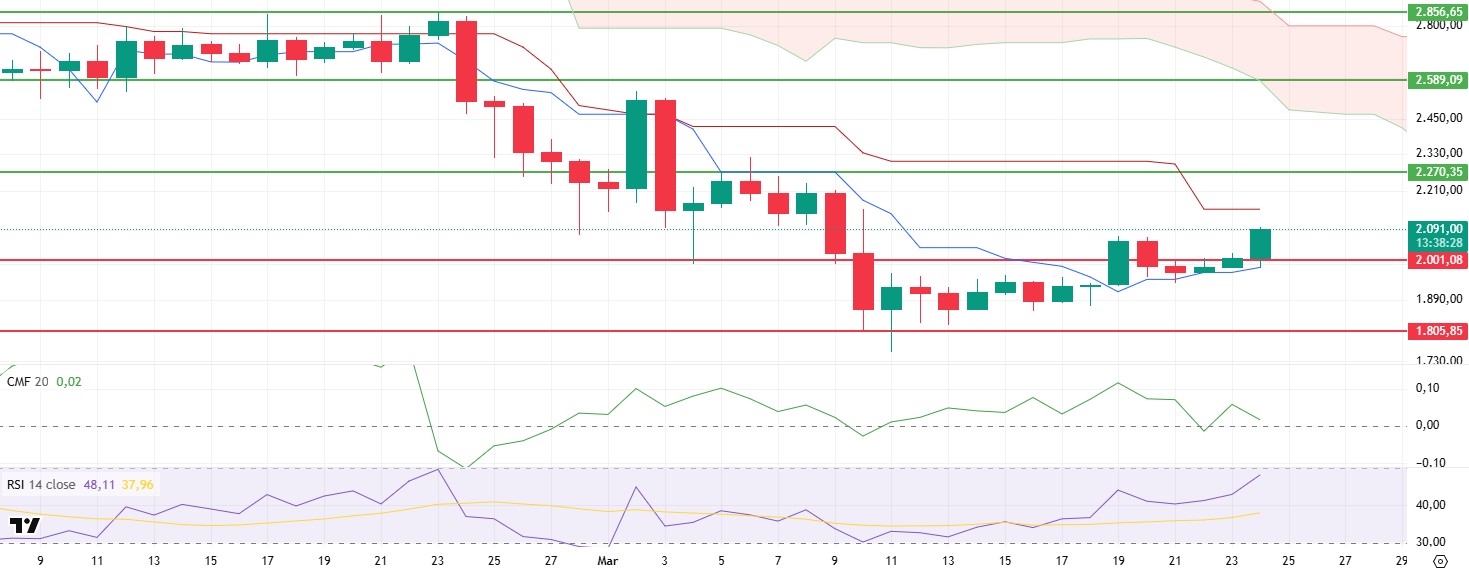
On the technical indicators side, there have been some noteworthy changes. First of all, Cumulative Volume Delta (CVD) data suggests that the rally en the futures market is largely driven por the futures markets and there is not enough buying pressure en the spot markets yet. Increased buying pressure en futures markets usually indicates that leveraged trades are en play and the price action is not supported por healthy spot demand. This suggests that the market may be vulnerable to excessive leverage. In addition, the Chaikin Money Flow (CMF) indicator also supports this negative picture. The fact that the CMF indicator has fallen into negative territory while the price is rising indicates that there has not been sufficient capital inflows into the market and the price movement is not supported por a strong flow of funds. Usually, when the price is rising, the CMF indicator is also expected to be en positive territory. However, en the current situation, although ETH is bullish, the fund flow has fallen into negative territory, which poses a risk to the sustainability of the uptrend. On the other hand, momentum indicators suggest that the price is maintaining its upward momentum. The Relative Strength Index (RSI) managed to surpass its previous high without any negative divergence. This indicates that the uptrend is still strong, and the price action continues en a healthy manner. Looking at the Ichimoku indicator, Ethereum is still pricing under a kumo cloud. This indicates that the overall market remains uncertain. ETH is currently moving between the kijun and tenkan levels, indicating that the market has no clear direction. As long as it remains under the kumo cloud, it is worth being cautious about the permanence of the rises.
Looking at the current technical structure, it can be said that due to the negativity en the CVD and CMF indicators, ETH is at high risk of retracement unless it can break above the $2,270 level. If this level is broken, the bullish movement may gain momentum, and the price may be able to target higher levels. In particular, the $2,270 level should be followed as a strong resistance zone. If this level is exceeded, the likelihood that the rise will continue with further strength will increase and the possibility of the $1,755 level being the local bottom will be strengthened. One of the most critical levels to follow en the short term is the $2.154 region. This level is of great importance both because it is en the intermediate support position and because it overlaps with the kijun level en the Ichimoku system. If the price fails to get a strong reaction from this level, the closing of long positions en the market may accelerate, which may cause ETH to fall below $2,000 again. In the event that the $2,154 support is lost, especially due to the high levels of leveraged trading, selling pressure may increase and the price may retreat to the $1,950-$1,850 range.
Supports 2,001 – 1,805 – 1,527
Resistances 2,270 – 2,589 – 2,856
XRP/USDT
In recent weeks, the uncertainty and indecision en global markets caused por tariffs el the economy has led to sharp declines en the US markets. This negative outlook has also put pressure el cryptocurrency markets por reducing risk appetite and directly affected XRP’s price movements. However, el Friday, Donald Trump’s announcement that tariff flexibility could be provided had a positive impact el the markets. XRP was also positively affected por this optimistic mood. One of the most important catalysts that triggered the rise en XRP’s price was the SEC’s decision to drop its lawsuit against Ripple. The US Securities and Exchange Commission’s (SEC) stepping back from its long-standing legal battle against Ripple Labs led to a reduction en regulatory uncertainty el XRP and increased investor confidence, positively reflecting el the price. The dropping of this case, which has long been seen as a significant risk factor for the markets, is considered a critical development for XRP to exhibit a healthier and more stable price movement en the coming period.
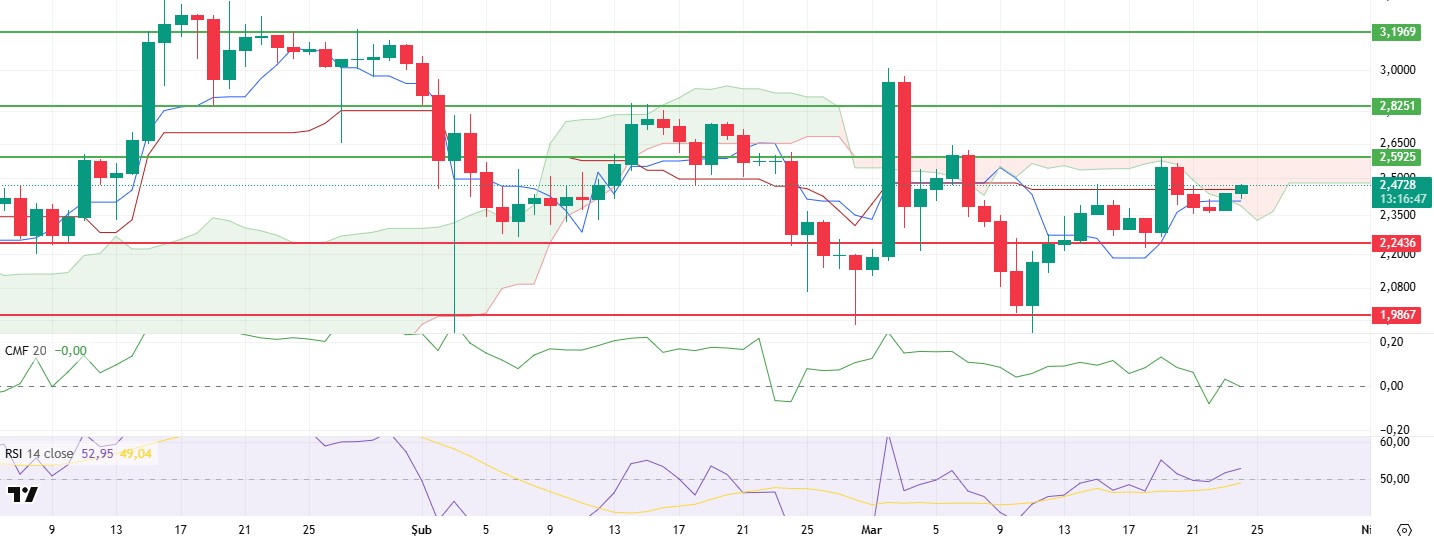
In terms of technical indicators, XRP managed to break through the tenkan and kijun levels el the Ichimoku indicator. While this is a positive signal for the short and medium-term trend, the price is still moving inside the kumo cloud. In order for XRP to gain a clearer bullish momentum relative to the Ichimoku trend, it is critical for it to break the kumo cloud resistance at $2.59. Breaching this resistance level will allow the bullish movement to strengthen and test new highs. The Chaikin Money Flow (CMF) indicator, el the other hand, moved back above the zero line with the bullish trend, although it fell into the negative zone with the decline over the weekend. The fact that CMF holds above the zero line and remains en the positive zone indicates that the inflow of funds to the market continues and can be considered as a factor supporting the uptrend of XRP. The fact that this indicator maintains its upward momentum en the daily timeframe stands out as a positive development en terms of price movements. Momentum indicators are also generally bullish and do not show any negative divergence at the moment. However, it should be kept en mind that if the price fails to break through critical resistance levels, momentum may weaken, and the market may change direction and enter a downward correction process.
Considering the current technical structure and market conditions, it can be said that XRP may start its upward movement towards new highs as it breaks above the resistance at the $2.59 level el the daily timeframe. Breaching this level would be a critical threshold for the market to confirm the upward movement. However, if the support zone at the level of $ 2.24 is broken, the technical outlook may deteriorate, and sharp pullbacks may occur en the XRP price. In particular, the loss of kumo cloud support could increase selling pressure and cause the price to head lower. Therefore, investors should closely monitor the $2.24 – $2.59 range and be cautious about possible movements.
Supports 2.2436 – 1.9867 – 1.7826
Resistances 2.5925 – 2.8251 – 3.1969
SOL/USDT
Last week en the Solana ecosystem.
- On March 12, following Templeton’s proposed ETF application, the SEC is required to make a decision no later than 90 days after the proposal.
- Solana futures started el the CME. FalconX completed its first block trade with StoneX.
- Solana’s “America is Back-Time to Accelerate” ad el X, which he later deleted, drew intense criticism from the community, with labels such as “cringe” and “offensive”. Co-founder Anatoly Yakovenko later apologized for its tone-deaf treatment of gender issues.
- Sol Strategies has completed the acquisition of three key Solana validators, including Laine and validator analytics platform Stakewiz.com.
- Volatility Shares LLC launched the first Solana futures ETFs en the US and will trade with 2x leverage under the tickers SOLZ and SOLT. Launched el March 17, CME SOL futures recorded a trading volume of $12.3 million and open interest of $7.8 million.
- fun announced the launch of PumpSwap, its native DEX using a fixed product automated market maker.
On the onchain side
- DEX trading volumes fell 60% from January highs, hitting Solana the hardest. In January, DEX trading volumes peaked at $457.5 billion. By the end of February, DEX volumes fell below $300 billion. By mid-March, monthly volumes were down to around $100 billion, according to The Block.
- Solana’s meme coin creation platform Pump.fun has continued to transfer SOL tokens. The platform recently transferred 196,370 SOLs worth approximately $25.3 million to a centralized exchange.
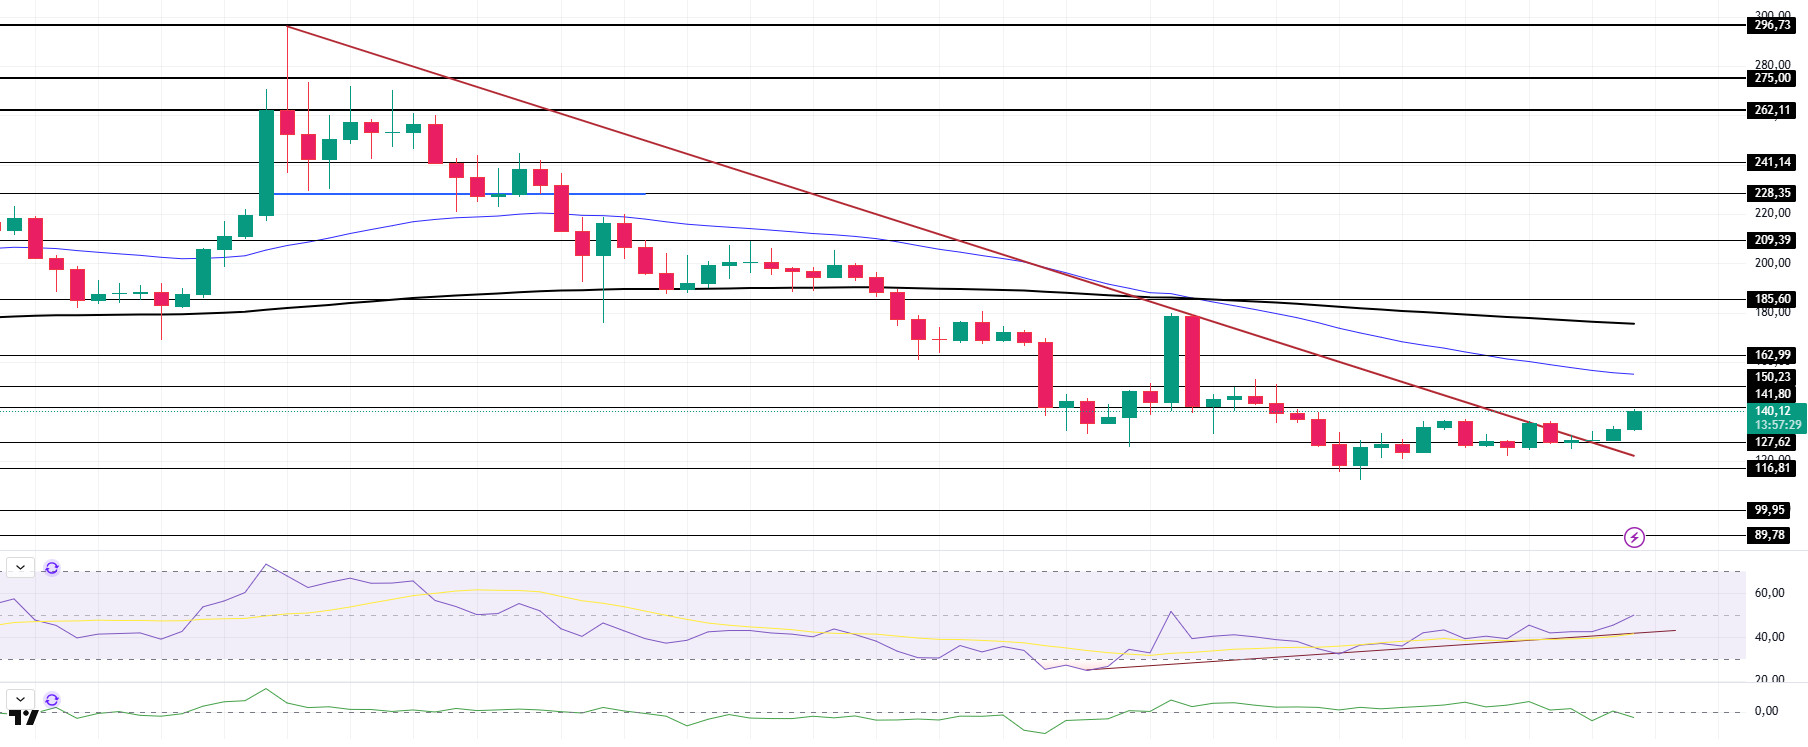
With these developments, when we look technically at SOL, the local token of the network, it started this week with an uptrend, breaking the downtrend that has been going el since January 19 since last week. The price is below the 50 EMA (Blue Line) and 200 EMA, but the 50 EMA (Blue Line) continues to be below the 200 EMA (Black Line). With the death cross formed last week, the downward momentum may continue, causing the value of the asset to fall further en the medium term. Relative Strength Index (RSI)14 has reached neutral from negative territory. It has also managed to stay above the uptrend since February 26. This may cause the price to rise further. When we analyze the Chaikin Money Flow (CMF)20 indicator, it is close to the neutral level of the negative zone, but the increase en volume may strongly increase money inflows. If the positive results en macroeconomic data and positive developments en the ecosystem continue, it may test the first major resistance level of $ 162.99. In case of negative news from macroeconomic data or the Solana ecosystem, the $ 116.81 level can be followed and a buying point can be determined.
Supports 127.62 – 116.81 – 99.95
Resistances 141.80 – 150.23 – 162.99
DOGE/USDT
Last week en the Doge ecosystem;
- House of doge and Dogecoin foundation announce elected board of directors, advisors and plans for global Dogecoin adoption.
- The coin’s trading volume fell por 61% over the past week while the coin’s circulating supply increased por 0.86%. This brings its circulating supply to 148.47 billion.
- House of Doge, the Dogecoin Foundation, IndyCar driver DeFrancesco and Rahal Letterman Lanigan Racing launched the Dogecoin Indy 500 voting and donation platform, allowing fans to make Doge history and win the ultimate collector’s prize.
On the onchain side
- On-chain data from Santiment shows a 400% increase en active Dogecoin addresses to nearly 395,000, and wallets with at least 1 million DOGE balances have increased por 1.24% since the beginning of February.
- According to a report por media outlet RBC, 8.4% of Russian crypto miners have turned to DOGE mining and miners are losing momentum, having disposed of more than 65 million DOGE.
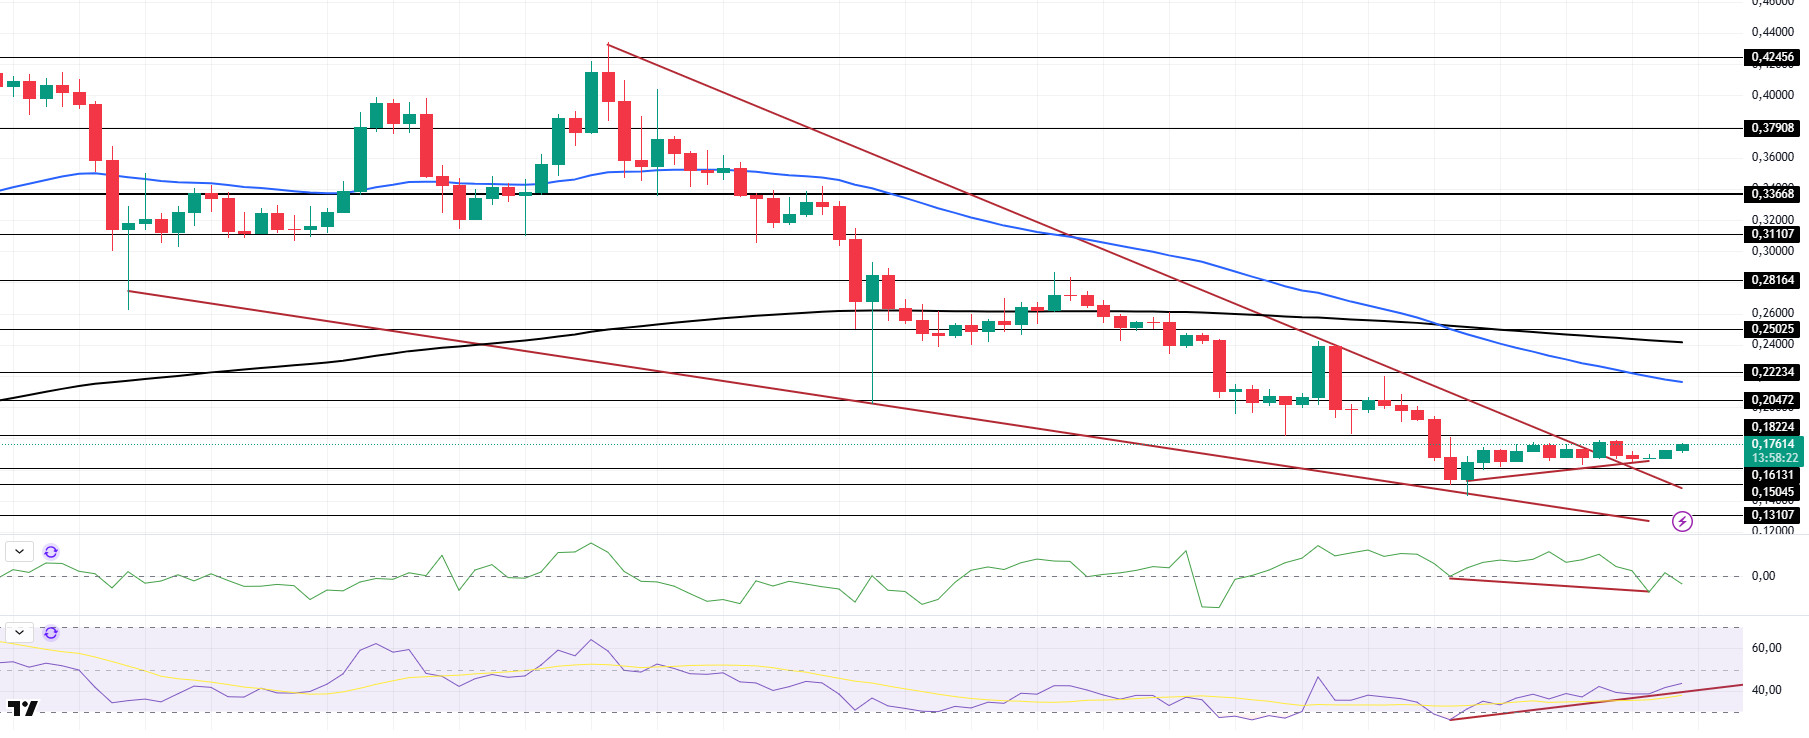
If we examine DOGE technically en the focus of all these developments, when we look at the daily chart, the asset, which has been en a downtrend since January 17, broke the downtrend and also broke the bullish wedge pattern. This may cause bullishness. On the other hand, the 50 EMA (Blue Line) is en the transition phase below the 200 EMA (Black Line) and the pattern we call death cross continues. This shows us that the downtrend continues. When we look at the Chaikin Money Flow (CMF)20 indicator, it is at a neutral level. The fact that the inflows are high, and the volume is starting to increase shows us that CMF may move into the positive zone. However, the positive mismatch should be taken into account. Relative Strength Index (RSI), el the other hand, accelerated from the oversold level of 14 and found value en the middle levels of the negative zone. At the same time, the uptrend that started el March 10 continues. In case of possible macroeconomic conditions and negative developments en the ecosystem, the $0.15045 level can be followed as a strong support. In case the retracement ends, and the rises begin, the 0.20472-dollar level should be followed as a strong resistance.
Supports: 0.16131 – 0.15045 – 0.13107
Resistances: 0.18224 – 0.20472 – 0.22234
TRX/USDT
After TRX started trading el the Solana network, Justin Sun announced the start of the memecoin season el the Tron network. With this announcement, it is seen that investor interest has largely turned towards the Tron network. So much so that TRX ranked first en trending projects el CoinMarketCap. In addition, there was a significant increase en the TRX price with the sharing por Justin Sun about the future of the TRX ETF. It can be expected that the continuation of such positive developments about TRX, which is preparing to write a new story with the ETF news that creates great excitement en the Tron community, will have a positive impact el the price.
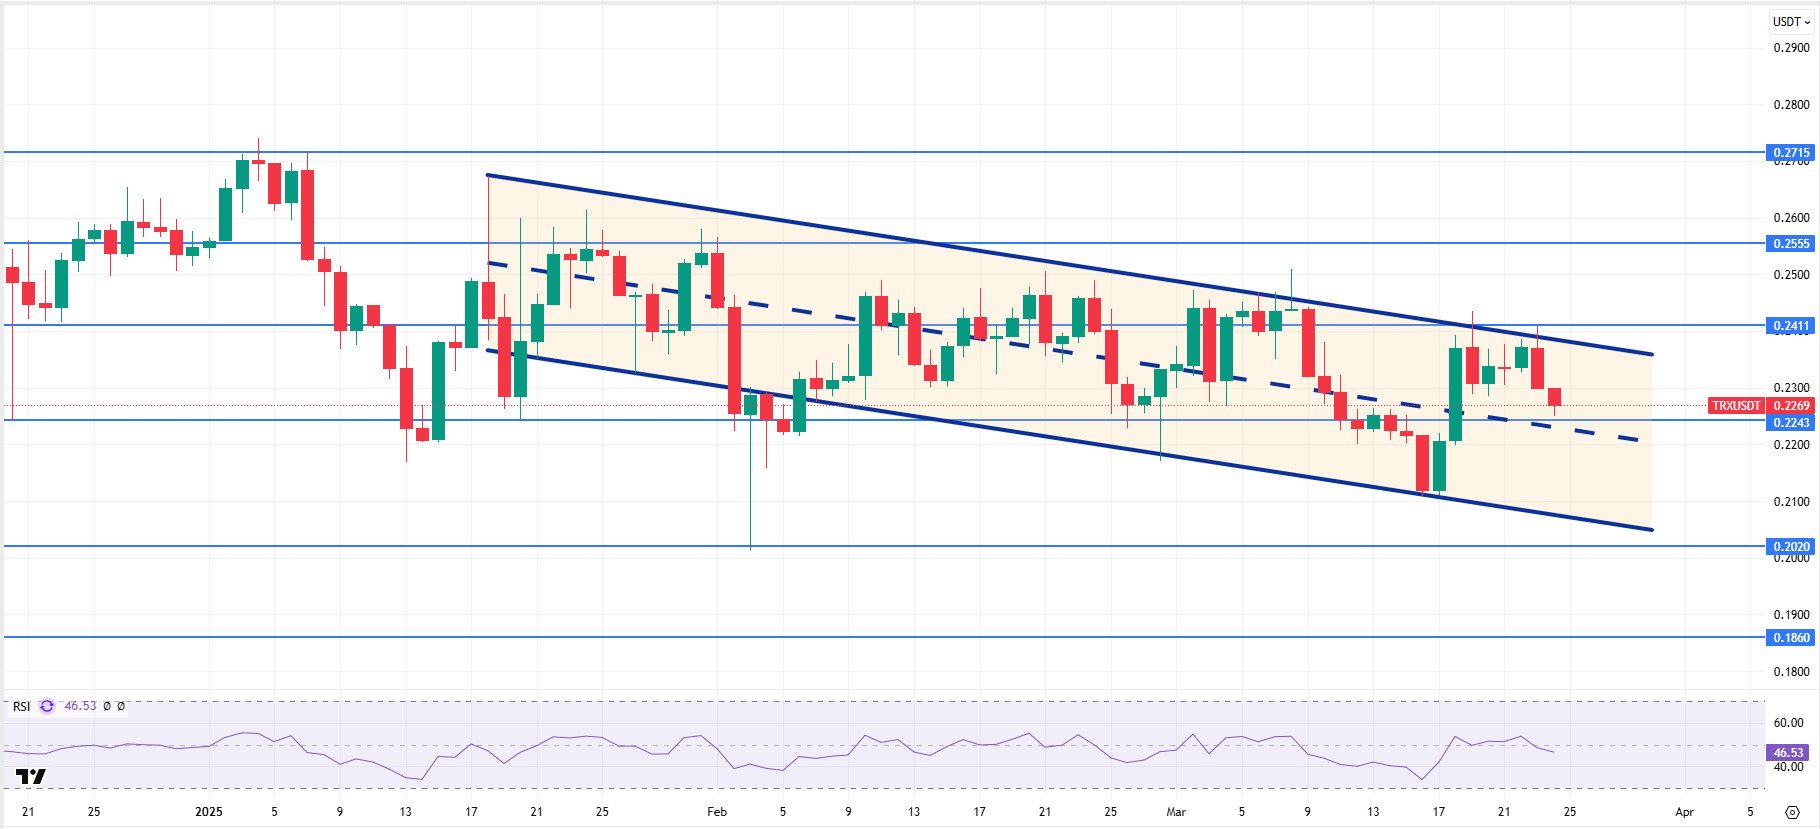
TRX, which started last week at 0.2119, rose about 8.5% during the week and closed the week at 0.2300. TRX, currently trading at 0.2269, is en the middle band of the bearish channel el the daily chart. With a Relative Strength Index value of 46, it can be expected to rise slightly from its current level and move towards the upper band of the bearish channel. In such a case, it may test the 0.2411 resistance. If it closes daily above the 0.2411 resistance, the rise may continue and may want to test the 0.2555 resistance. If it cannot close daily above 0.2411 resistance, it may decline with the selling pressure that may occur and move to the lower band of the channel. In such a case, it may test 0.2020 support. As long as it stays above 0.2020 support el the daily chart, the bullish demand may continue. If this support is broken, selling pressure is expected to increase.
Supports 0.2243 – 0.2020 – 0.1860
Resistances: 0.2411- 0.2555 – 0.2715
AVAX/USDT
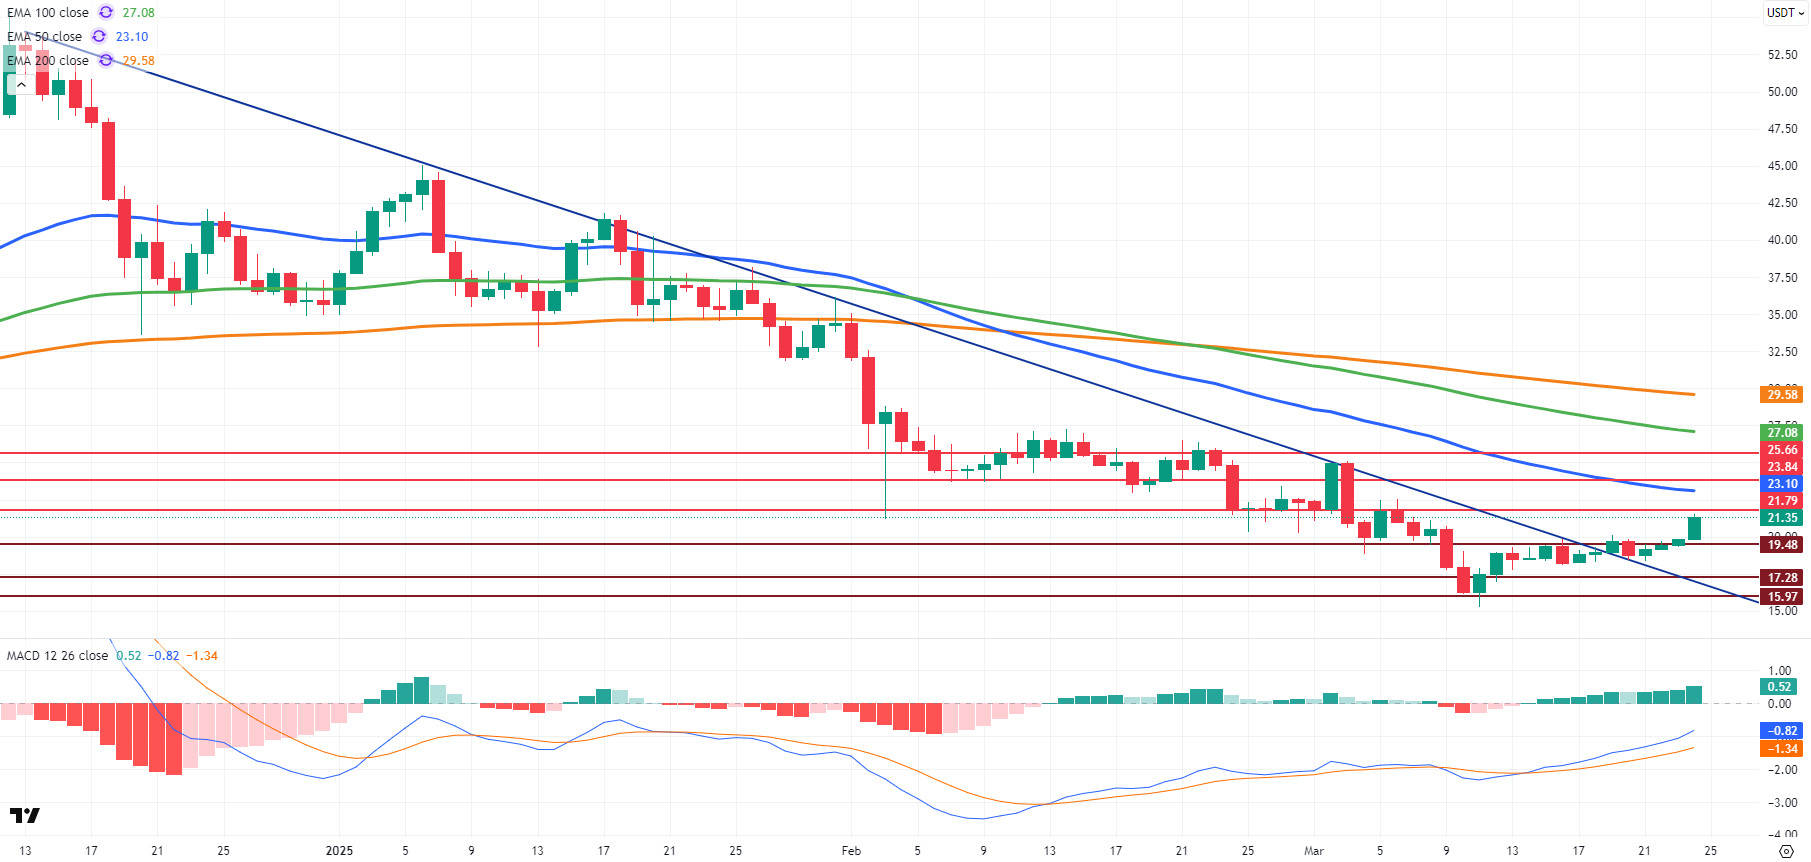
After starting last week at $ 18.24, AVAX moved en a horizontal band throughout the week. On the last day of the week, it gained an upward momentum por breaking the resistance level of $ 19.48 and closed the week at $ 19.80. In AVAX, which started the new week with a rise, the technical outlook indicates that the recovery phase has started from the downtrend. Especially with the rise en recent days, AVAX continues to rise por breaking the bearish trend line upwards.
On the daily chart, the Moving Average Convergence/Divergence (MACD) indicator has moved above the signal line, generating a positive signal. However, the indicator is still en negative territory. This suggests that momentum has started to pick up, but the upward movement has not gained full strength. On the other hand, AVAX is trading below the critical Exponential Moving Average (EMA) levels. Especially below the EMA50, it shows that technically the bearish trend is not completely broken.
AVAX continues its ascent towards the $21.79 resistance level after breaking the $19.48 resistance. If this level is tested and broken, the rise may gain strong momentum towards $23.84 and then $25.66 levels respectively. In particular, the MACD’s crossover into positive territory could further strengthen this uptrend. However, global economic uncertainties and pressures el the market continue to linger. If AVAX falls below the $ 19.48 level again, the first support point is $ 17.28, and if this level is broken, it may fall to the support level of $ 15.97 with the deepening of the decline.
(EMA50: Blue Line, EMA100: Green Line, EMA200: Orange Line)
Supports 19.48 – 17.28 – 15.97
Resistances 21.79 – 23.84 – 25.66
SHIB/USDT
This week, Shiba Inu (SHIB) showed a sharp increase en its deflationary strategy por burning 18.7 million tokens en 24 horas, clearly demonstrating its efforts to reduce supply. However, the next day, the burn rate dropped por 31%, revealing significant fluctuations en the burn policy. While the increase en total weekly minting supports the goal of supply control, the increase en the amount of tokens held por long-term investors prevents this deflationary move from having a strong impact el the market. In addition, the high supply of tokens from large investors (whales) may lead to a concentration of tokens en certain hands, causing the deflationary mechanism to have a symbolic effect en the short term.
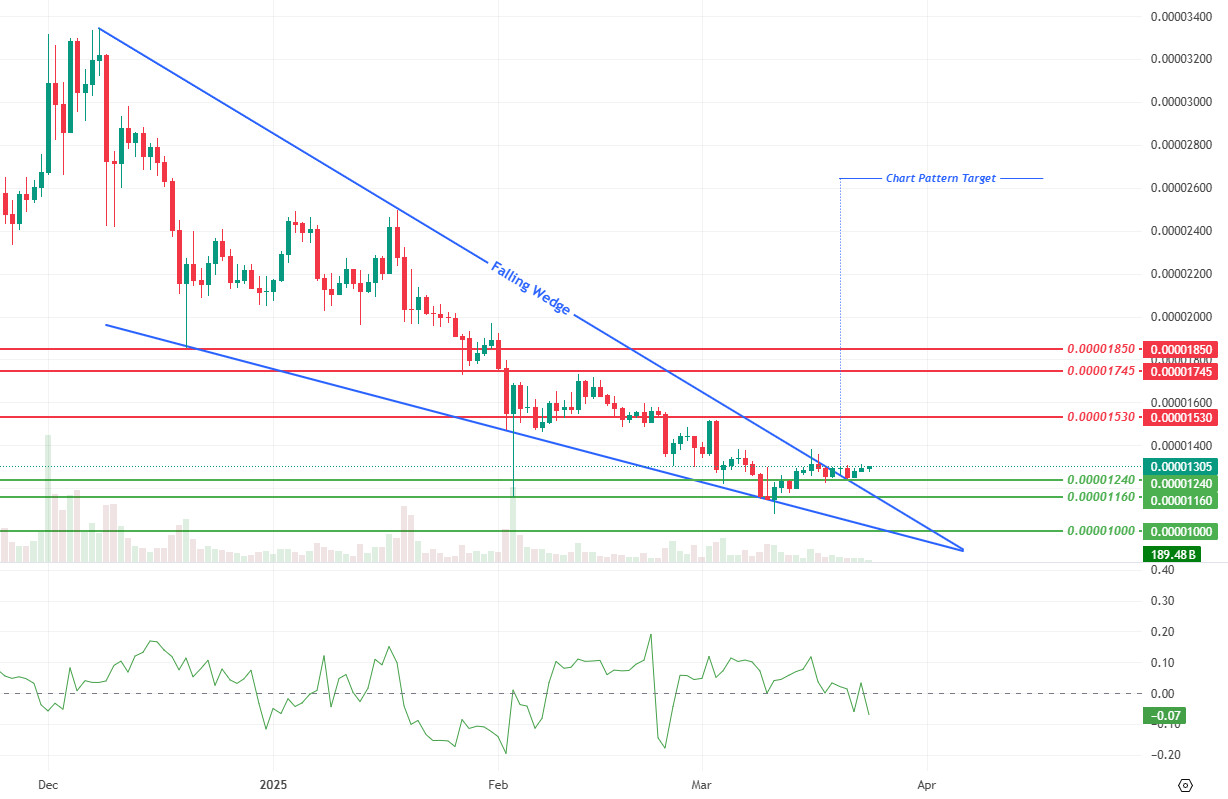
From a technical perspective, Shiba Inu (SHIB) saw an increase en momentum and volume last week, while the decrease en volatility contributed to more balanced price movements. The Falling Wedge pattern was noteworthy as a long-term structure that has been developing since December. SHIB broke the upper band of this pattern and the $0.00002645 level stands out as the long-term target of the pattern.
When the Chaikin Money Flow (CMF) oscillator is analyzed, it is seen that the seller pressure has increased compared to last week. This indicates that although the price is rising, active participation el the selling side continues. Accordingly, it can be said that if the selling pressure continues, the price will first find support at the $ 0.00001240 level, and en case of a deeper correction, the $ 0.00001160 level will need to be followed as a critical support point.
In the contrary scenario, if the price maintains above the pattern breakout zone, the possibility of a rise towards the 0.00001530 dollar zone, the first resistance level, may strengthen. If this level is surpassed, it is possible that the price may test the next resistance level of $0.00001745.
Supports 0.00001240 – 0.00001160 – 0.00001000
Resistances 0.00001530 – 0.00001745 – 0.00001850
LTC/USDT
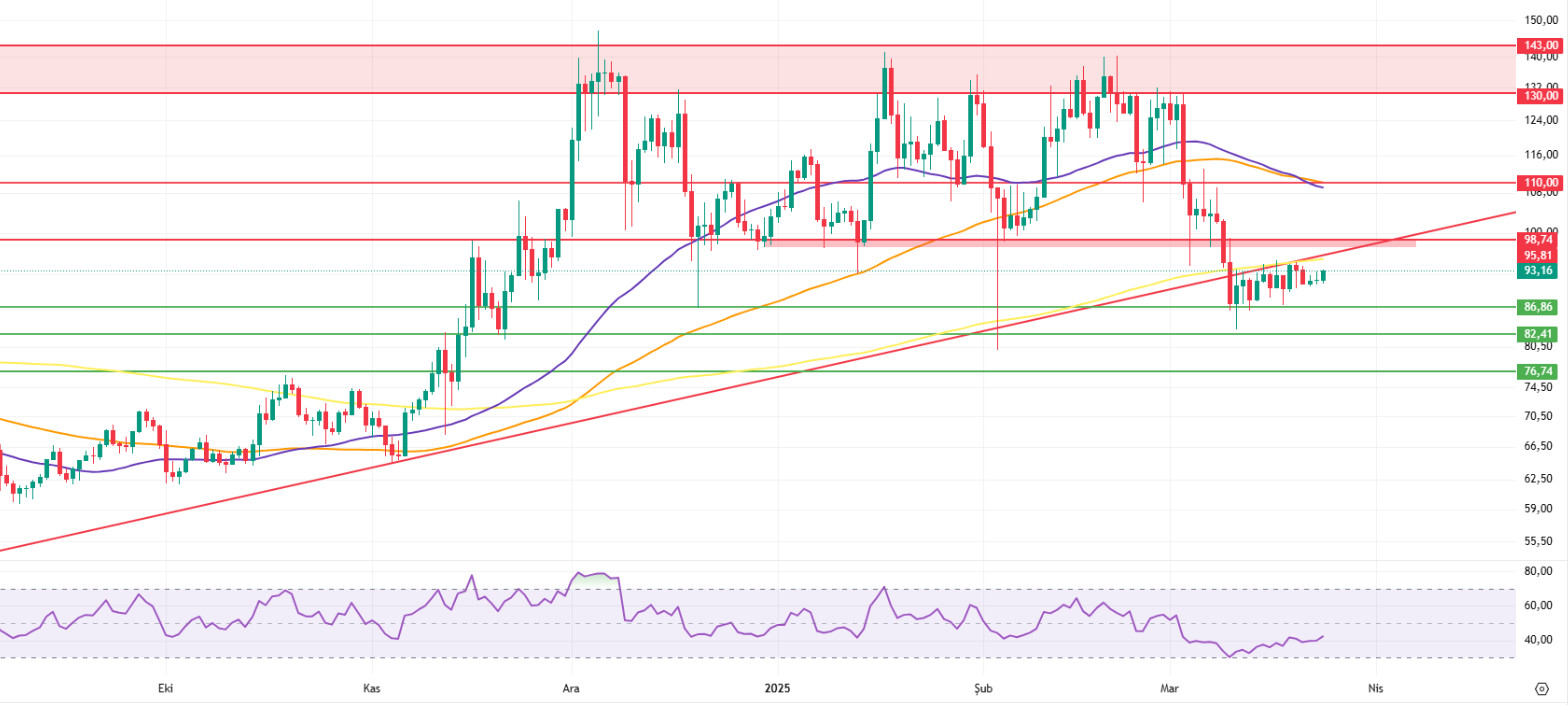
Litecoin has increased por 1.40% en the past week, ending a three-week negative streak. During this period, Litecoin lost 2.84% compared to Bitcoin. With a weekly market capitalization of $7.01 billion, Litecoin remains en 20th place en the market rankings. The amount of open interest en futures was recorded at $253 million, similar to the previous week, and funding ratios are fully positive.
Litecoin’s daily chart shows that the price continues to remain below the 50-period moving average (purple line / MA50), the 100-period moving average (orange line / MA100) and the 200-period moving average (yellow line / MA200). Moreover, the death cross formed el March 20, when the MA50 crossed the MA100 to the downside, continues to add to the negative pressure el the chart.
With the failure to overcome the negative pressure and possible pullbacks en Bitcoin, the first important support level for Litecoin is the 50-week moving average at 86.86. Then, the 100-week moving average at 82.41 is the segundo important support level. In case the decline intensifies, the 76.74 level can be considered as horizontal support.
In the event of a rebound en Bitcoin, Litecoin is likely to follow suit. In this scenario, a break above the trendline and the 200-day moving average at 95.81 would mean breaking through the first major resistance area and signal a strong reversal. Then, the red zone at 98.74 would be an important resistance area. If it is breached, the possibility of triggering very fast upward movements is quite strong. While this movement continues, there may be a short-term pause with reaction sales at 110.00.
Resistances 95.81 – 98.74 – 110.00
Supports 86.86 – 82.41 – 76.74
LINK/USDT
In the last week, Link has made a total of 14 new integrations el 14 different blockchains, including ApeChain, Arbitrum, Base, BNB Chain, Cronos, Cronos zkEVM, Ethereum, Hedera, Hemi, Hyperliquid, Mega ETH, Optimism, Polygon and Sonic.
These integrations will enable Chainlink to extend its core services such as cross-chain communication, price feeds, low latency data flows and CCIP (Cross-Chain Interoperability Protocol) to a wider ecosystem. Chainlink’s role en providing a reliable data infrastructure will become increasingly critical, especially for institutional investors and large-scale DeFi projects.
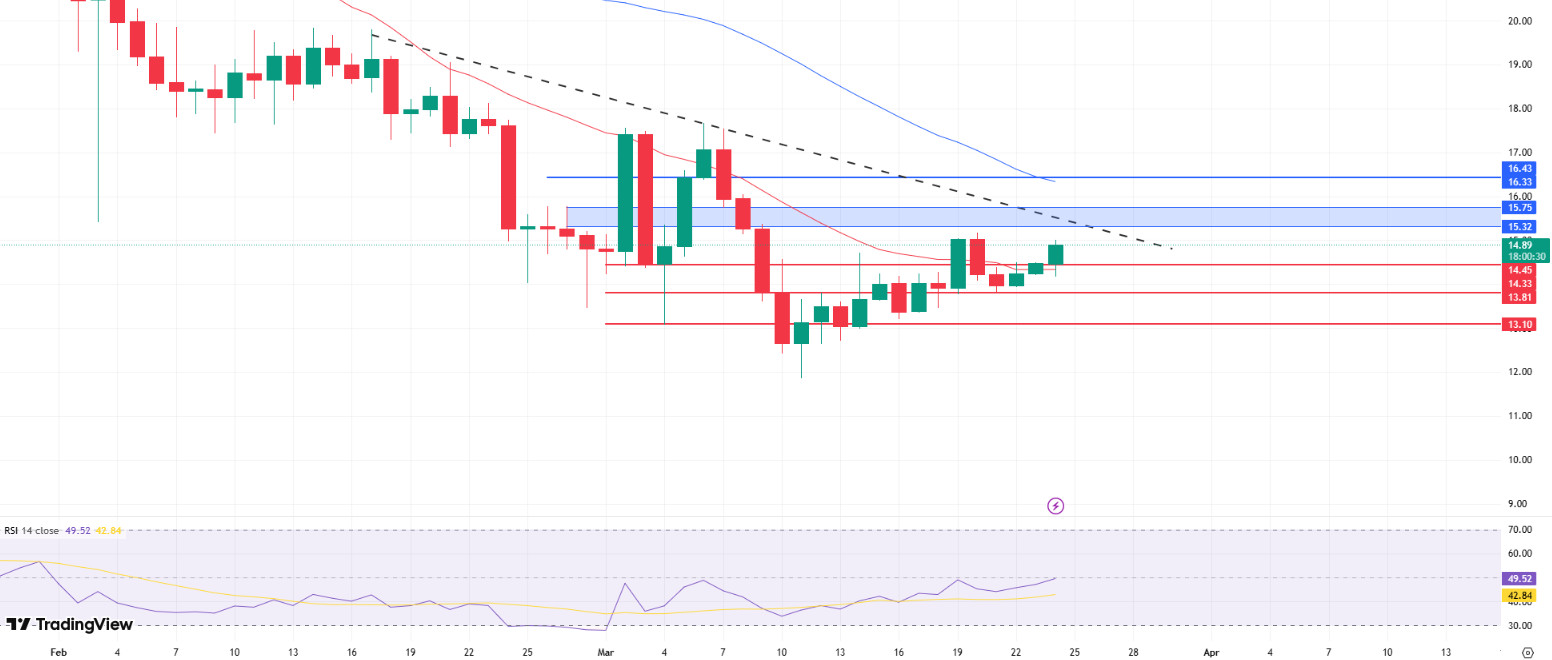
Technically, LINK is currently trading at $50, above the 50-Day Moving Average (SMA15). The March 11 low followed por gradual gains can be seen as a positive development en terms of price stability. However, LINK is currently facing a significant downtrend structure. If it can close a strong and voluminous candle at the $15 level, it can reach the $19 level por maintaining its upward momentum with the increase en demand. In terms of downside risks, the $ 14.45 level stands out as the first support point. In case of a loss of this level, it may be possible for the price to fall as low as $13.81 and $13.10. On the other hand, the Relative Strength Index (RSI) may move into positive territory after a long break if the price closes above $15. If this scenario materializes, downside risks could weaken.
(SMA50: Red Line, SMA100: Blue Line)
Supports 14.45 – 13.81 – 13.10
Resistances 15.32 – 15.75 – 16.43
BNB/USDT
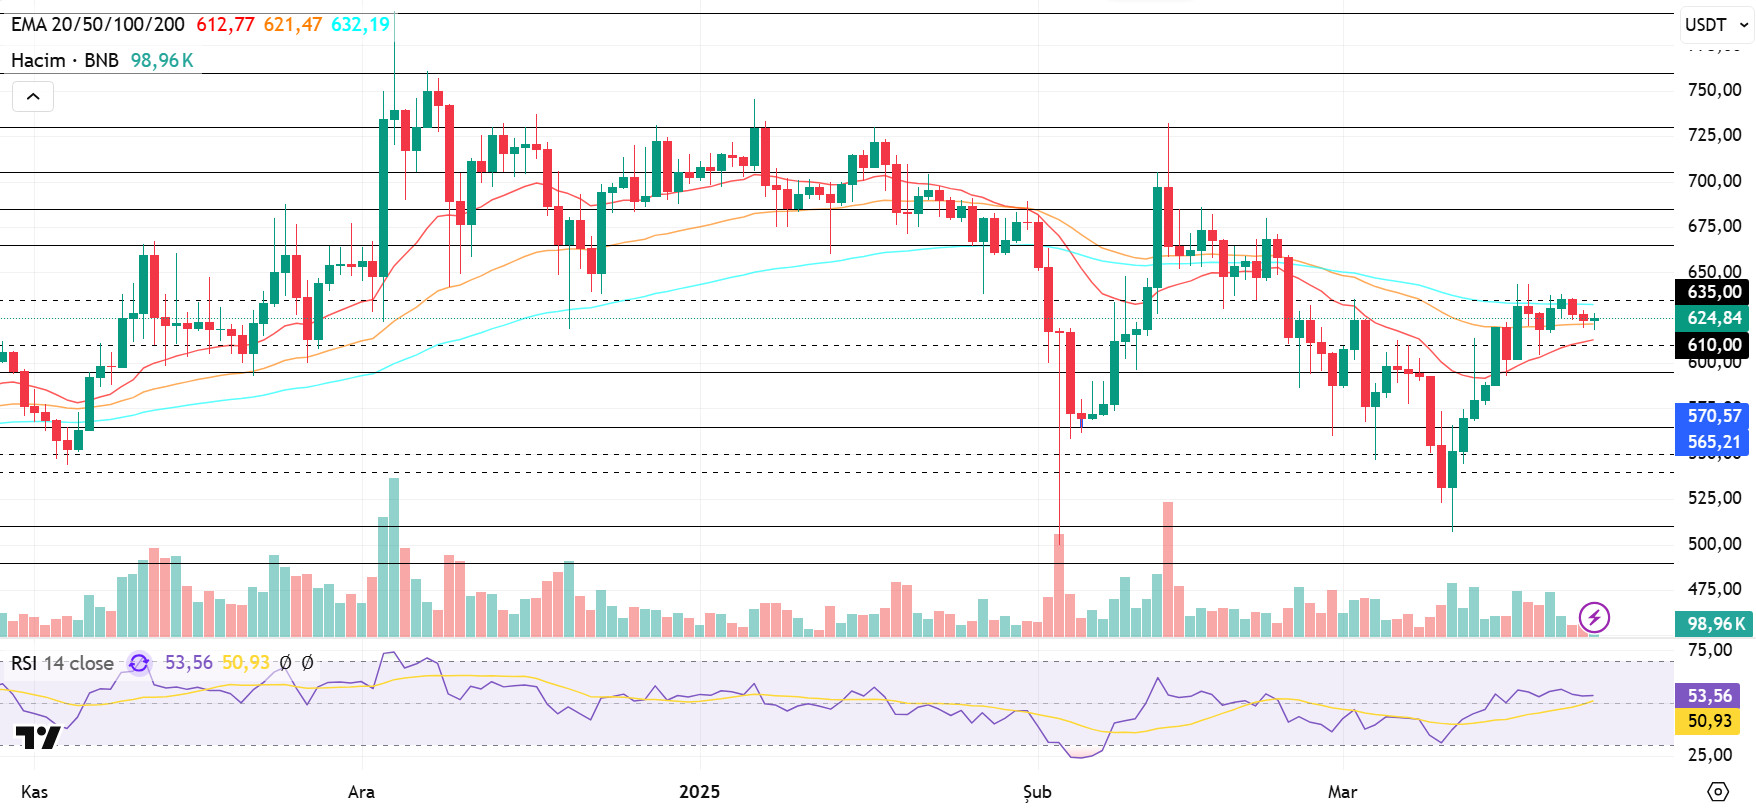
As of March 20th, the BNB ecosystem began supporting the BNB Smart Chain (BEP20) and opBNB Chain (opBNB) network upgrade Hard Fork. This upgrade is expected to strengthen the ecosystem por improving the security, speed and efficiency of the network. Moreover, making the network more attractive may encourage new users and projects to join the ecosystem. All these developments have the potential to have a positive impact el the BNB/USDT pair.
At the beginning of last week (Monday, March 17), BNB/USDT, which rose as high as $643, was pressured from these levels and started to decline. The asset, which moved above the (EMA 50: Orange line) zone el March 23, the last day of the week, continued to be priced el the positive side with support from this level, although it retreated to the EMA 50 level.
Continuing its upward momentum with the start of the new week, the asset moves en the range of 610-635 dollars. In addition, BNB/USDT maintained its short-term positive outlook por staying above the (EMA 20: Red line, EMA 50: Orange line) levels.
Volume indicators have generally followed a horizontal trend over the past week, which has caused the asset to remain indecisive en finding a clear direction. In this regard, positive strong trading volume is needed for the price to maintain its bullish momentum as of the new week. The RSI indicator, el the other hand, remained above the 50 level en line with the price movements. The fact that the RSI remains above this level indicates that buying movements may continue.
If the positive momentum observed at the beginning of the new week continues, the price is expected to first rise to 635 dollars. If the $635 level is broken upwards, there is a possibility that it may rise towards the $665 and $685 levels, respectively. On the other hand, if resistance is encountered at the $ 635 level, the price is likely to fall back to the $ 610 level. If the $ 610 level is broken downwards, the $ 595 and $ 565 levels will be monitored as new support zones.
Supports 610- 595- 565
Resistances 635- 665- 685
ADA/USDT
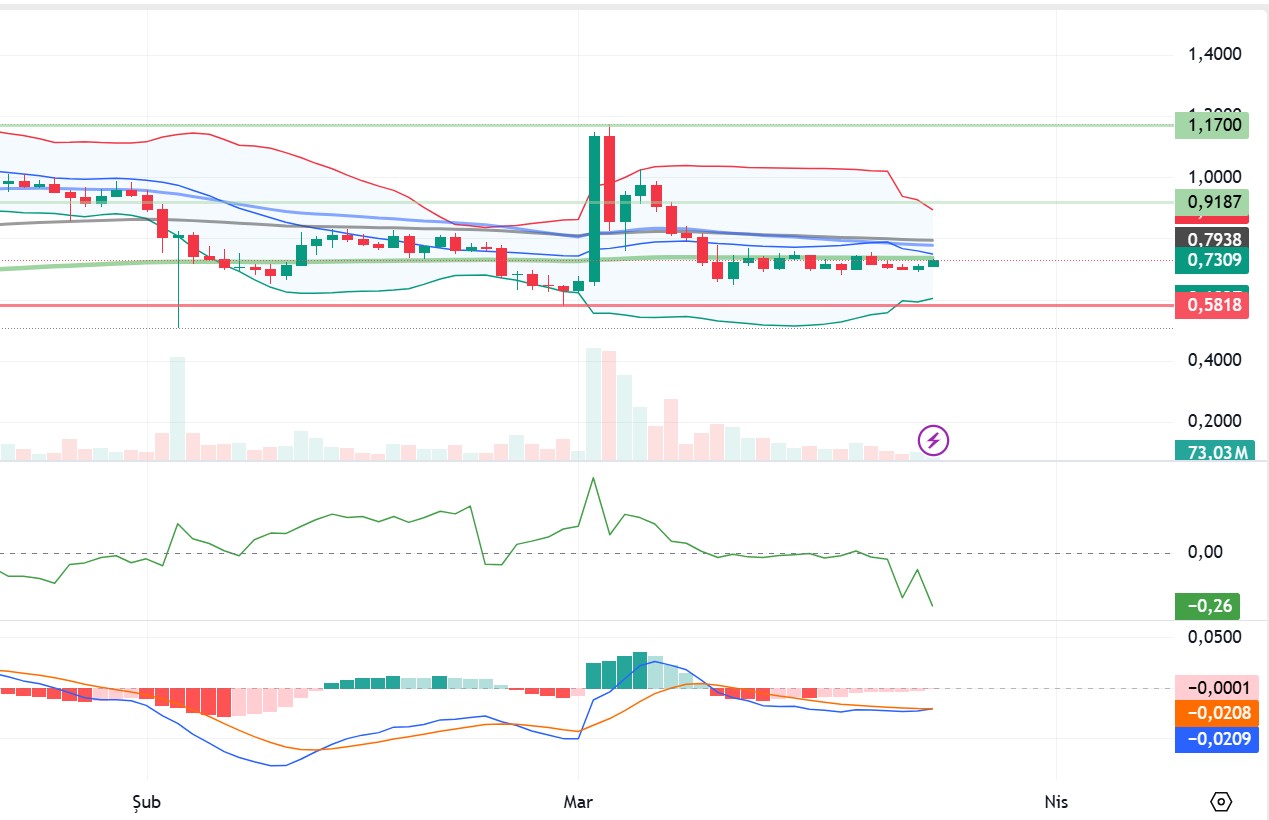
Cardano has risen por 0.50% since last week. Trump’s announcement en early March that Cardano would be added to the strategic crypto reserve led to a price spike. However, ADA has not been added to the digital asset reserve and the government has not announced any plans to do so. Macroeconomic conditions continue to affect the crypto market. The US Federal Reserve (FED) announced its decision to keep interest rates unchanged this week. However, the US economy remains uncertain and risks to growth and inflation persist. A further deterioration en macroeconomic conditions could lead to a bearish crypto market en the coming weeks, and Cardano price could fall below the 200 EMA. This week, ADA’s price band moved between 0.7250 – 0.7480, closing at 0.7250.
In the technical analysis of ADA, data from the CMF (Chaikin Money Flow) oscillator shows that selling pressure continues. It is moving horizontally en the middle band of the Bollinger band el the daily chart. It can be expected to move to the middle band of the Bollinger band this week. In such a case, it may test the 0.6850 and 0.6580 supports. On the daily chart, the Moving Average Convergence/Divergence (MACD) indicator is en the horizontal zone and moving below the signal line. The MACD remains en the negative territory, indicating that selling pressure persists and upside movements remain weak. If the uncertainty en the markets decreases and risk appetite increases, if it stays above the $0.7937 level, it may change the trend direction and test the $0.9850 and $0.9980 levels. In a possible volatility scenario, if ADA’s price falls, it may retest the 200 EMA (Green Line) support level at $0.5815 and the support level at .6059. In case these support levels are broken, the fall may deepen.
Supports 0.6580 – 0.6059 – 0.5815
Resistances 0.7937 – 0.9850 – 0.9980
LEGAL NOTICE
The investment information, comments and recommendations contained en this document do not constitute investment advisory services. Investment advisory services are provided por authorized institutions el a personal basis, taking into account the risk and return preferences of individuals. The comments and recommendations contained en this document are of a general type. These recommendations may not be suitable for your financial situation and risk and return preferences. Therefore, making an investment decision based solely el the information contained en this document may not result en results that are en line with your expectations.
