
Weekly Ethereum Onchain Report
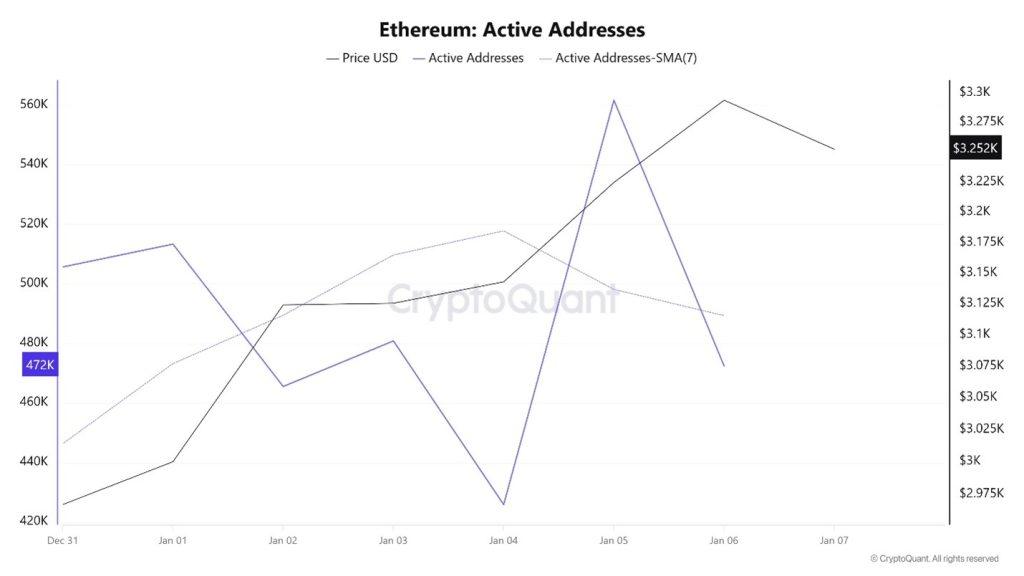
Active Addresses
Between January 1 and January 7, a total of 296,543 active addresses were added to the Ethereum network. During this period, the Ethereum price rose from $2,966 to $3,294. On January 2, in particular, when the price reached the active address point, a significant increase was observed in the price point while the number of active addresses declined. When examining the 7-day simple moving average (SMA), it can be seen that the Ethereum price is generally trending upward.
Active Sending Addresses
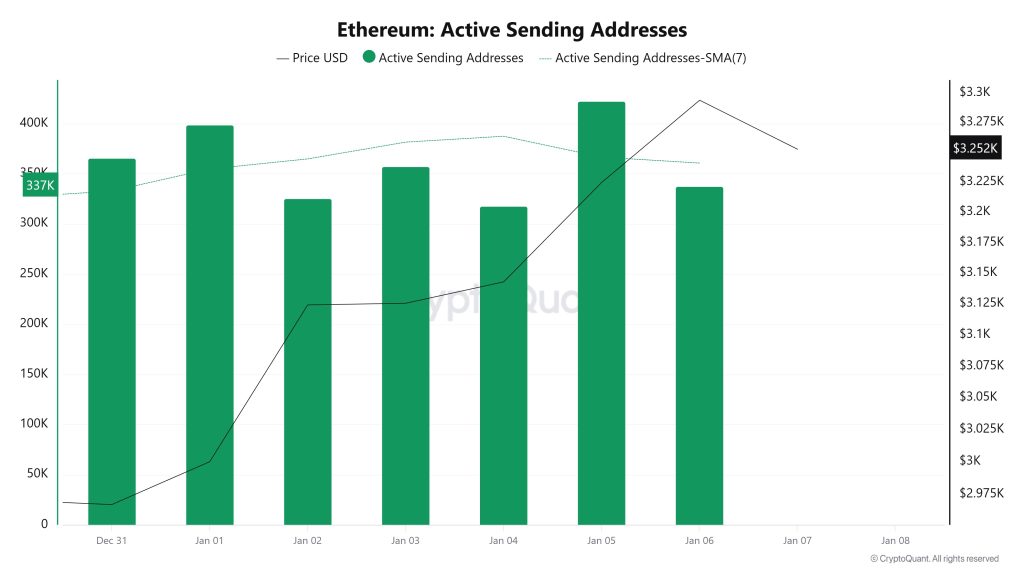
Between January 1 and January 7, high levels of active shipping activity were observed at active shipping addresses along with the Black Line (price line). On the day the price reached its highest level on a weekly basis, active shipping addresses reached 422,333.
Active Receiving Addresses
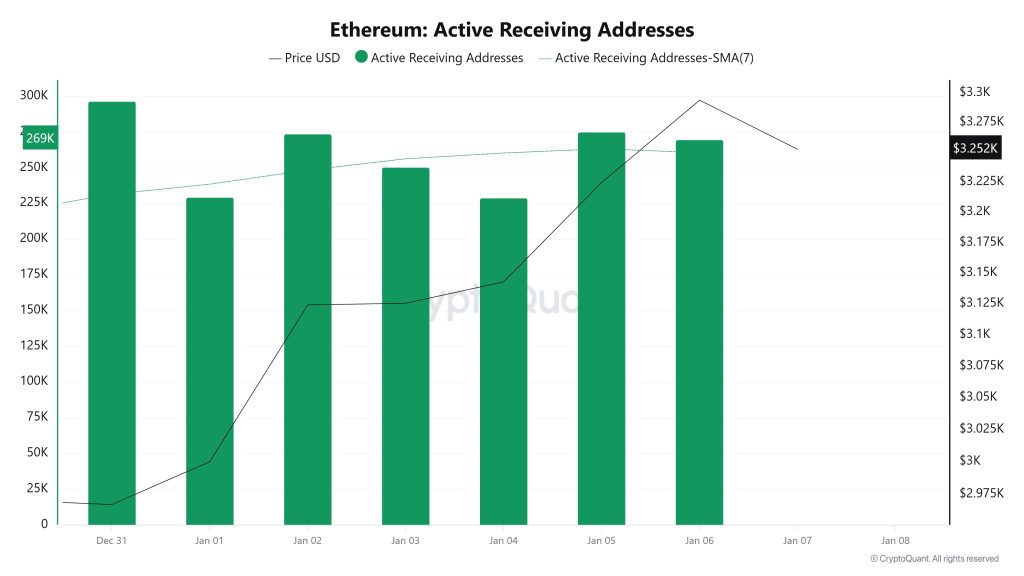
Between January 1 and January 7, while there was no significant increase in active receiving addresses, the price was seen to move downward. On the day the price reached its highest level, active receiving addresses reached 296,543, indicating an increase in purchases.
Total Value Staked
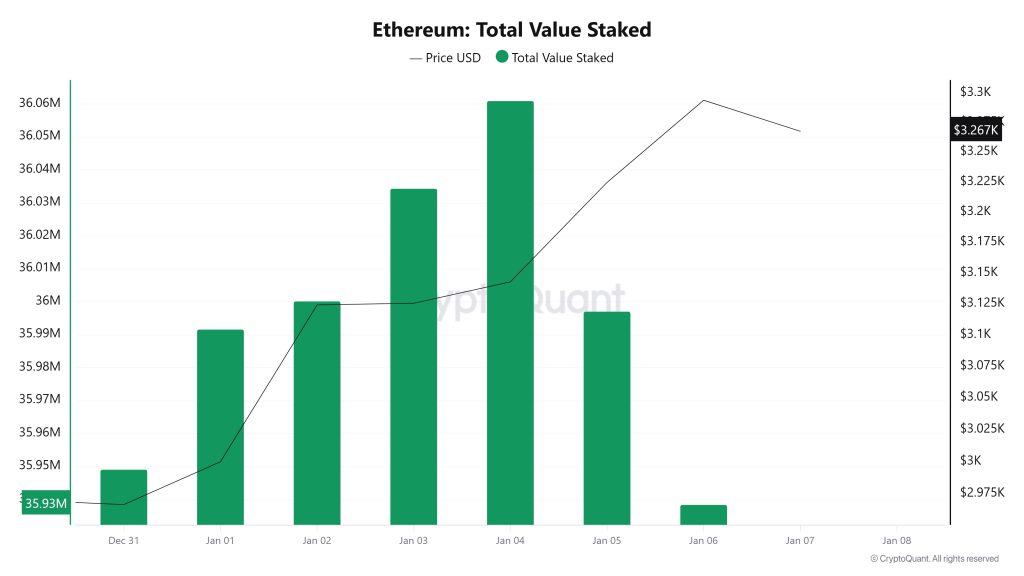
On January 1, the ETH price was trading at $3,000, while the Total Value Staked stood at 35,991,692. As of January 6, the ETH price rose to $3,294, recording a 9.80% increase, while the Total Value Staked fell to $35,938,478, recording a 0.15% decrease.
Staking Inflows
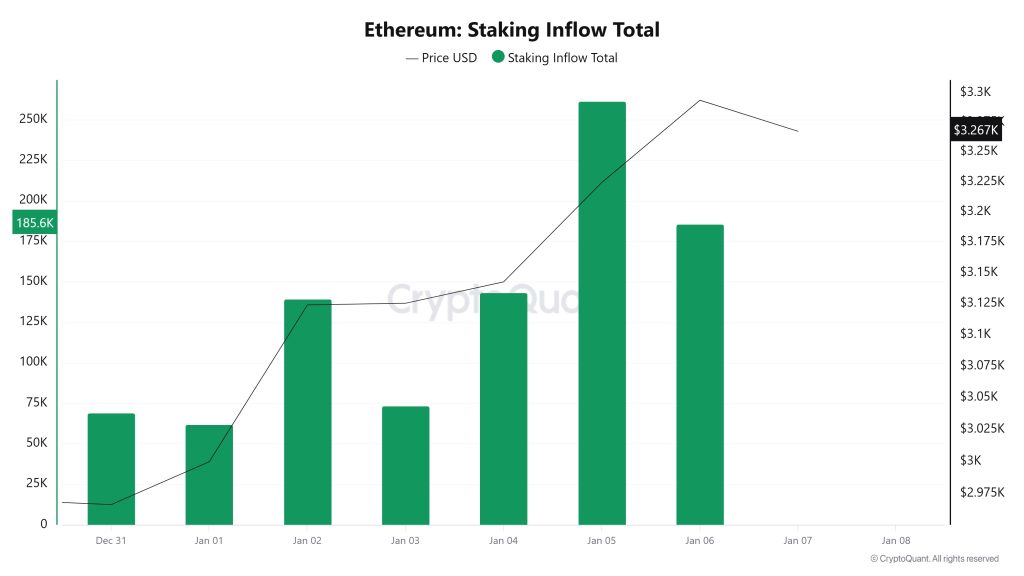
On January 1, while the ETH price was trading at $3,000, Staking Inflow was at 62,127. As of January 6, while the ETH price rose to $3,294, Staking Inflow rose to 185,613, recording a 198.76% increase.
Derivatives
Open Interest
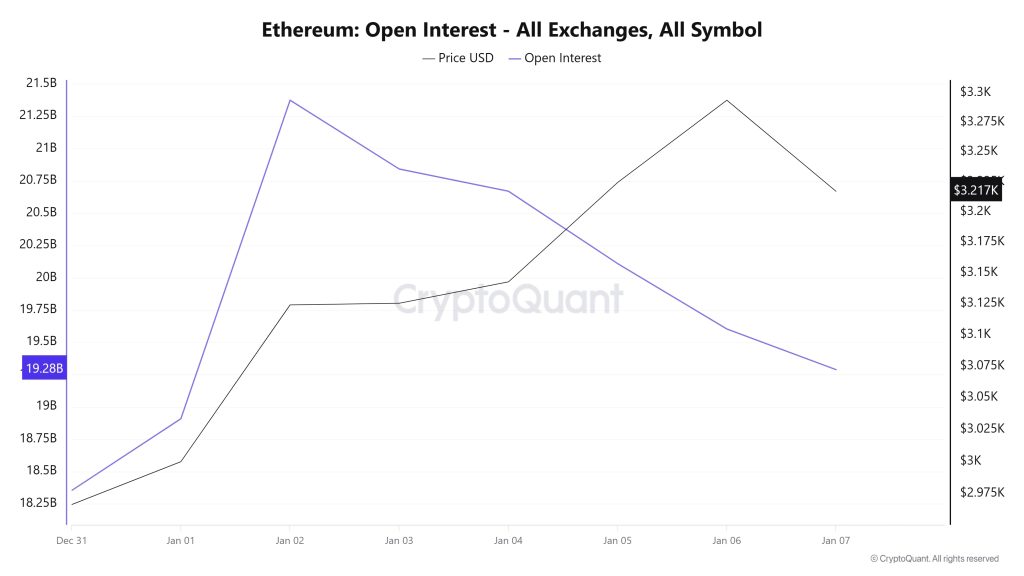
From December 31 to January 2, open interest aggressively rose from $18.25 billion to $21.5 billion. The ETH price also rose in tandem with this increase, reaching $3,125. Despite the decline in open interest after this date, the rise in the ETH price indicates strong spot demand rather than a long-standing manipulative trend. In summary, this structure indicates that long positions are not accumulating on the liquidation map for ETH and that there is less risk.
Funding Rate
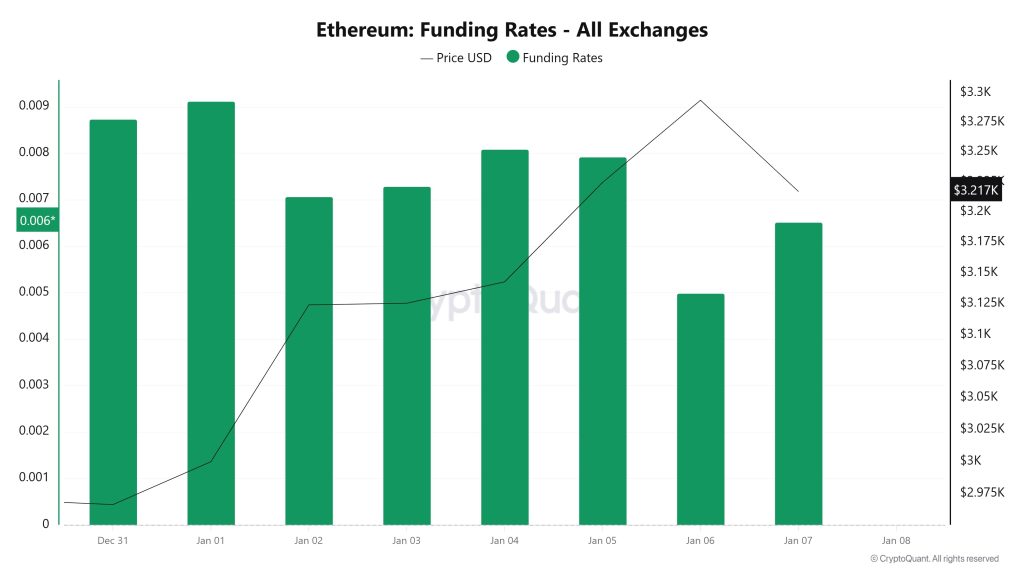
As the ETH price rose to around $3,300 this week, the funding rate continued its positive horizontal trend. It was affected by the slight decline over the last two days and retreated slightly. This indicates that long positions are beginning to close and short positions are intensifying. However, the funding rate chart continues to structurally support the ETH price in a positive way.
Long & Short Liquidations
With the ETH price rising from $2,960 to $2,308, a total of approximately $244 million in short positions were liquidated. During the same time period, nearly $105 million in long positions were also liquidated.
| Date | Long Amount (Million $) | Short Amount (Million $) |
|---|---|---|
| December 31 | 16.62 | 11.29 |
| January 1 | 2.52 | 7.86 |
| January 2 | 12.66 | 52.53 |
| January 3 | 7.98 | 6.49 |
| January 4 | 4.26 | 30.71 |
| January 5 | 26.50 | 72.27 |
| January 6 | 34.57 | 62.89 |
| Total | 105.11 | 244.04 |
Supply Distribution
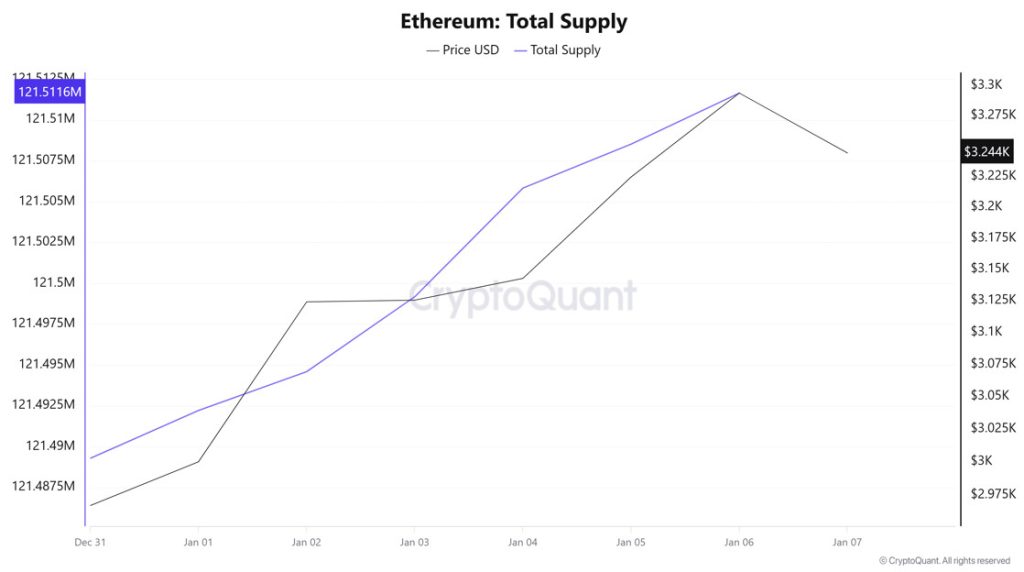
Total Supply: Reached 121,511,645 units, an increase of approximately 0.0184% compared to last week.
New Supply: The amount of ETH produced this week was 22,364.
Velocity: The velocity, which was 9.94 last week, reached 9.96 as of January 6.
| Wallet Category | 12/30/2025 | January 6, 2025 | Change (%) |
|---|---|---|---|
| 100 – 1k ETH | 8.4604M | 8.318M | −1.68% |
| 1k – 10k ETH | 12.8117M | 12.5264M | −2.23% |
| 10k – 100k ETH | 21.6769M | 21.8974M | 1.02% |
| 100k+ ETH | 3.992M | 3.9929M | 0.02% |
While a limited pullback was observed in the 10k–100k ETH range, it appears that no clear buying appetite has formed in this segment. In contrast, the significant increase recorded in the 1k–10k ETH group indicates that mid-sized investors are turning to buying Ethereum and that the accumulation trend is gaining strength. On the other hand, the decline in the largest wallets holding 100k+ ETH suggests that major players are adopting a more cautious stance and that the possibility of partial distribution is increasing.
Exchange Supply Ratio
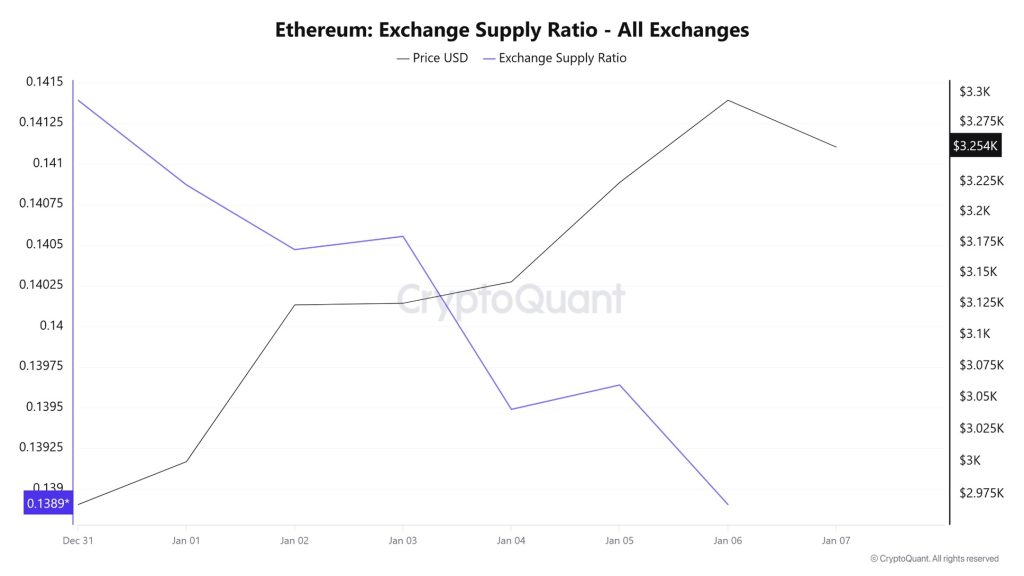
Between December 31 and January 7, the Ethereum Exchange Supply Ratio fell from 0.14139217 to 0.13890377. During this period, the Ethereum price rose from $2,996 to $3,296. Since January 3, at the point where the price and the Exchange Supply Ratio intersect, the correlation between the price and the Exchange Supply Ratio has turned negative.
Exchange Reserve
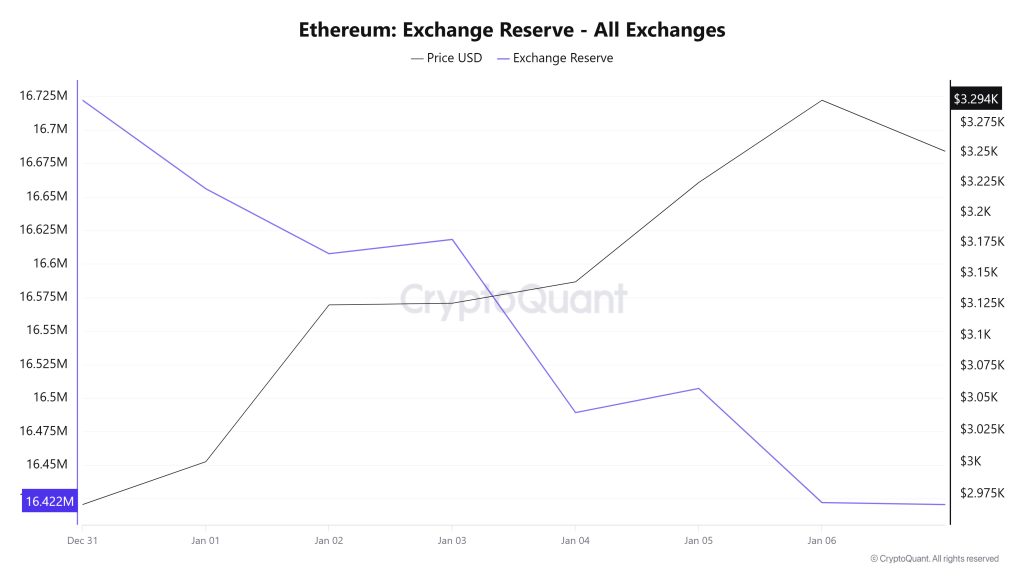
Between December 31, 2025, and January 6, 2026, Ethereum reserves on exchanges declined from 16,710,250 ETH to 16,422,029 ETH, resulting in a net outflow of 288,222 ETH. Exchange reserves decreased by approximately 1.72%. During this period, the price of ETH rose from $2,975 to $3,294, an increase of 10.74%. The decrease in reserves during this period of significant price increase indicates that investors preferred to protect their positions by withdrawing their ETH from exchanges rather than viewing the rise as a selling opportunity. In the short term, profit-taking may occur after the price increase, but the decrease in supply on exchanges may limit selling pressure. In the long term, the decline in reserves may continue to provide a supportive foundation for the Ethereum price.
| Date | December 31 | Jan 1 | Jan 2 | Jan 3 | Jan 4 | Jan 5 | 06-Jan |
|---|---|---|---|---|---|---|---|
| Exchange Inflow | 870,578 | 361,124 | 893,395 | 499,885 | 317,841 | 937,107 | 945,234 |
| Exchange Outflow | 858,783 | 427,111 | 941,847 | 489,241 | 446,927 | 919,118 | 1,030,358 |
| Exchange Netflow | 11,795 | -65,987 | -48,452 | 10,644 | -129,086 | 17,988 | -85,123 |
| Exchange Reserve | 16,722,045 | 16,656,057 | 16,607,605 | 16,618,250 | 16,489,164 | 16,507,152 | 16,422,029 |
| ETH Price | 2,975 | 3,000 | 3,124 | 3,125 | 3,143 | 3,225 | 3,294 |
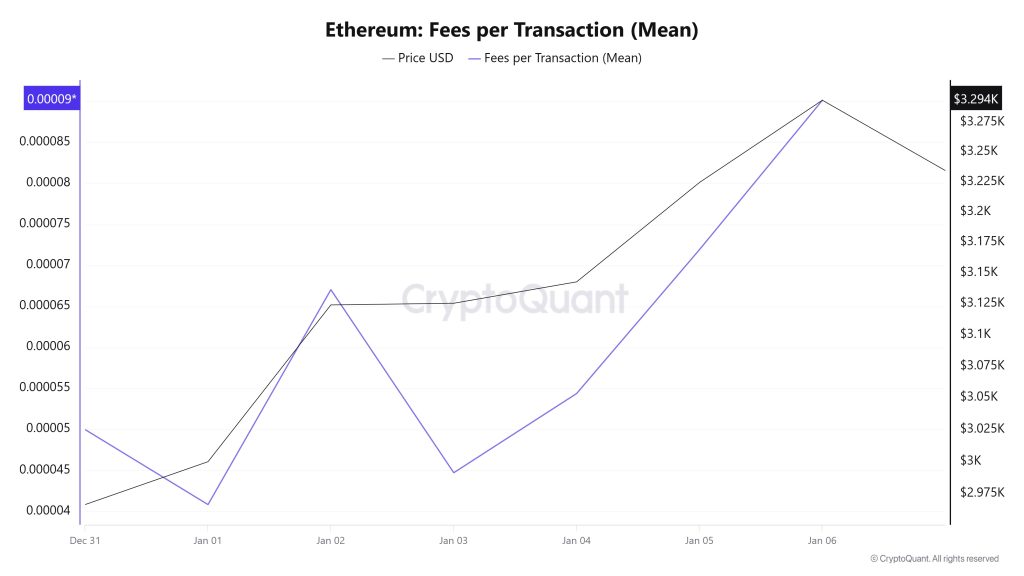
Fees and Revenues
When examining the Ethereum Fees per Transaction (Mean) data between December 31 and January 6, it is observed that on December 31, the first day of the week, the indicator reached 0.00004998272133582.A decline was observed until January 1, when the indicator recorded the week’s lowest value at 0.0000408391087251.In this context, as of January 1, the indicator regained momentum as a result of increased price volatility in Ethereum, and followed a positive trend due to the impact of price volatility.On January 6, the last day of the weekly period, the indicator closed the week at 0.000090128370662669.
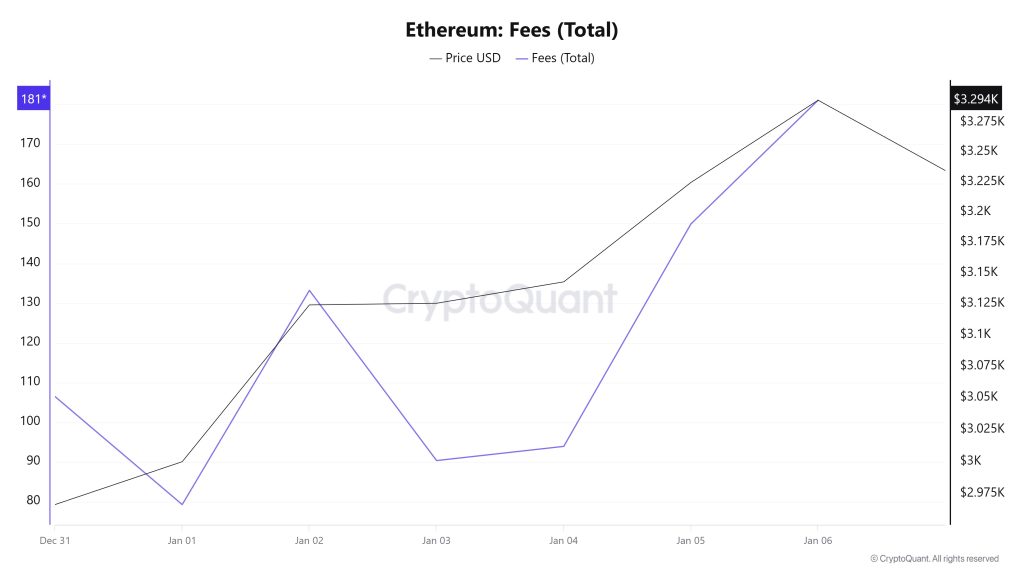
Ethereum: Fees (Total)
Similarly, when examining the Ethereum Fees (Total) data for the period between December 31 and January 6 at , it can be seen that the indicator stood at 106.46564559864159 on December 31, the first day of the week.
A decline was observed until January 1, and on that date, the indicator recorded its lowest value of the week at 79.2787564561664.
In this context, as a result of the increase in Ethereum price volatility as of January 1, the indicator regained momentum and followed a positive trend due to the impact of price volatility.
On January 6, the last day of the weekly period, the indicator closed the week at 181.06753614781977.
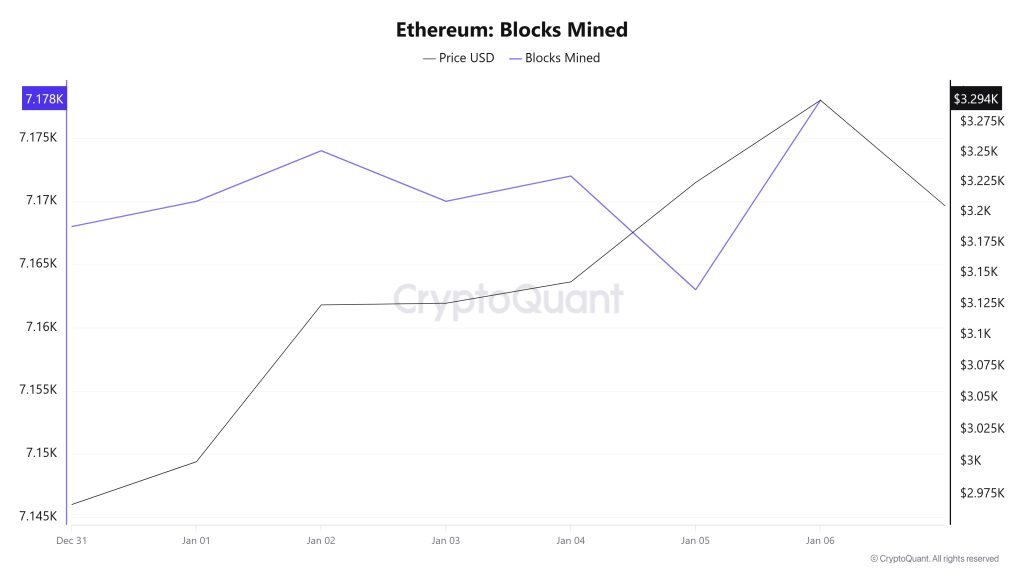
Blocks Mined
When examining Ethereum block production data between December 31 and January 6, an increase was observed throughout the week. While 7,168 blocks were produced on December 31, this number rose to 7,178 as of January 6.During the period in question, a time-dependent correlation structure was observed between the Ethereum price and the number of blocks produced. However, the general trend indicates that a positive correlation between these two variables is predominant.
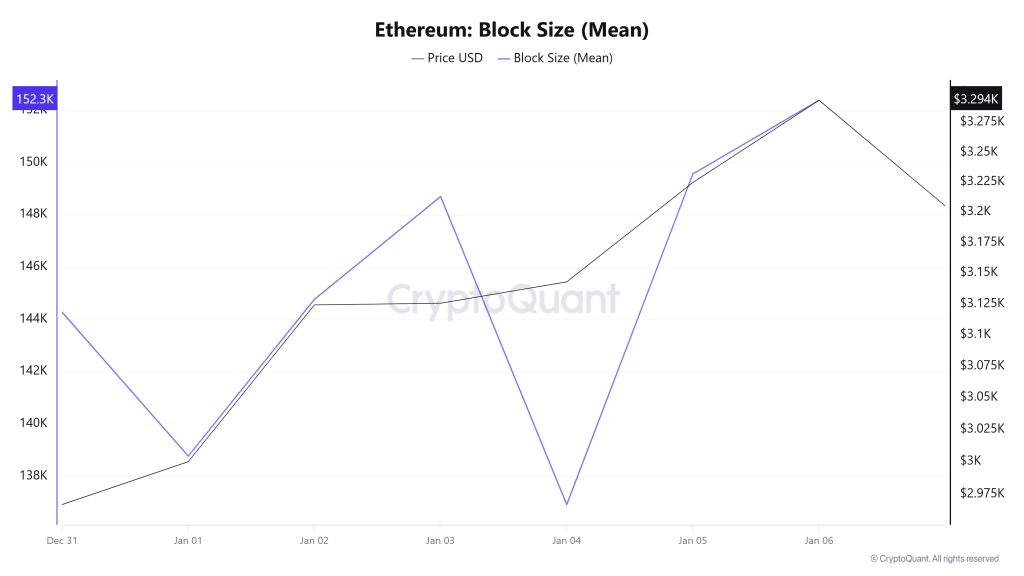
Block Size
When examining Ethereum block size data between December 31 and January 6, an increase was observed throughout the week. While the average block size on December 31 was measured at 144,275 bytes, this value rose to 152,384 bytes as of January 6. During the relevant period, a time-dependent correlation structure was observed between block size and Ethereum price. However, the general trend indicates that a positive correlation between these two variables is dominant.
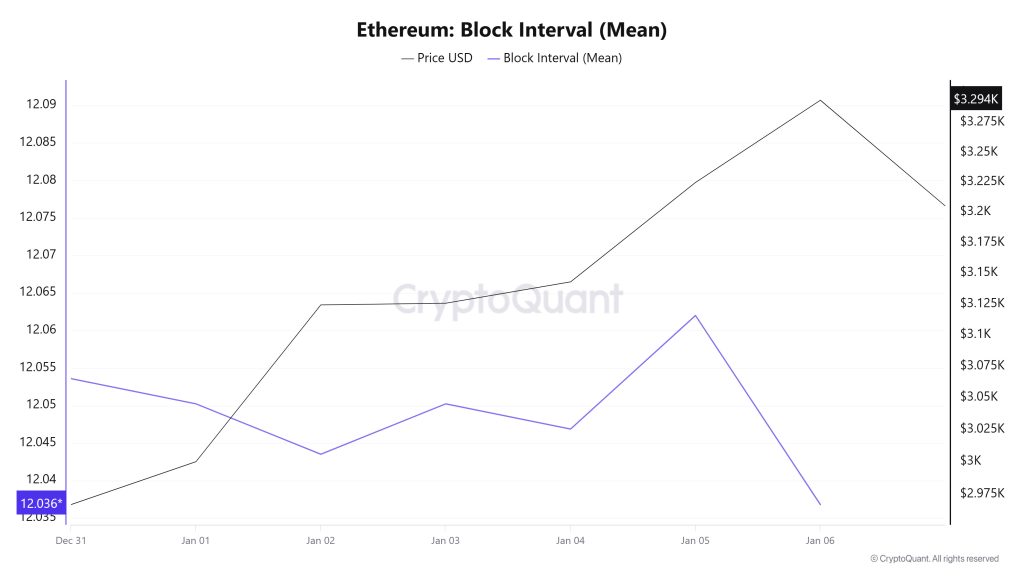
Block Interval
When examining the Ethereum block time between December 31 and January 6, a decrease was observed throughout the week. While the average block time was recorded as 12.05 seconds on December 31, this time decreased to 12.03 seconds as of January 6.During the period in question, a time-dependent correlation structure was observed between Ethereum block time and price movement. However, the general trend indicates that a negative correlation between these two variables is dominant.
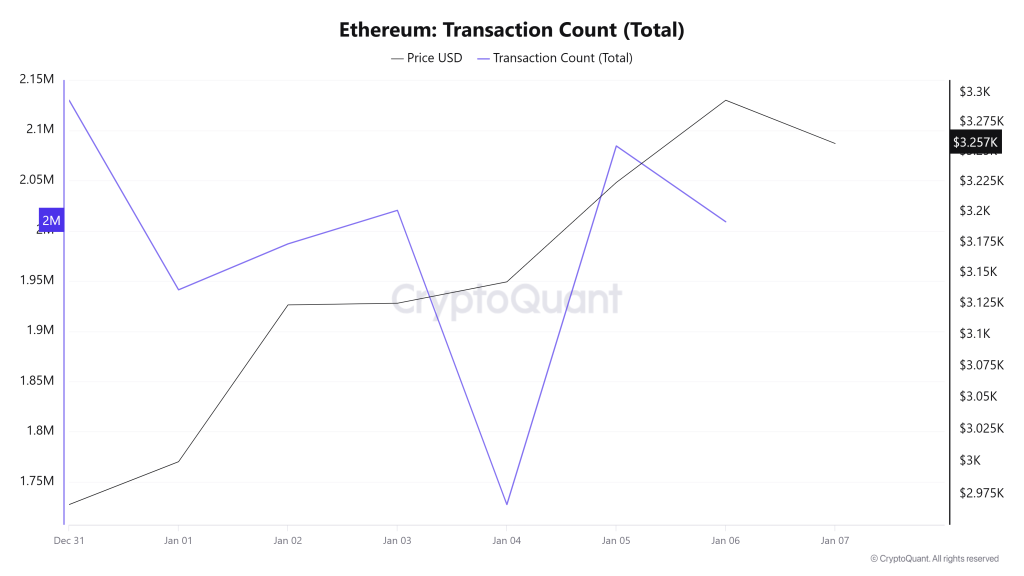
Transaction
Last week, 11,912,532 transactions were executed on the Ethereum network, while this week the number of transactions increased by approximately 1.66% to 12,111,308. The highest transaction volume for the period was recorded on December 31 at 2,130,049, while the lowest transaction volume was recorded on January 4 at 1,727,390. Although the correlation between the number of transactions and the price showed a mixed picture at times throughout the period, a negative trend was generally dominant. However, the modest acceleration in network activity compared to the previous period points to a recovery in transaction momentum on the Ethereum side.
Tokens Transferred
The total amount of ETH transferred last week was 12,093,526 ETH, while this week the value fell to 9,872,380 ETH, recording a decline of approximately 18.36%. The highest transfer volume during the period was 2,225,105 ETH on January 8, while the lowest value was 720,793 ETH on January 4.When considering the up to 300% fluctuation in daily transfers, the increase in transaction volume, and the decline in the average amount of Ethereum per transaction, it appears that a structure has been formed that could increase the range of price fluctuations on the network. This outlook indicates that more small-scale investors have become active compared to the previous period, creating a positive environment for network health but one that carries short-term risks in terms of pricing. At this stage, the revival in network activity alone does not produce a sufficient positive signal. Unless large-volume transfers regain strength, the price may not be able to break out of its volatile structure. In the short term, the chain is active, but the market remains cautious.
Estimated Leverage Ratio
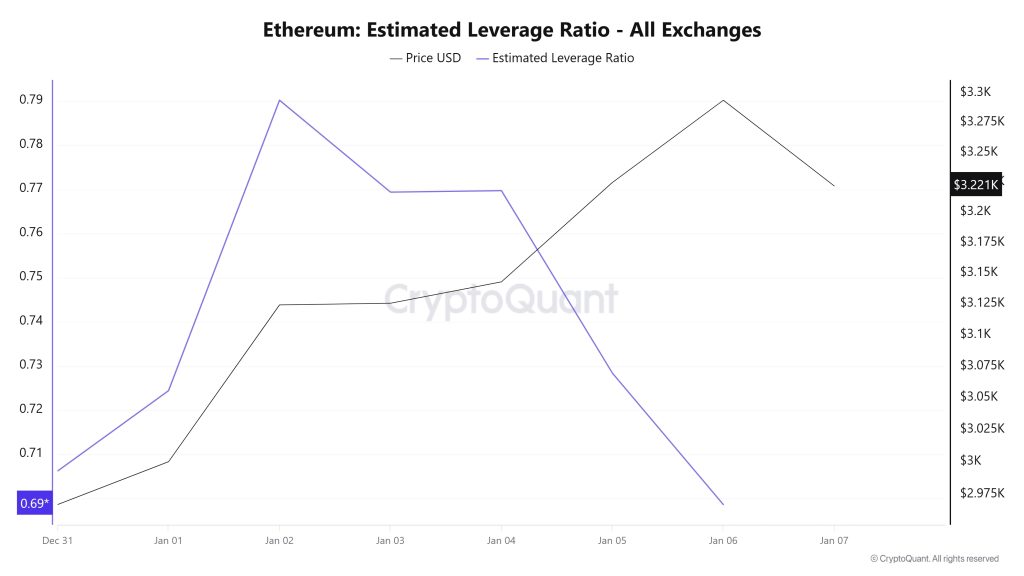
The metric rose until the middle of the 7-day period. On December 31, the first day of the period, the metric was 0.706, and on January 2, it reached its peak at 0.790. It then continued to rise until December 19, reaching its peak at 0.761. The metric then began to decline for the remainder of the period, reaching its lowest point at 0.696. A higher ELR means that participants are willing to take on more risk and usually indicates bullish conditions or expectations. The increases may also be due to a decrease in reserves. Looking at Ethereum reserves, there were 16.72 million reserves at the beginning of the process, but this figure steadily declined during the rest of the process and currently stands at 16.41 million. At the same time, Ethereum’s Open Interest was $37.24 billion at the beginning of the process. Currently, volume has increased during the process, and the open interest value stands at $41.64 billion. With all this data, the ELR metric fluctuated throughout the process. The asset’s price fluctuated between $2,970 and $3,300 based on all this data. Ultimately, the increase in open interest data seen throughout the process, coupled with the steady decline in reserves, explains the rise in the ELR metric. This signaled an increase in investor risk appetite and indicated the formation of upward expectations.
ETH Onchain Overall
|
- The metrics and guidance provided in the table do not alone explain or imply any expectation regarding future price changes in any asset. Digital asset prices can fluctuate based on numerous variables. The on-chain analysis and related guidance are intended to assist investors in their decision-making process, and basing financial investments solely on the results of this analysis may lead to unfavorable outcomes. Even if all metrics produce positive, negative, or neutral results simultaneously, the expected outcomes may not materialize depending on market conditions. It would be beneficial for investors reviewing the report to take these warnings into consideration.
Legal Notice
The investment information, comments, and recommendations contained in this document do not constitute investment advisory services. Investment advisory services are provided by authorized institutions on a personal basis, taking into account the risk and return preferences of individuals. The comments and recommendations contained in this document are of a general nature. These recommendations may not be suitable for your financial situation and risk and return preferences. Therefore, making an investment decision based solely on the information contained in this document may not result in outcomes that align with your expectations.
Note: All data used in Ethereum on-chain analysis is based on CryptoQuant.
