
Active Addresses
Active Sending Addresses
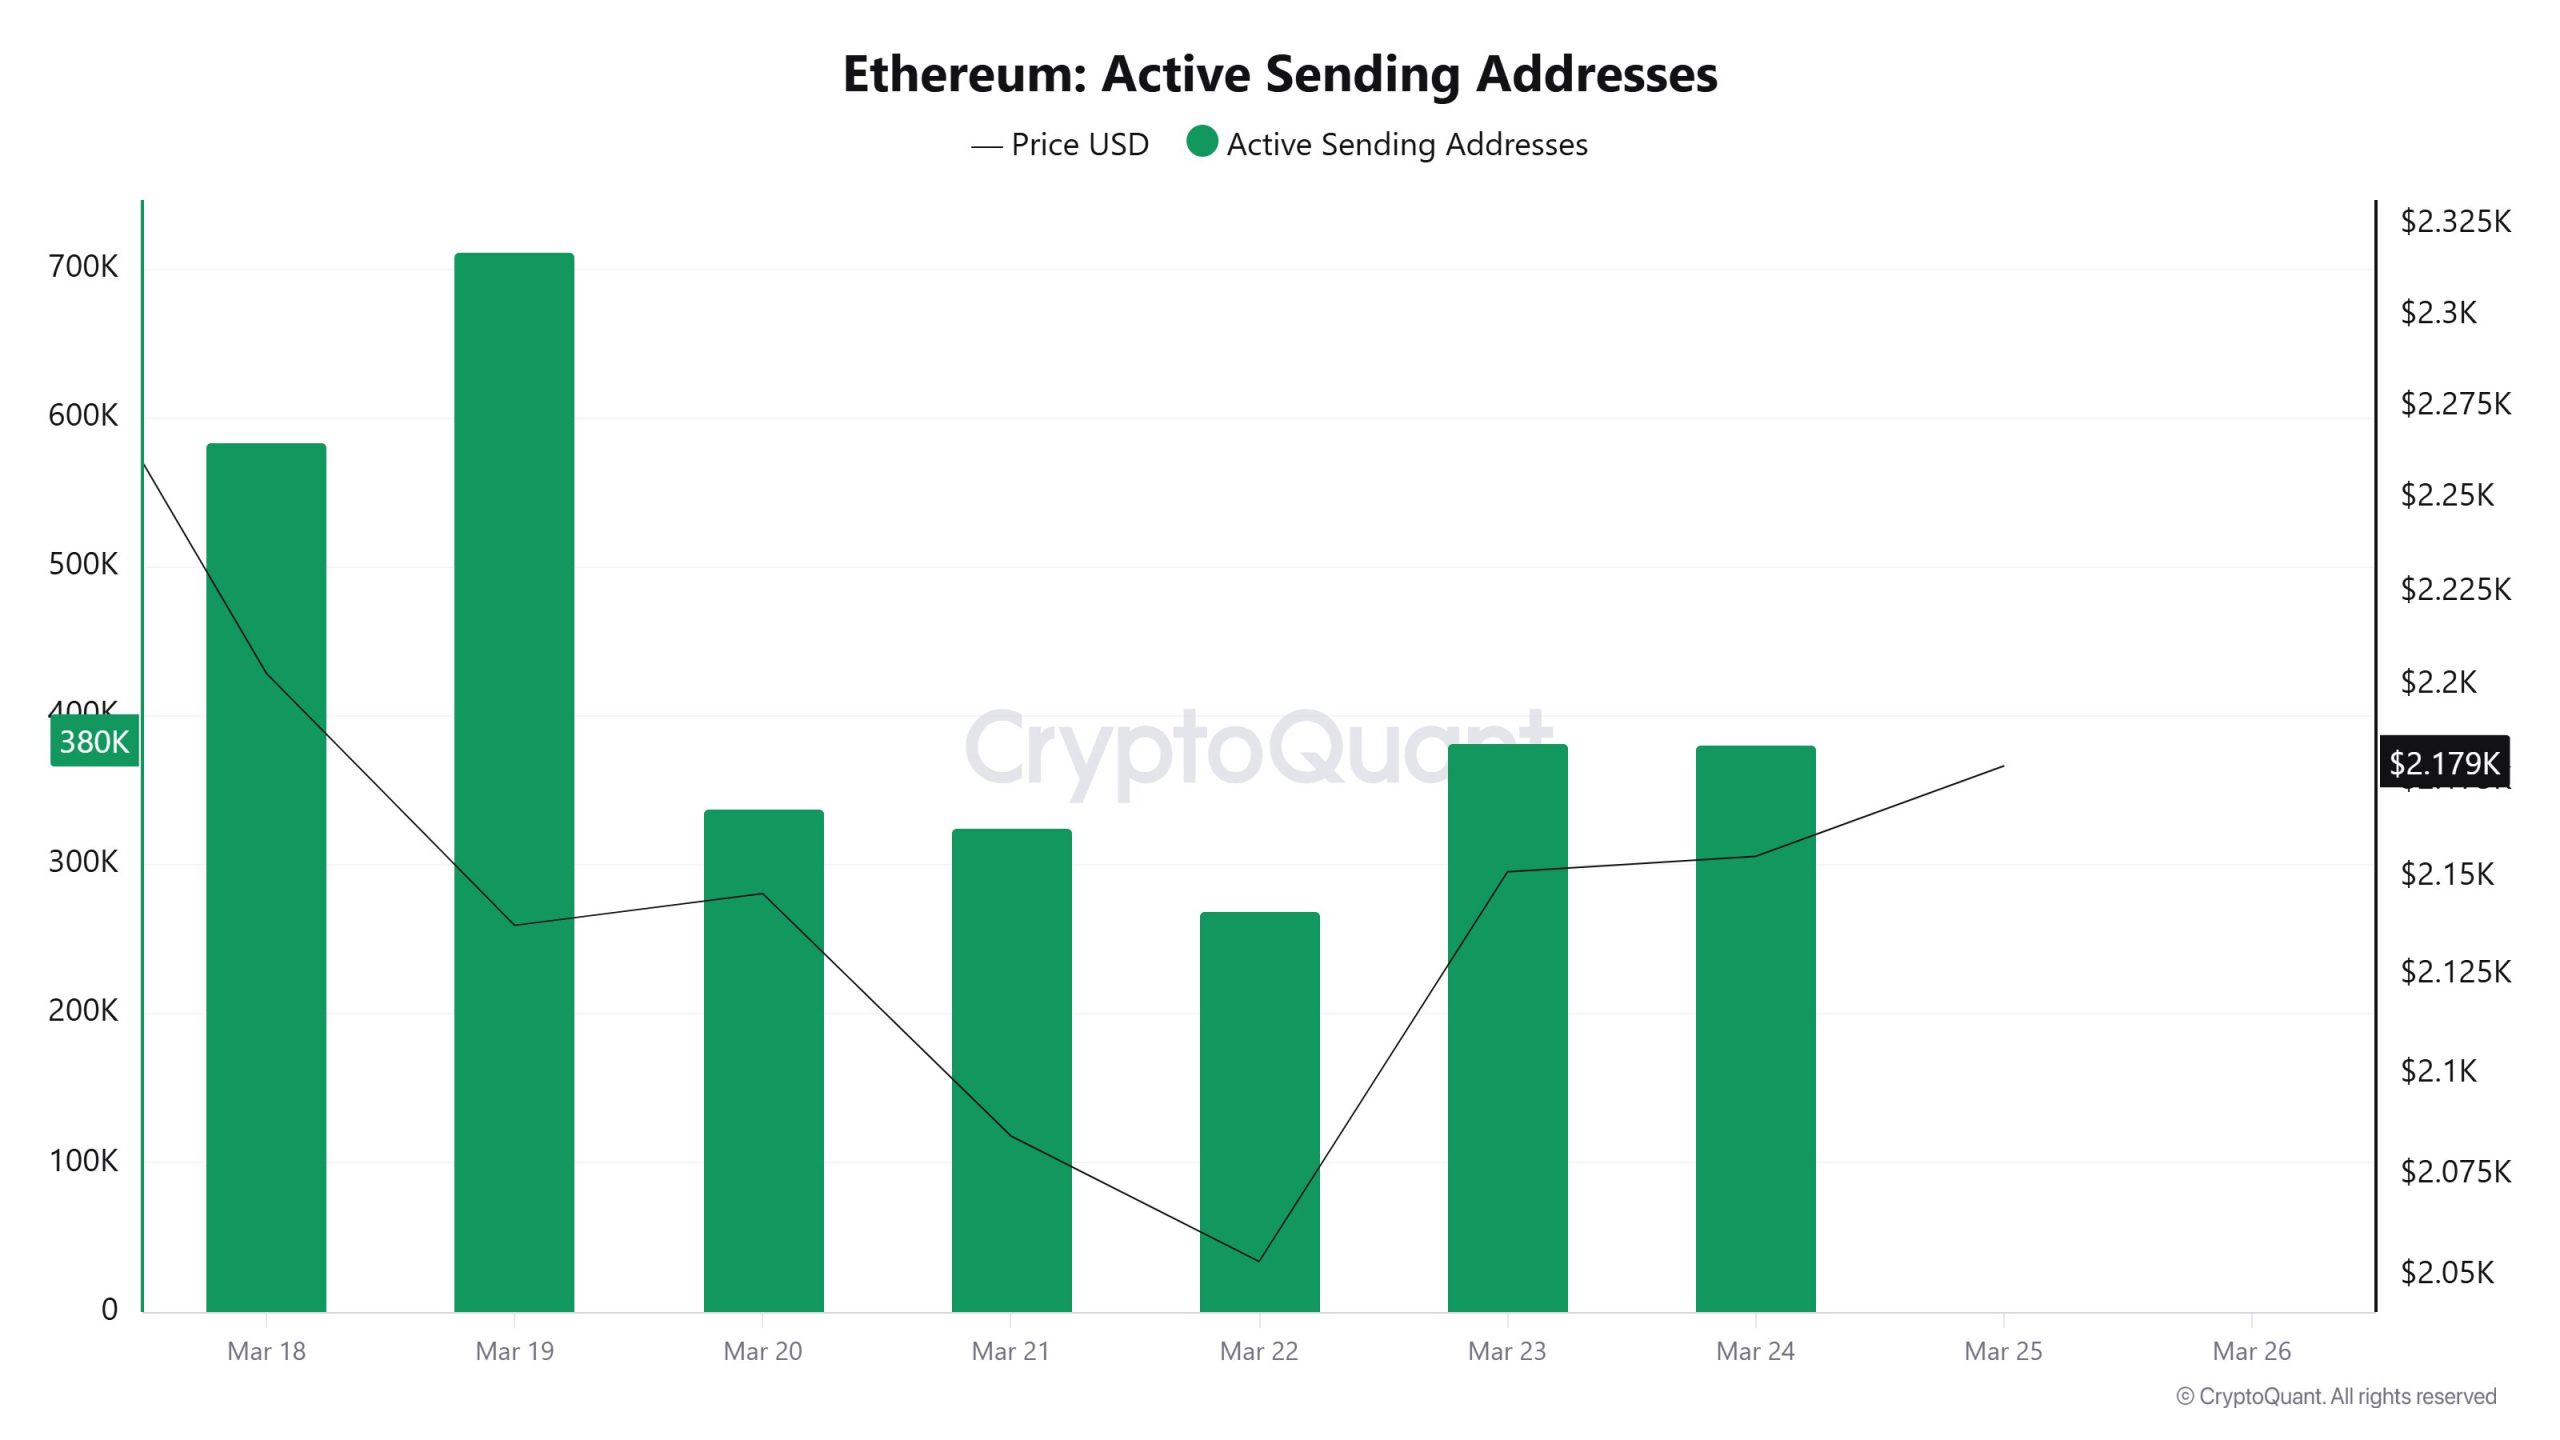
There has been more significant activity on the sending address side. High levels in the 550K–700K range were observed at the start of the week. A sharp decline occurred after March 20, with the figure dropping to 260K. It then rebounded, rising to the 370K range.
This pattern indicates that transaction activity slowed noticeably in the middle of the week but subsequently picked up again.
Active Receiving Addresses
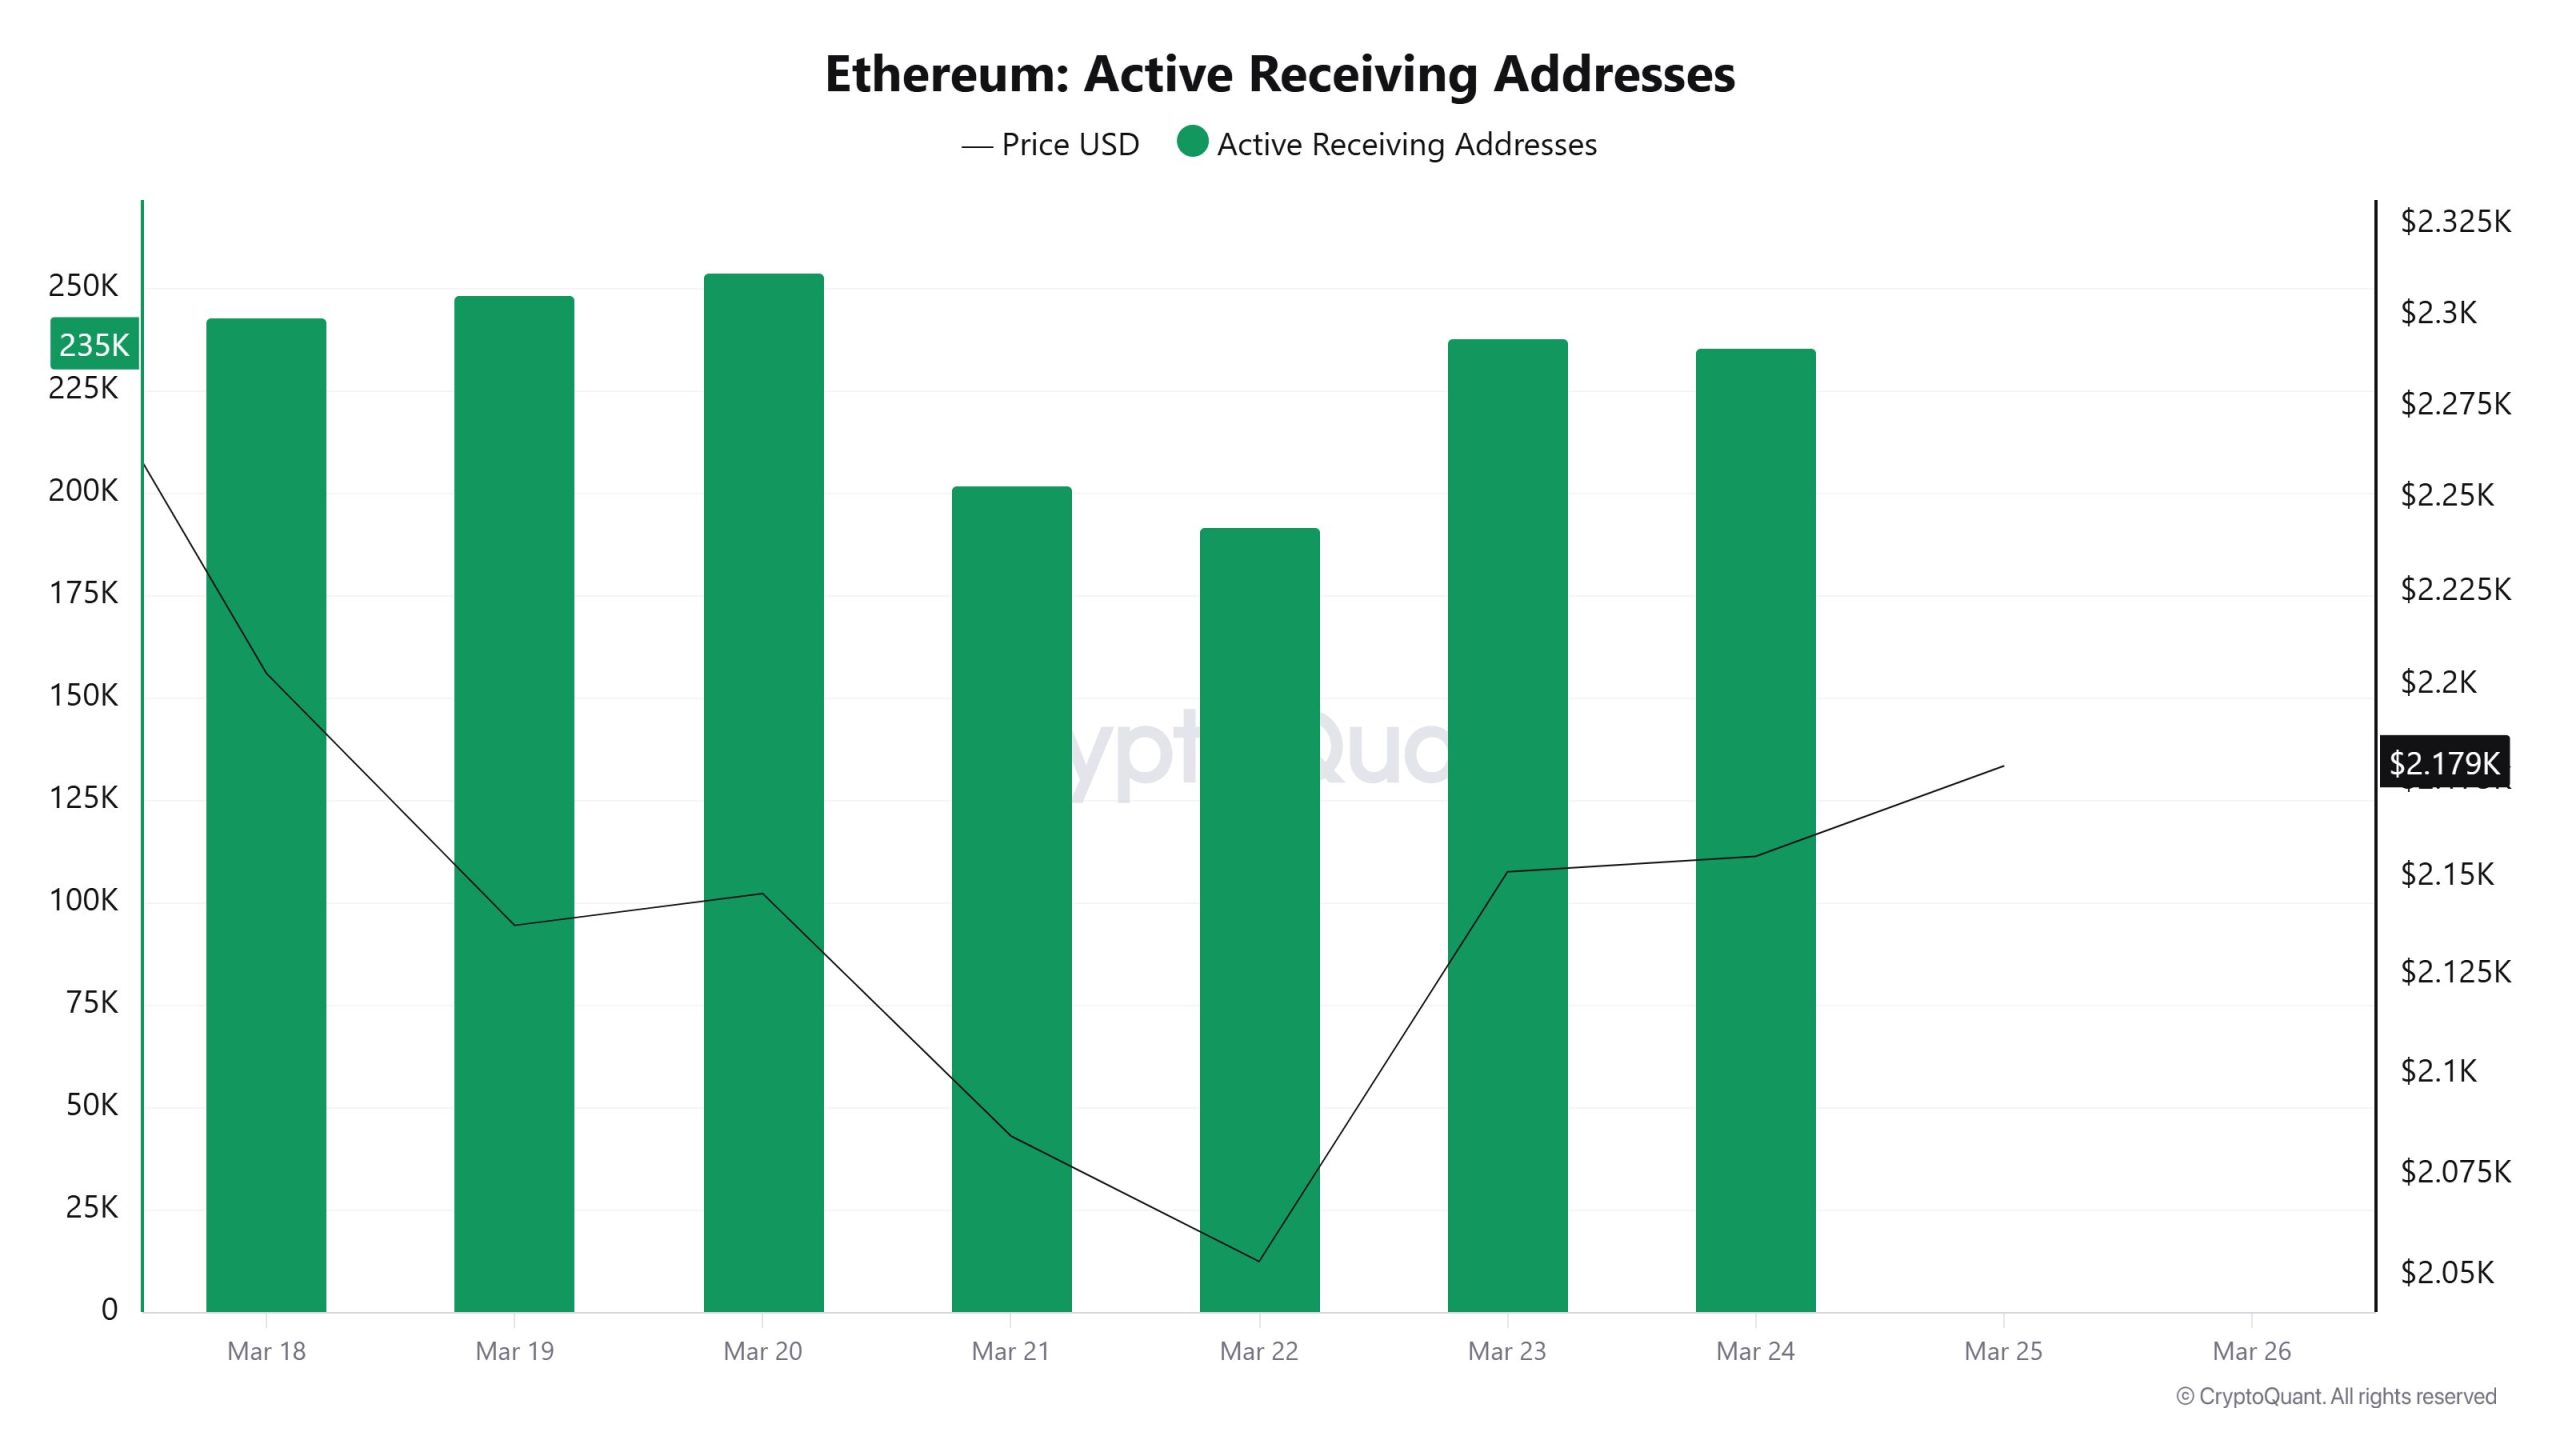
The number of receiving addresses hovered in the 230K–250K range at the start of the week. During the March 21–22 period, it dropped sharply to 190K. This decline was followed by a rapid recovery, and the figure rose back above 230K.
The mid-week pullback was short-lived. The subsequent rise indicates that new demand entering the network has strengthened again.
Total Value Staked
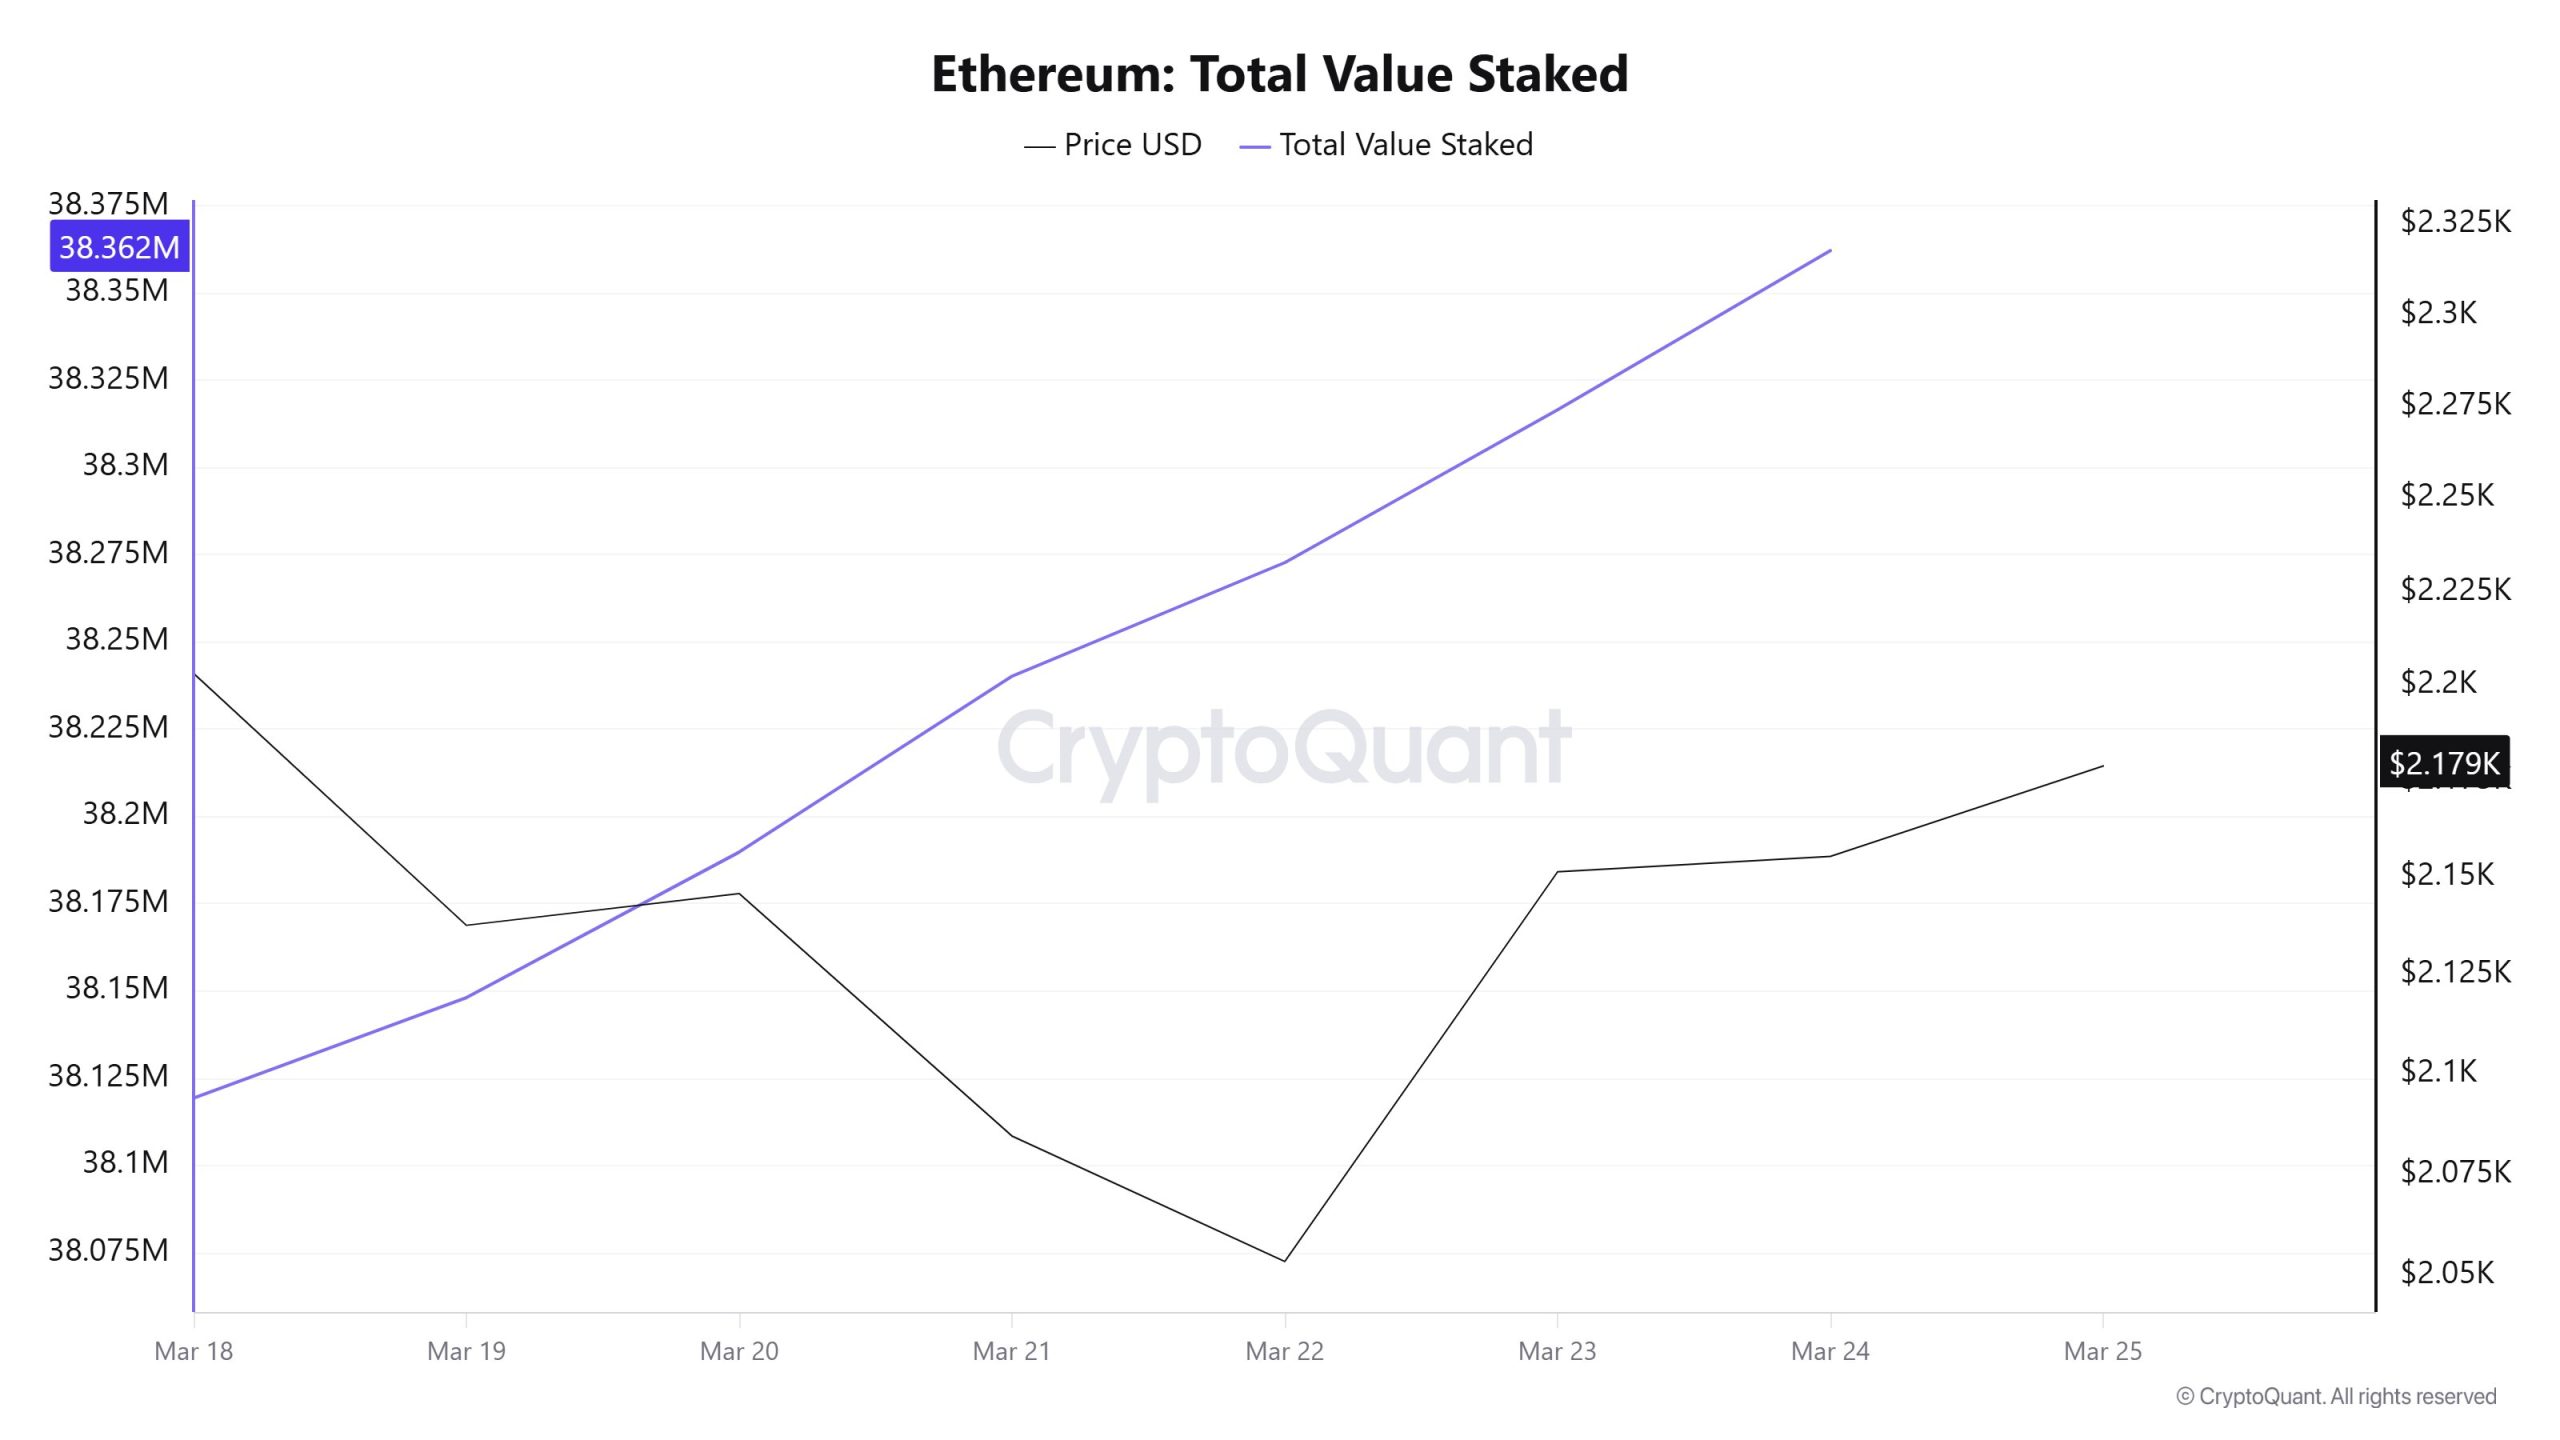
The total amount of ETH staked increased steadily throughout the week. Starting at 38.12 million, the figure rose to 38.35 million by the end of the week.
The pullback was virtually nonexistent. This indicates that investors are maintaining and adding to their staking positions.
Staking Inflows
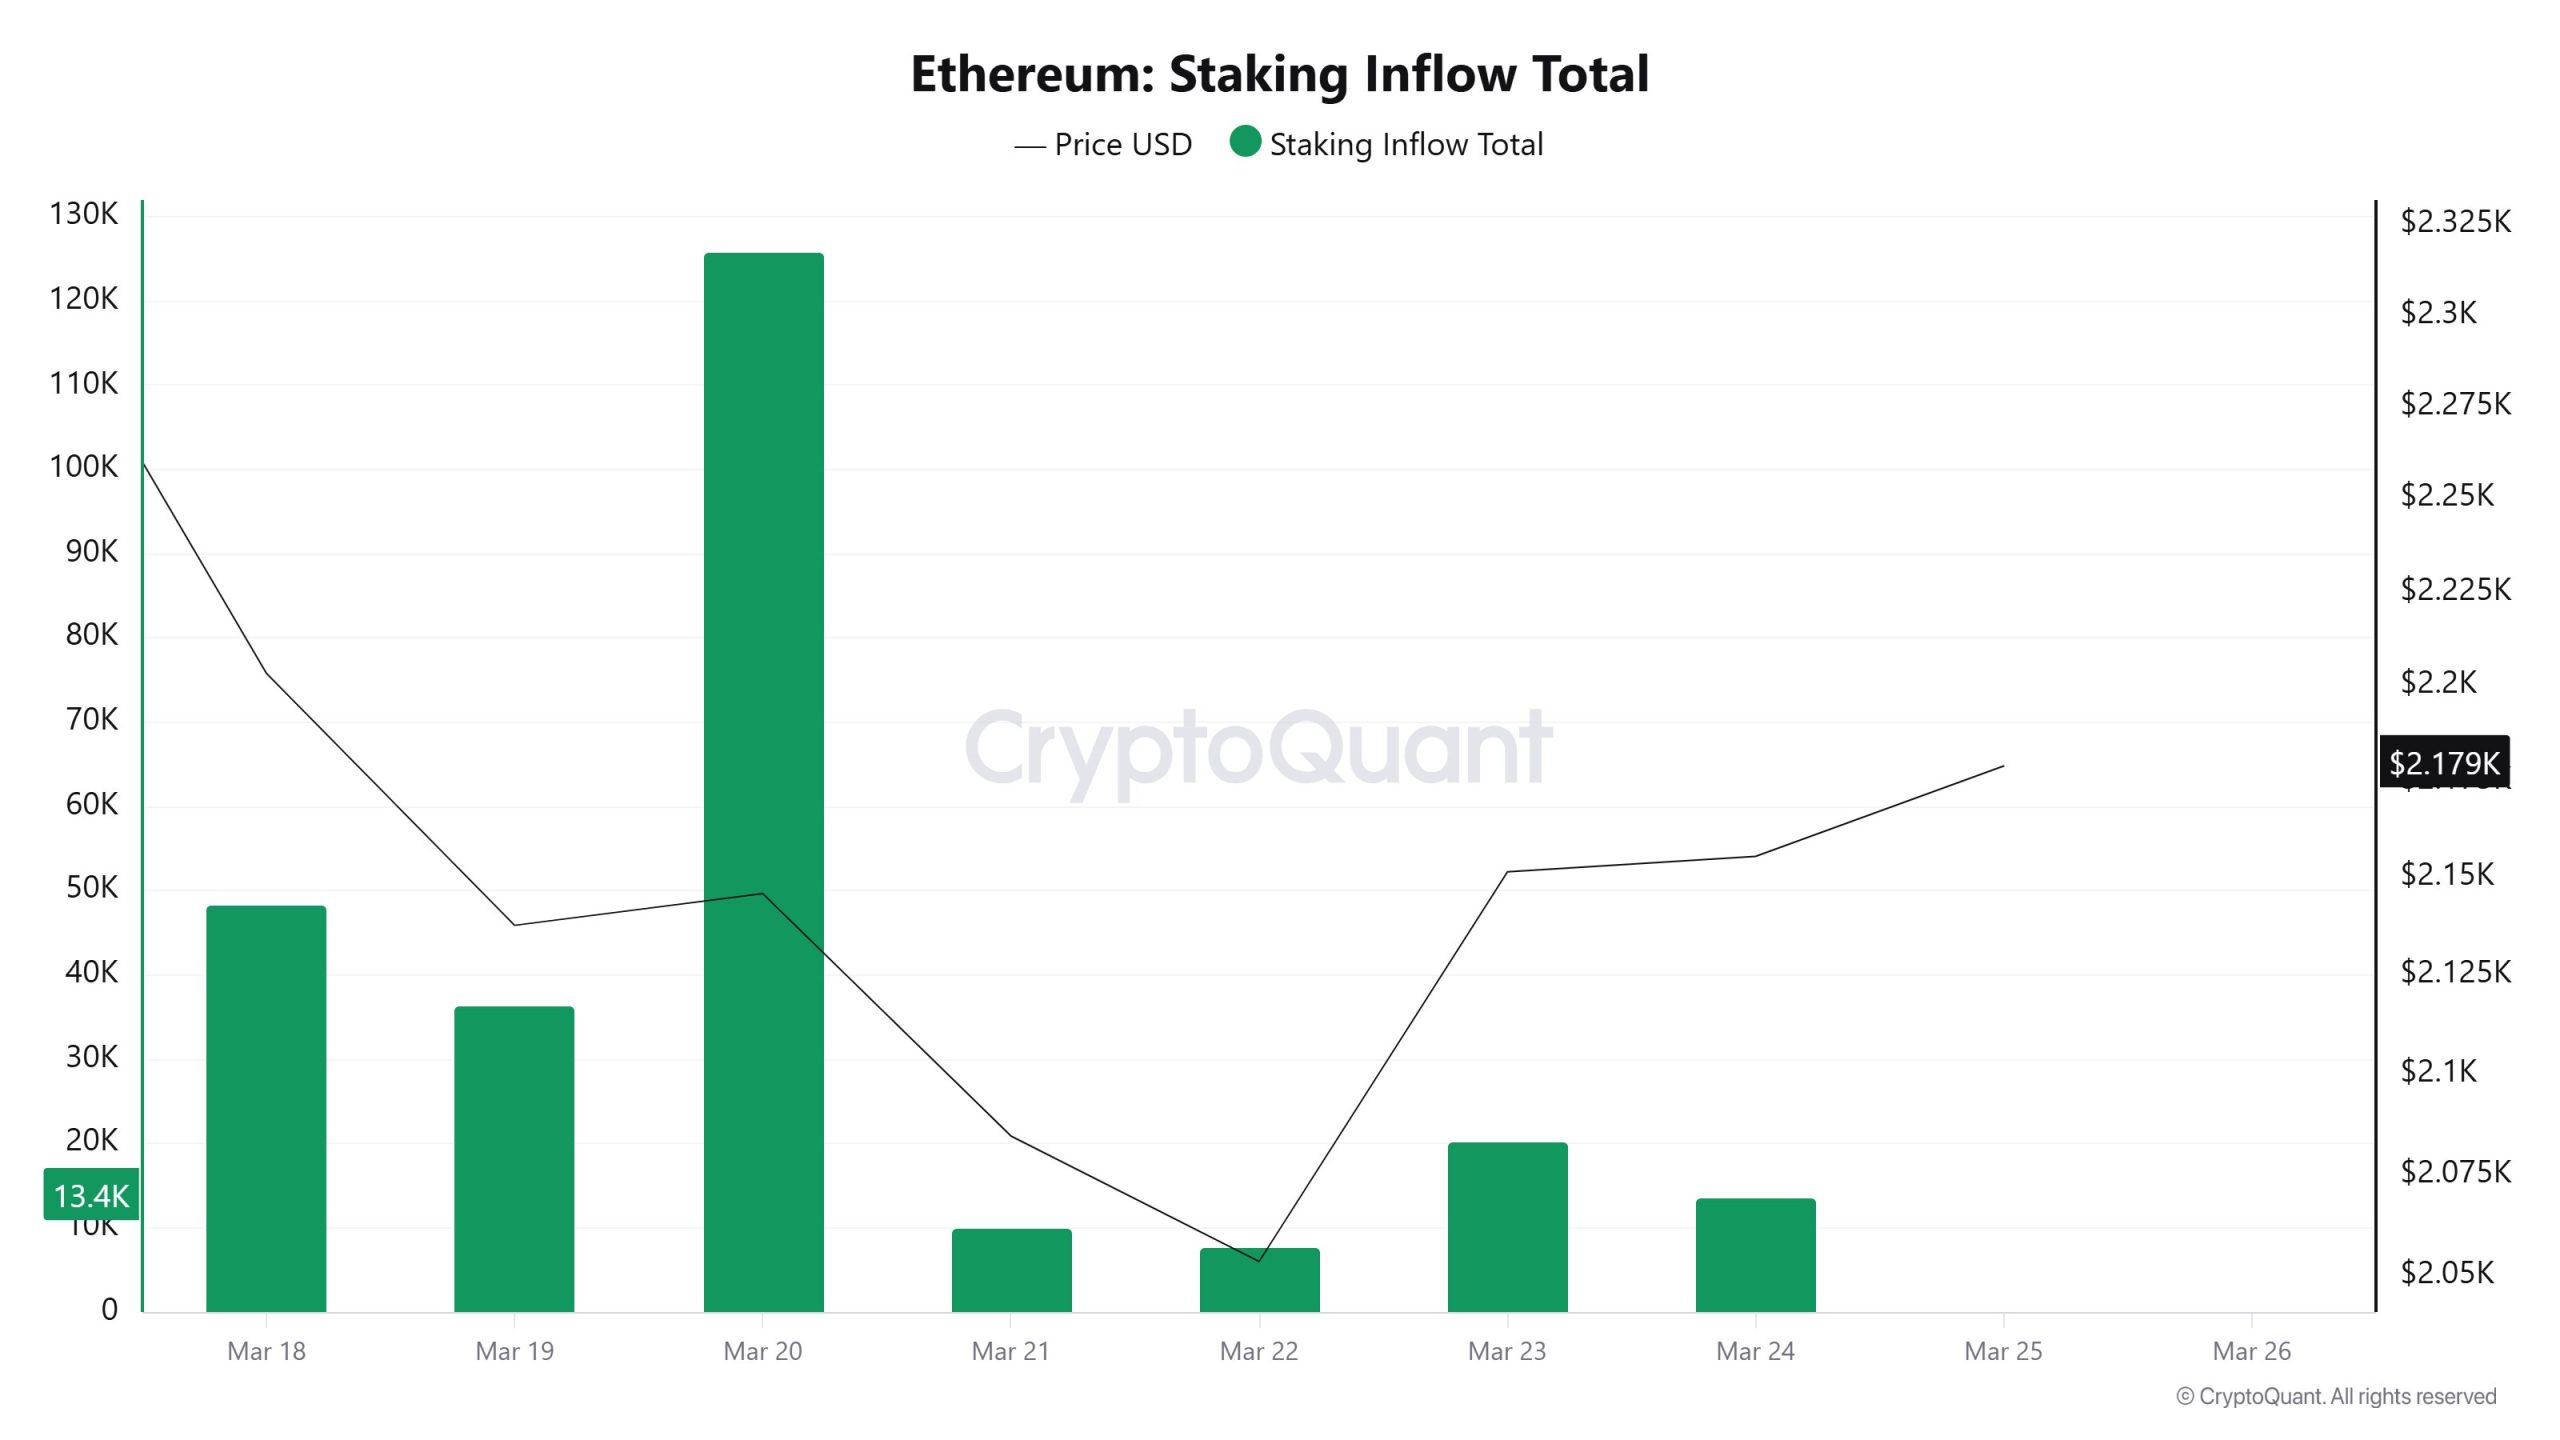
Staking inflows have been quite volatile. While inflows were in the 40K–50K range at the start of the week, there was a sharp surge above 120K on March 20. Following this, inflows dropped sharply, falling below 10K. In the latter part of the week, they rebounded to the 15K–20K range.
This data is unstable in the short term, but overall interest persists. The high inflow on March 20 is particularly noteworthy.
Derivatives
Open Interest
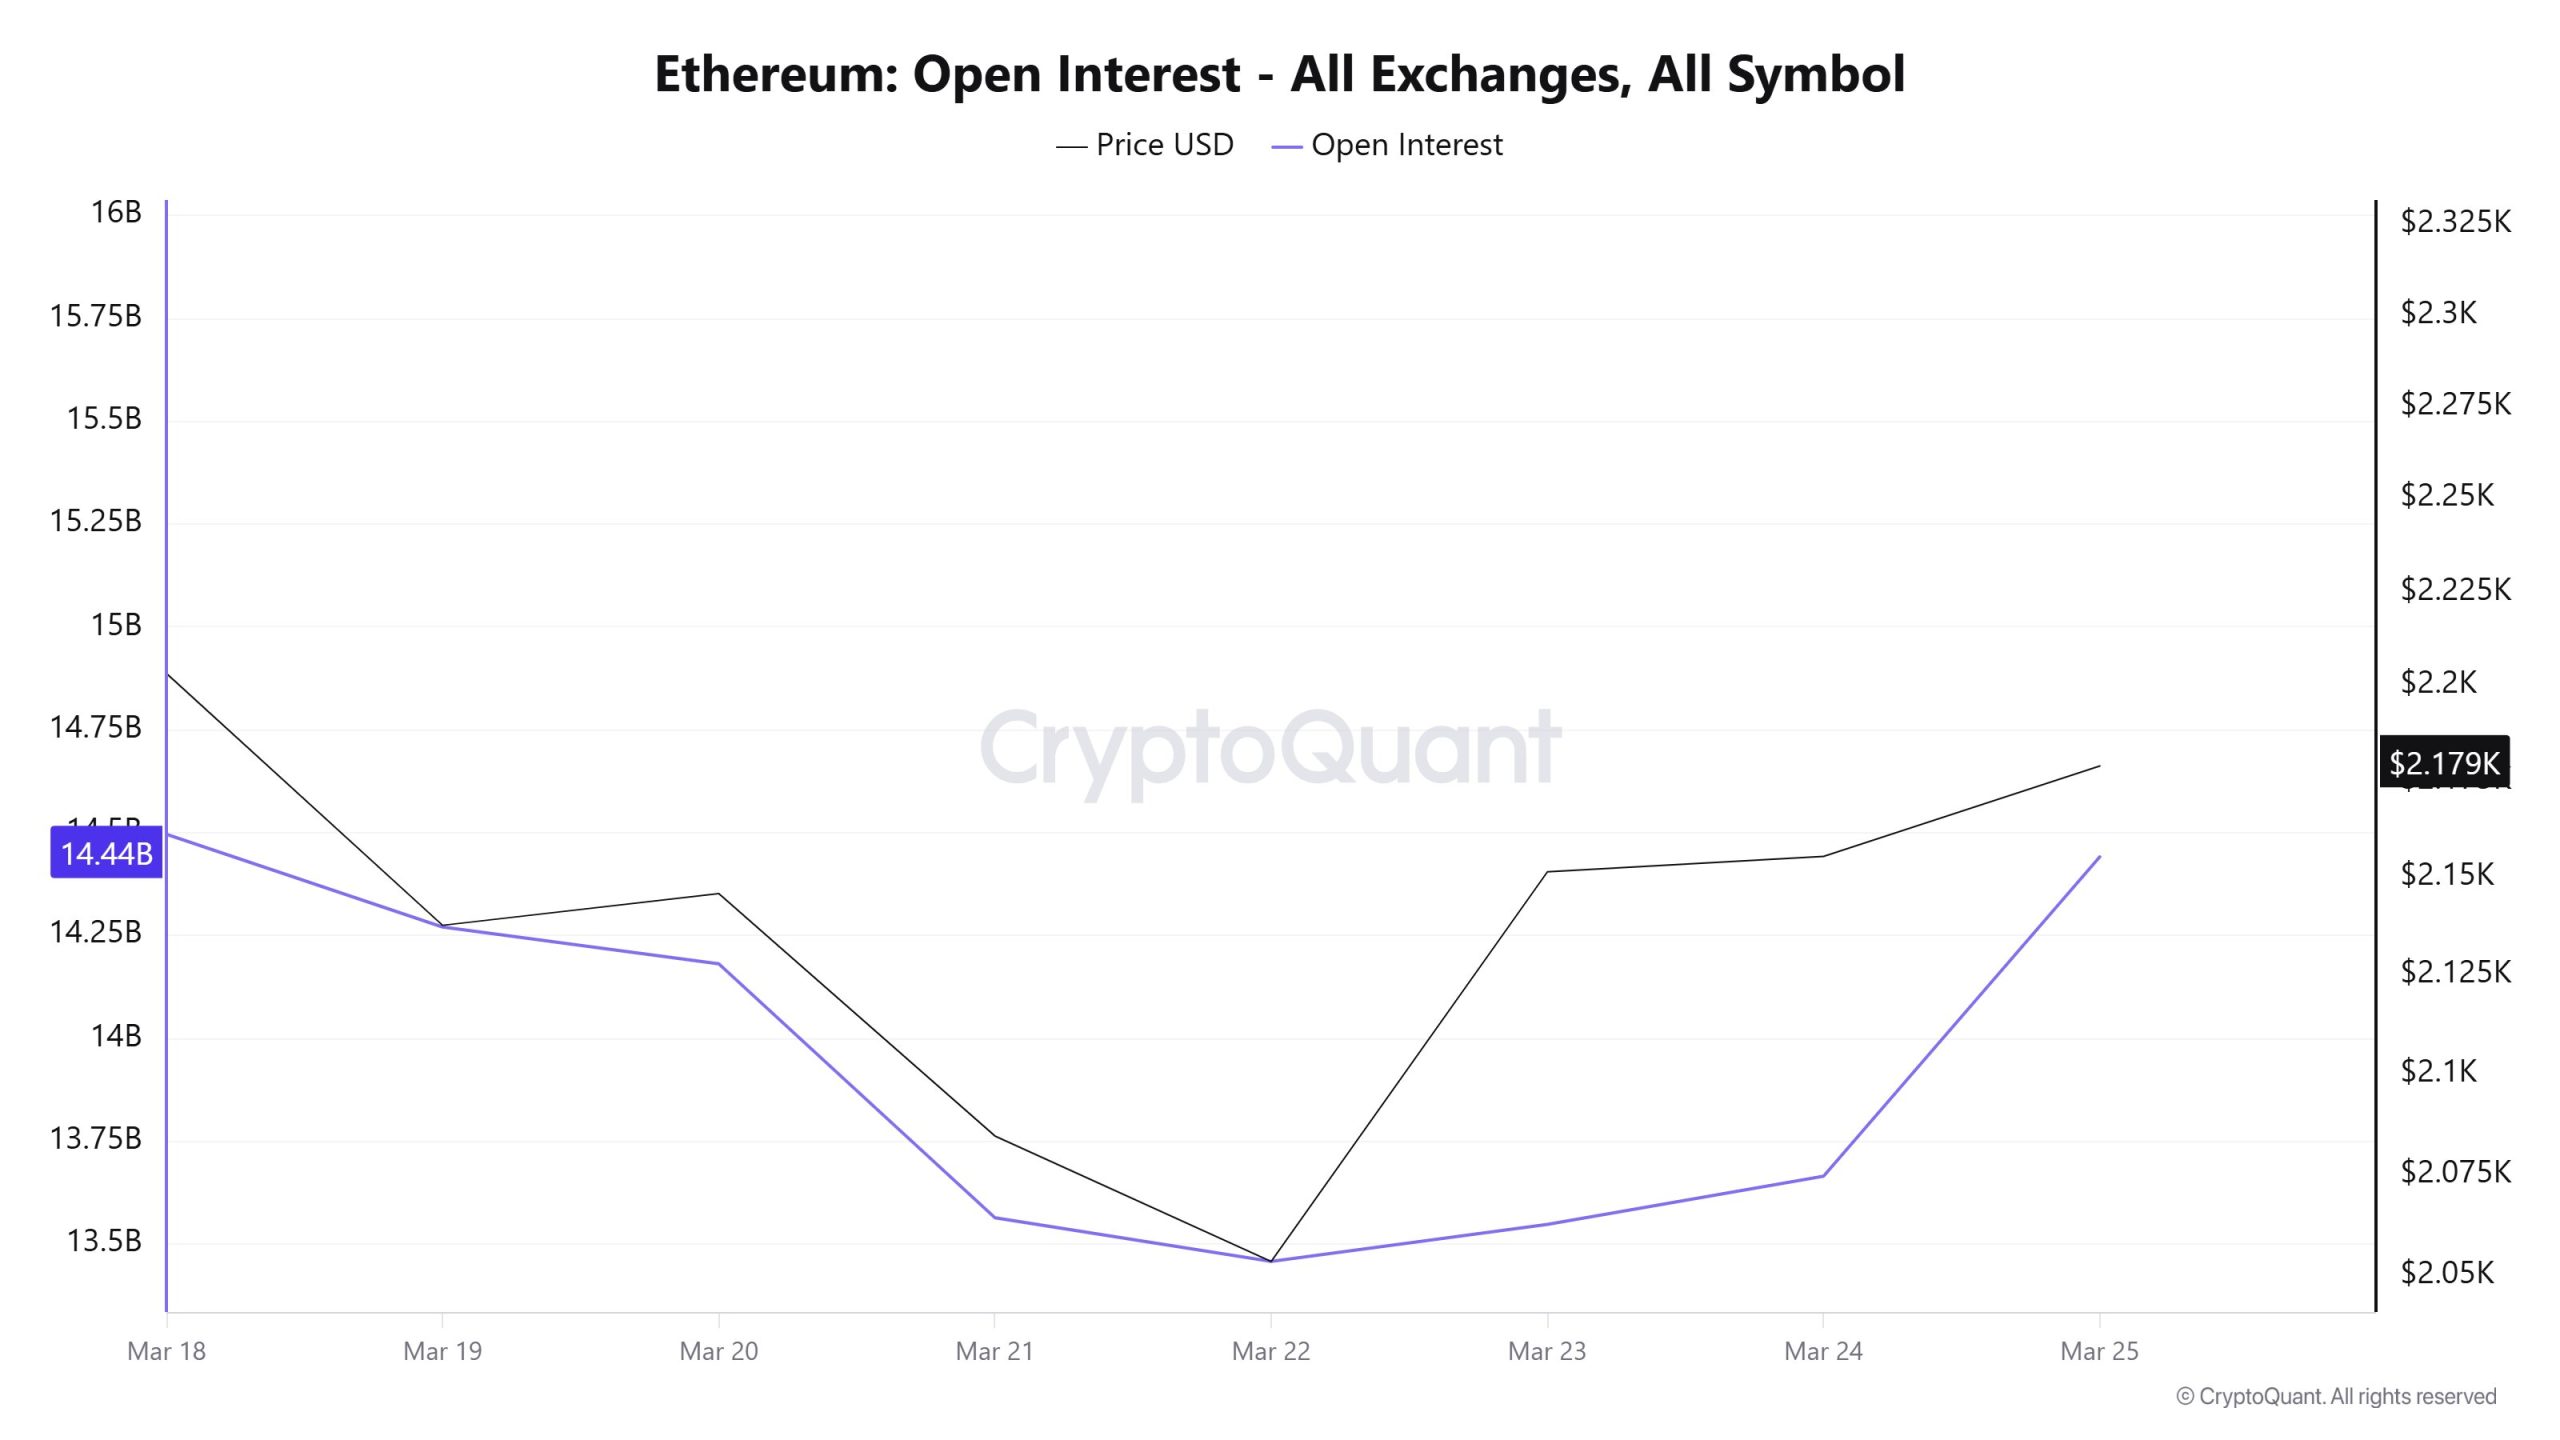
Open Interest was at approximately $14.4 billion at the start of the week. It declined to $13.5 billion by March 22. It then rose again, approaching $14.3 billion by the end of the week.
First, position closures are observed, followed by new entries. In other words, the market was first drained and then refilled.
Funding Rate
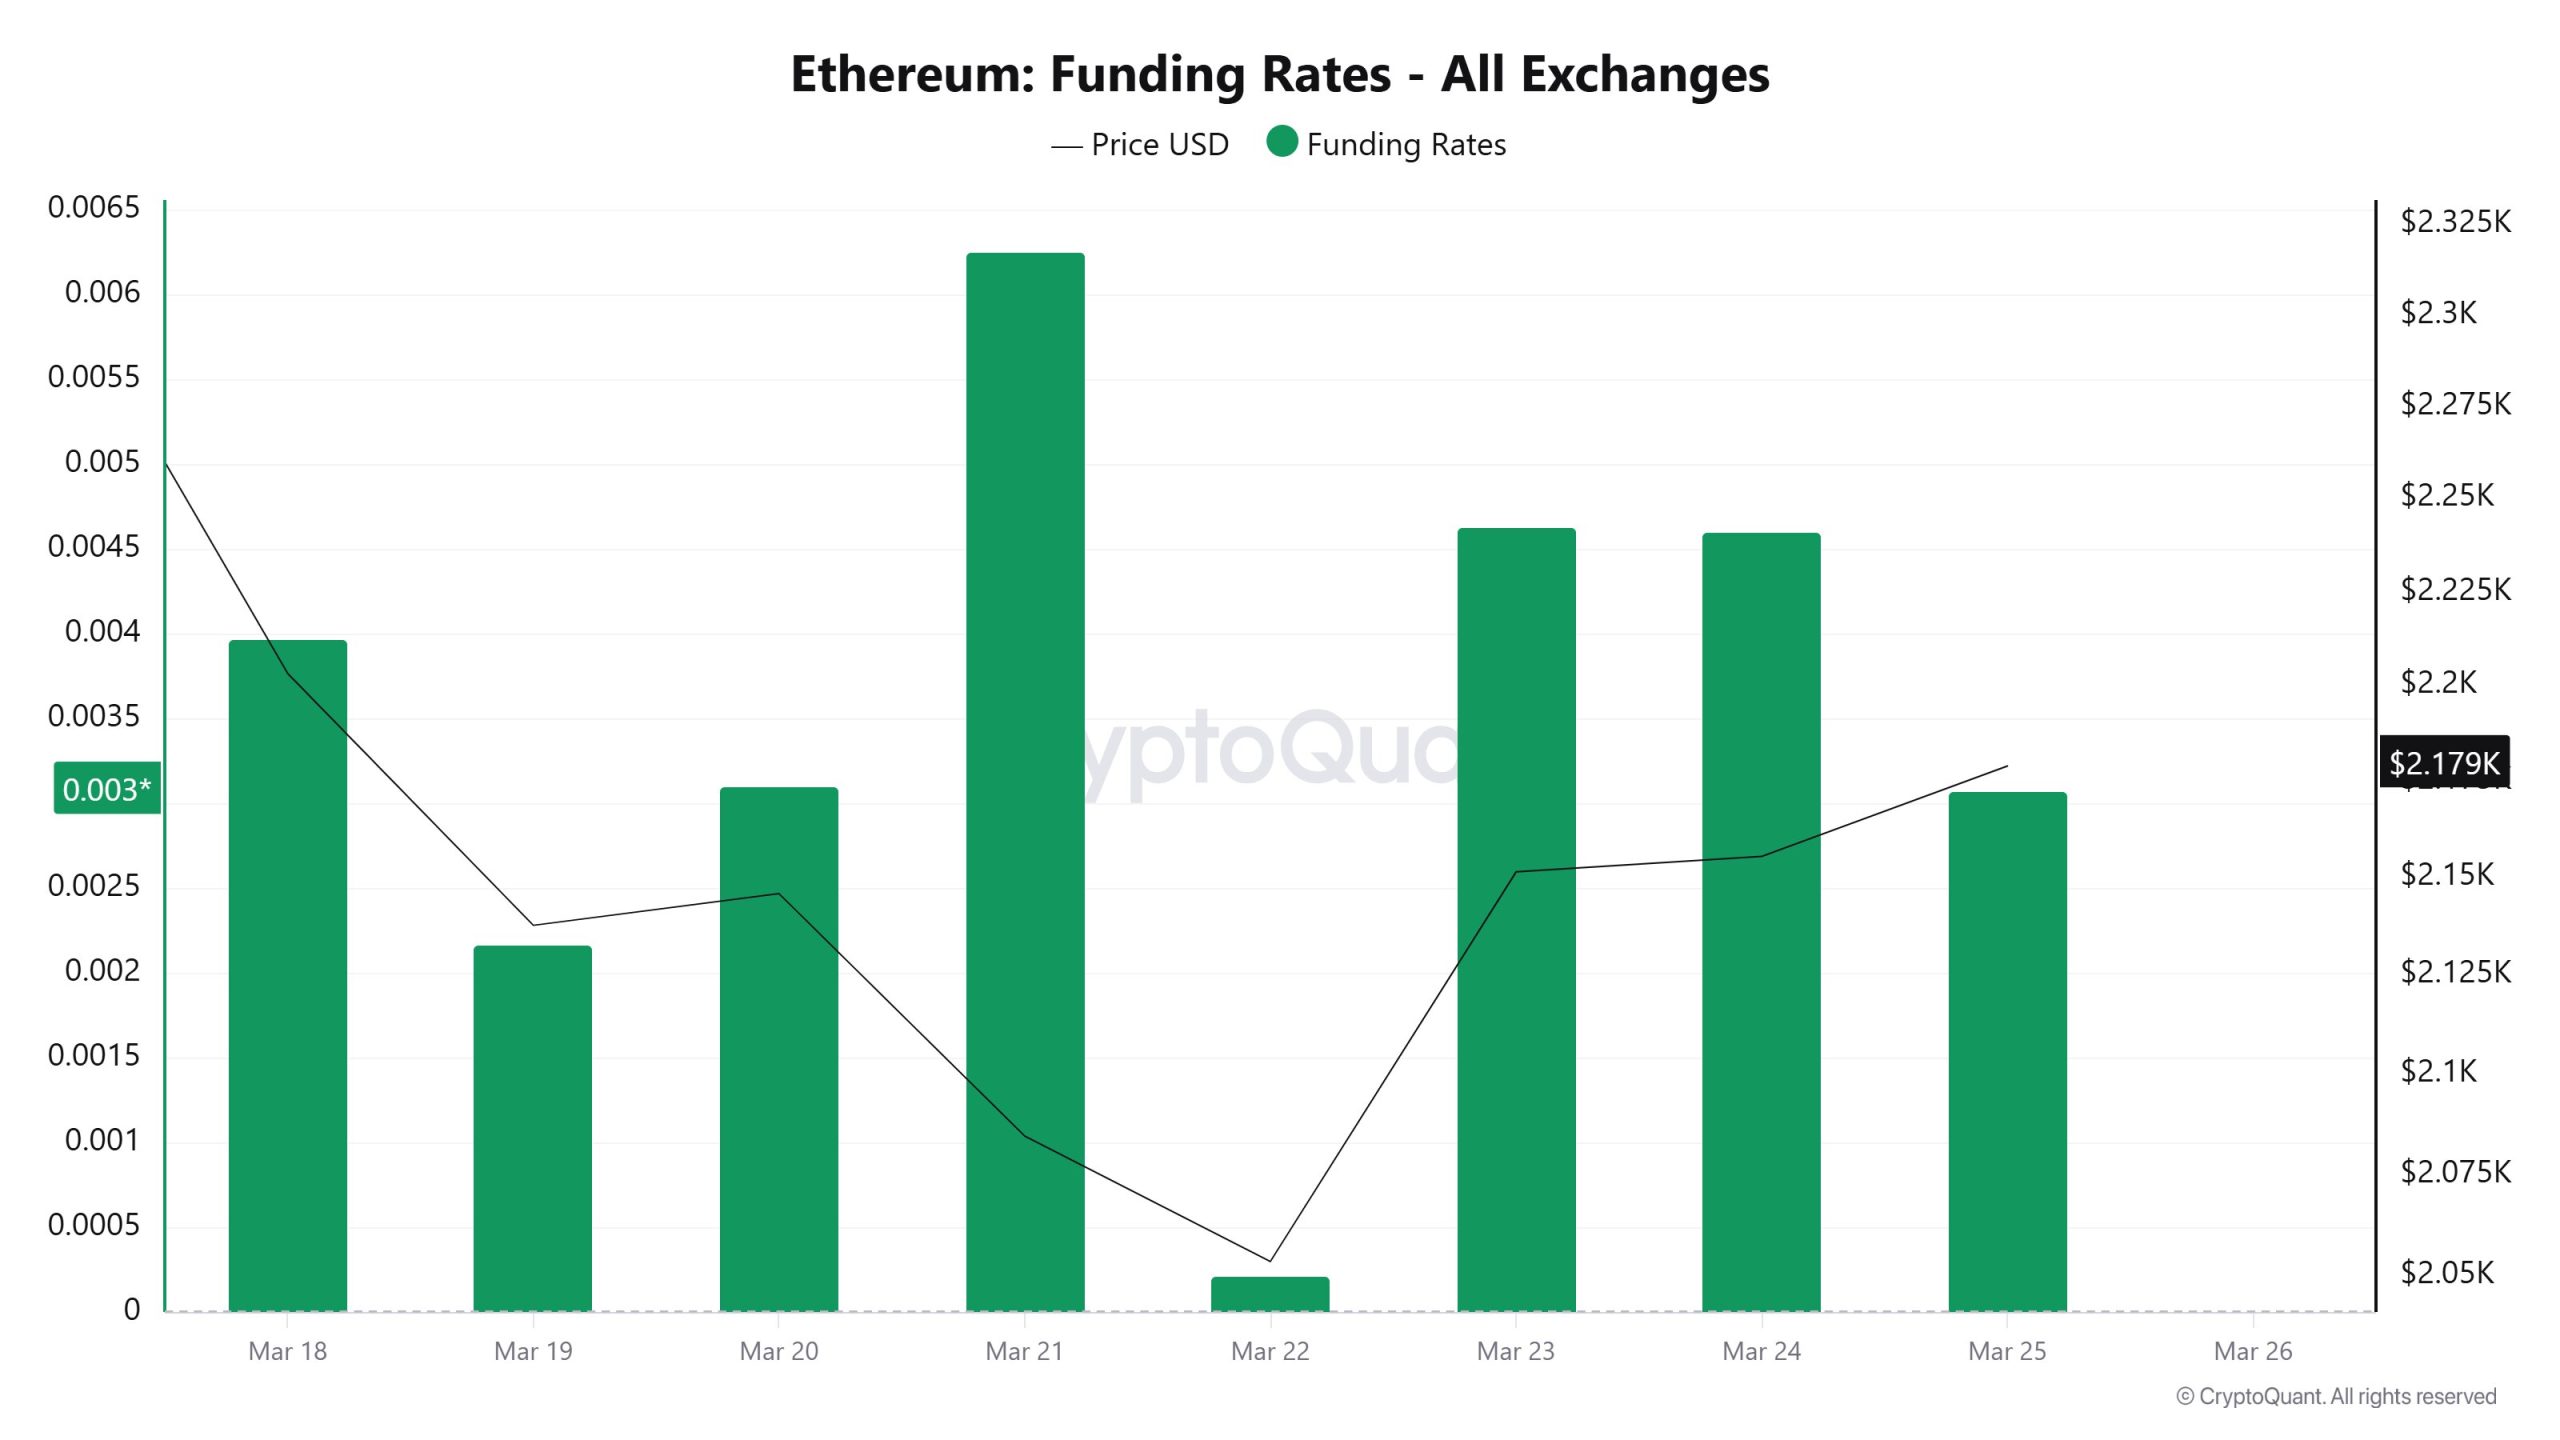
The funding rate remained mostly in positive territory throughout the week. Although it dropped to very low levels on March 22, it did not enter negative territory. It subsequently rose again, reaching the 0.004–0.006 range.
This pattern indicates that long positions have generally dominated the market. In particular, the upward momentum strengthened after the middle of the week.
Long & Short Liquidations
The ETH price fell from the $2,350 level to $2,020 last week and then rebounded toward the $2,200 level. Meanwhile, $871 million in long positions and $905 million in short positions were liquidated.
| Date | Long Amount (Million $) | Short Amount (Million $) |
|---|---|---|
| March 18 | 544.61 | 30.83 |
| March 19 | 86.96 | 48.88 |
| March 20 | 24.25 | 34.39 |
| March 21 | 46.63 | 3.87 |
| March 22 | 86.11 | 137.47 |
| March 23 | 60.05 | 622.43 |
| March 24 | 23.32 | 27.57 |
| Total | 871.93 | 905.44 |
ETH On-Chain Total
| Metric | Positive 📈 | Negative 📉 | Neutral ➖ |
|---|---|---|---|
| Active Addresses | ✓ | ||
| Total Staked Value | ✓ | ||
| Derivatives | ✓ | ||
| Staking Inflows | ✓ |
- *The metrics and guidance provided in the table do not alone explain or imply any expectation regarding future price changes in any asset. Digital asset prices can fluctuate based on numerous variables. The on-chain analysis and related guidance are intended to assist investors in their decision-making process; however, basing financial investments solely on the results of this analysis may lead to unfavourable outcomes. Even if all metrics produce positive, negative, or neutral results simultaneously, the expected outcomes may not materialize depending on market conditions. Investors reviewing the report should take these warnings into consideration.
Legal Notice
The investment information, comments, and recommendations contained in this document do not constitute investment advisory services. Investment advisory services are provided by authorized institutions on a personalized basis, taking into account the risk and return preferences of individuals. The comments and recommendations contained in this document are of a general nature. These recommendations may not be suitable for your financial situation and risk and return preferences. Therefore, making an investment decision based solely on the information contained in this document may not result in outcomes that align with your expectations.
NOTE: All data used in Ethereum on-chain analysis is based on CryptoQuant.
