
Active Addresses
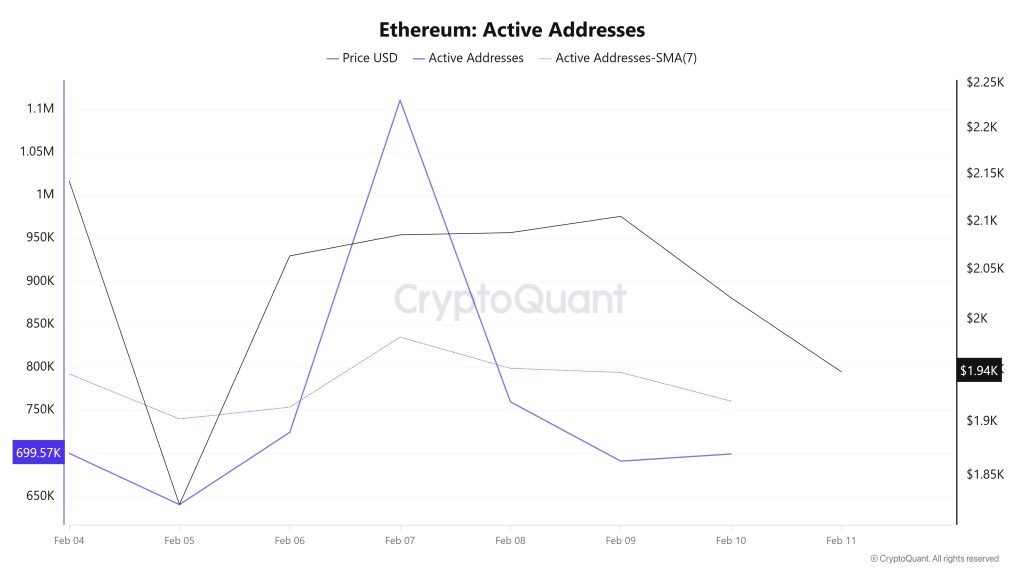
Between February 4 and February 11, a total of 1,110,779 active addresses were added to the Ethereum network. During this period, the Ethereum price retreated from $2,086 to $1,823. Notably, on February 5, when the price reached the active address point, the number of active addresses increased while a significant rise was also observed at the price point. When examining the 7-day simple moving average (SMA), it is seen that the Ethereum price is generally trending downward.
Active Sending Addresses
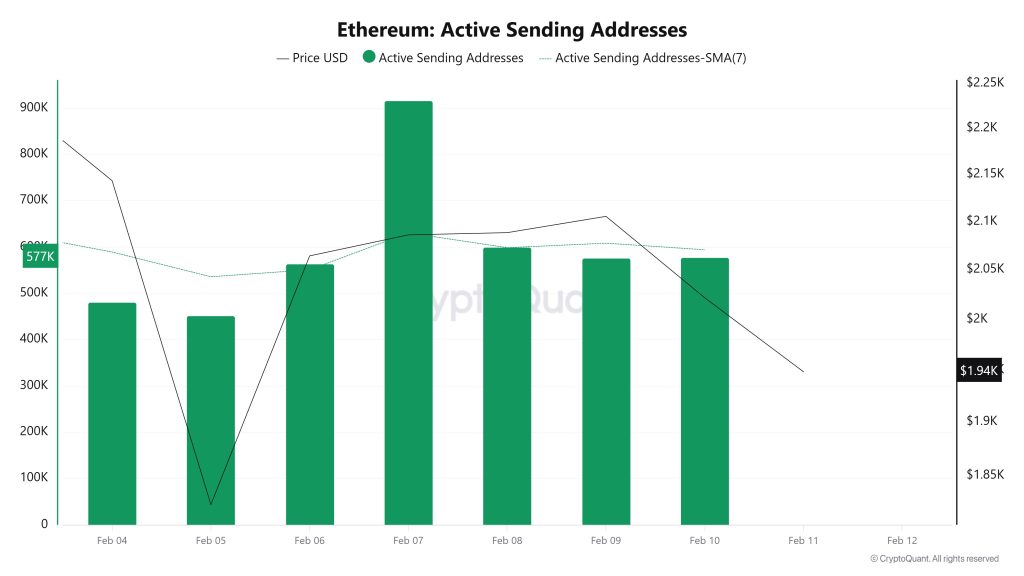
Between February 4 and February 11, high levels of active sending activity were observed in active sending addresses along with the Black Line (price line). On the day the price reached its highest level on a weekly basis, active sending addresses reached 915,156.
Active Receiving Addresses
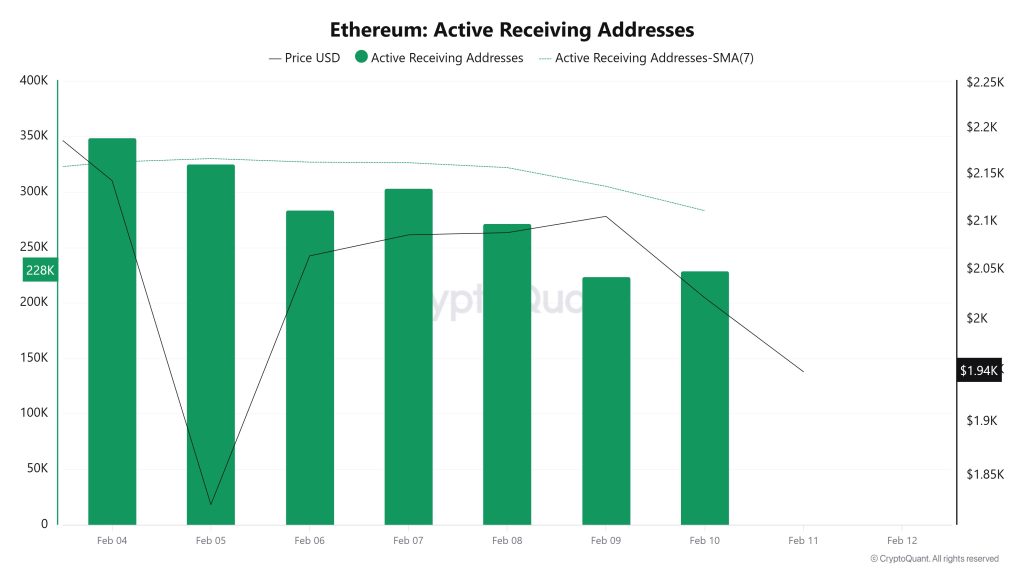
Between February 4 and February 11, while there was no significant increase in active receiving addresses, the price was seen to move upward. On the day the price reached its highest level, active receiving addresses reached 348,640, indicating an increase in sales.
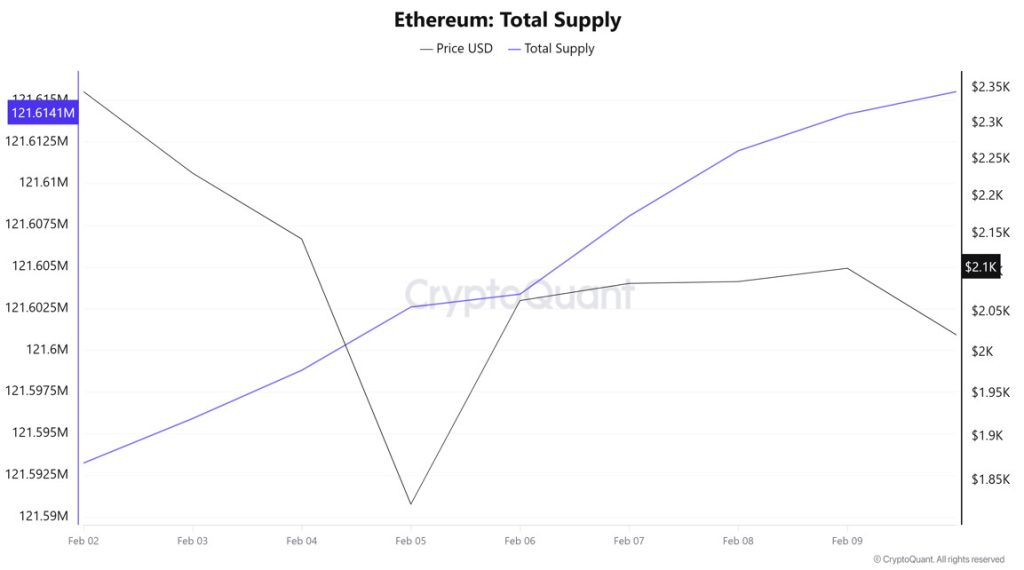
Total Value Staked
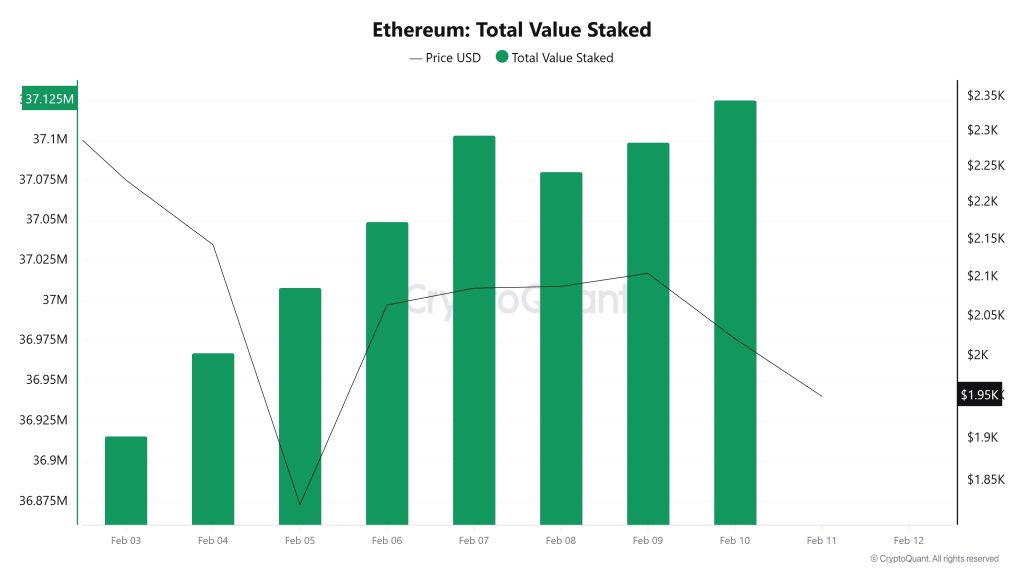
On February 4, while the ETH price was trading at $2,143, the Total Value Staked was at 36,967,533. As of February 10, the ETH price fell to $2,021, recording a 5.69% decline, while Total Value Staked rose to 37,125,201, recording a 0.43% increase. The increase in Total Value Staked indicates that despite the price pullback, the total amount locked in staking continues to grow and the tendency to maintain current stake positions persists. This divergence confirms that even as the price weakens in the short term, supply remains locked in the staking channel rather than being released. It may also indicate that as long as price pressure persists (we observed a similar scenario in recent weeks), staking-driven support alone may be insufficient to drive a recovery.
Staking Inflows
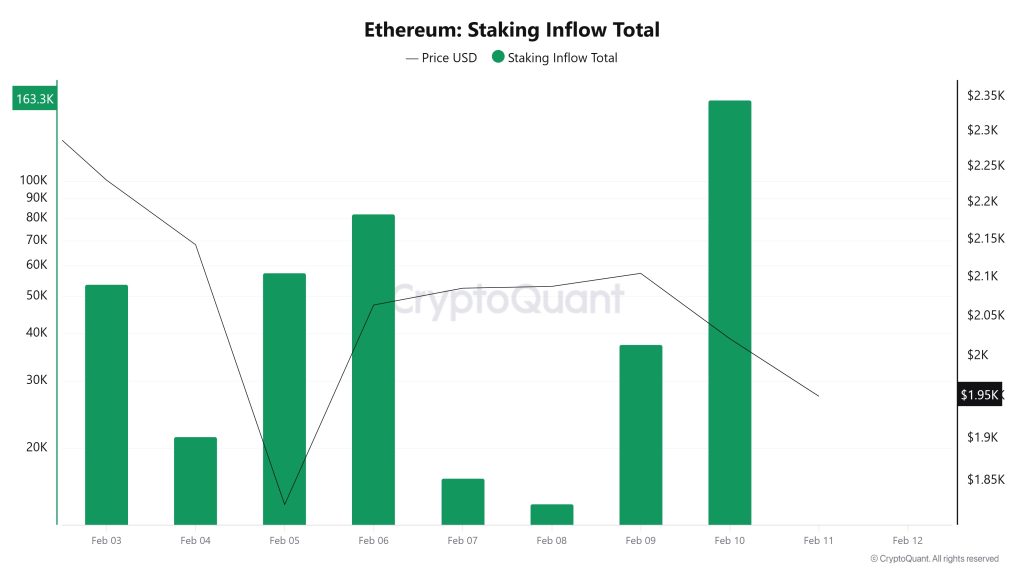
On February 4, when the ETH price was trading at $2,143, Staking Inflow was at 21,434. As of February 10, while the ETH price fell to $2,021, Staking Inflow rose to 163,310, recording a strong increase of 661.97%. The sharp rise in Staking Inflow indicates that new inflows into staking have accelerated significantly this week and that marginal staking demand has regained strength. However, the price remaining weak during the same period suggests that the recovery in staking inflows has produced a balancing factor that absorbs more supply in the short term, but may not be sufficient to be the sole determinant on the price side as long as risk appetite remains impaired.
Derivatives
Open Interest
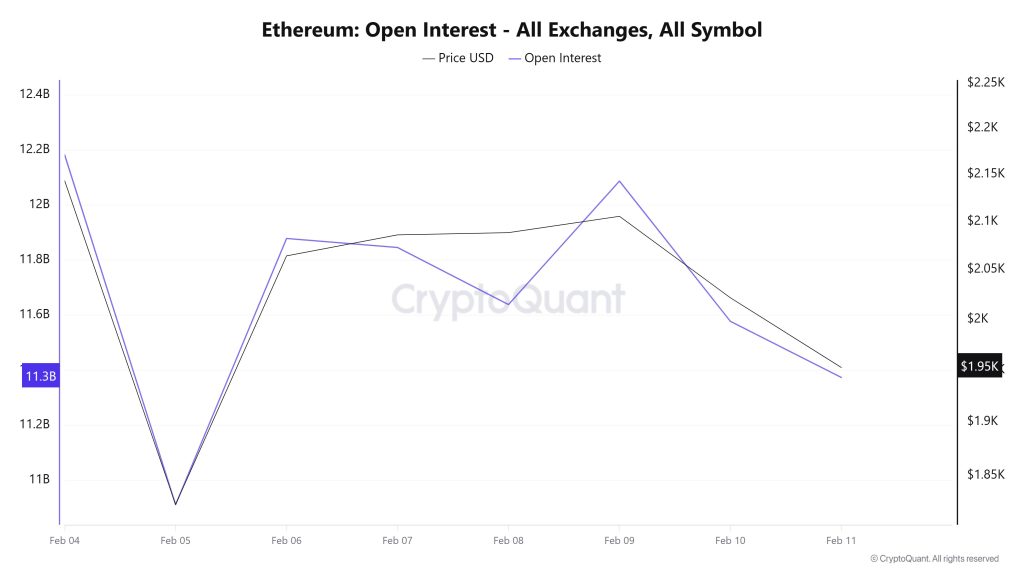
ETH open interest first fell sharply, then recovered, and subsequently declined gradually again. The initial rapid decline indicates that leveraged positions were closed, while the rise in the middle section signals new position entries. The slight pullback in recent days suggests that risk appetite in the market has become cautious again and that long accumulation has weakened.
Funding Rate
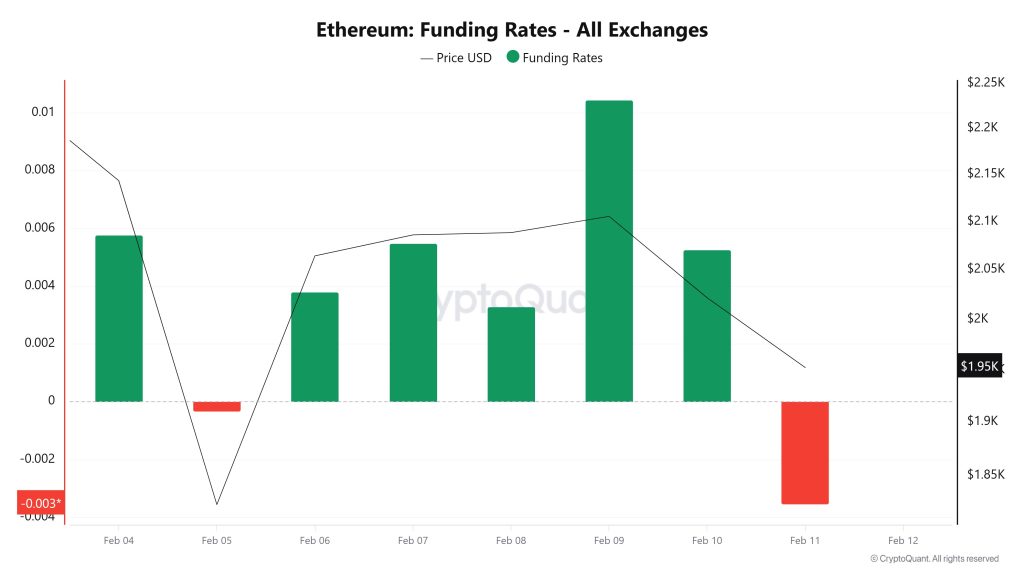
The chart shows that the funding rate has remained predominantly in positive territory, but has experienced fluctuations. While the initial short-term dip indicated short pressure, its immediate return to strong positive territory signals that the market is once again long-dominated. The gradual decline in funding in recent days, however, suggests that enthusiasm has waned and appetite for leveraged longs has cooled.
Long & Short Liquidations
Last week, as the ETH price fell sharply to $1,747, a total of approximately $763 million in long positions were liquidated. During the same period, nearly $619 million in long positions were also liquidated.
| Metric | Positive 📈 | Negative 📉 | Neutral ➖ |
|---|---|---|---|
| Active Addresses | ✓ | ||
| Breakdowns | ✓ | ||
| Derivatives | ✓ | ||
| Supply Distribution | ✓ | ||
| Exchange Supply Ratio | ✓ | ||
| Exchange Reserve | ✓ | ||
| Fees and Revenues | ✓ | ||
| Miner Flows | ✓ | ||
| Transaction | ✓ | ||
| Whale Activity | ✓ |
Supply Distribution
Total Supply: Reached 121,614,176 units, an increase of approximately 0.0315% compared to last week.
New Supply: The amount of ETH produced this week was 59,193.
Velocity: The velocity, which was 9.99 last week, reached 10.09 as of February 9.
| Wallet Category | 02.02.2025 | 02/09/2025 | Change (%) |
|---|---|---|---|
| 100 – 1k ETH | 8.2862M | 8.6432M | 4.31% |
| 1k – 10k ETH | 12.2396M | 12.9716M | 5.98% |
| 10k – 100k ETH | 19.8867M | 21.2658M | 6.94% |
| 100k+ ETH | 3.9161M | 4.0585M | 3.64% |
There is an increase in all upper segments. This is not risk reduction; it indicates simultaneous accumulation in medium and large wallets.
Exchange Supply Ratio
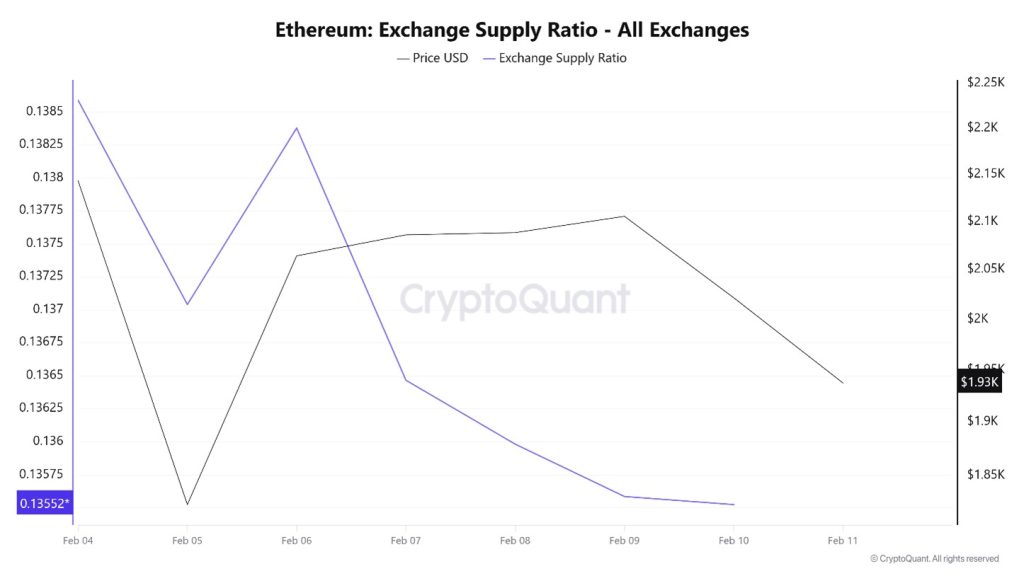
According to Ethereum Exchange Supply Ratio data, a significant decline in the supply ratio of Ethereum held on exchanges was observed during the period under review. This week, there is a positive correlation between the Ethereum price and the supply ratio on exchanges. The decline in the Exchange Supply Ratio indicates that Ethereum is being withdrawn from exchanges and held in cold wallets, suggesting that there is no intense selling pressure in the short term. Between February 4 and February 11, the Ethereum Exchange Supply Ratio declined from 0.13859082 to 0.13558601. During the same period, the Ethereum price retreated from $2.143 to the $2.105 range.
The fact that both the Ethereum price and the Exchange Supply Ratio moved downwards in the same direction during this period indicates that risk appetite in the market has weakened and that new Ethereum inflows to exchanges have been limited. The Exchange Supply Ratio maintaining its downward trend shows that the price pullback is due to weak demand and cautious investor sentiment rather than panic selling.
Exchange Reserve
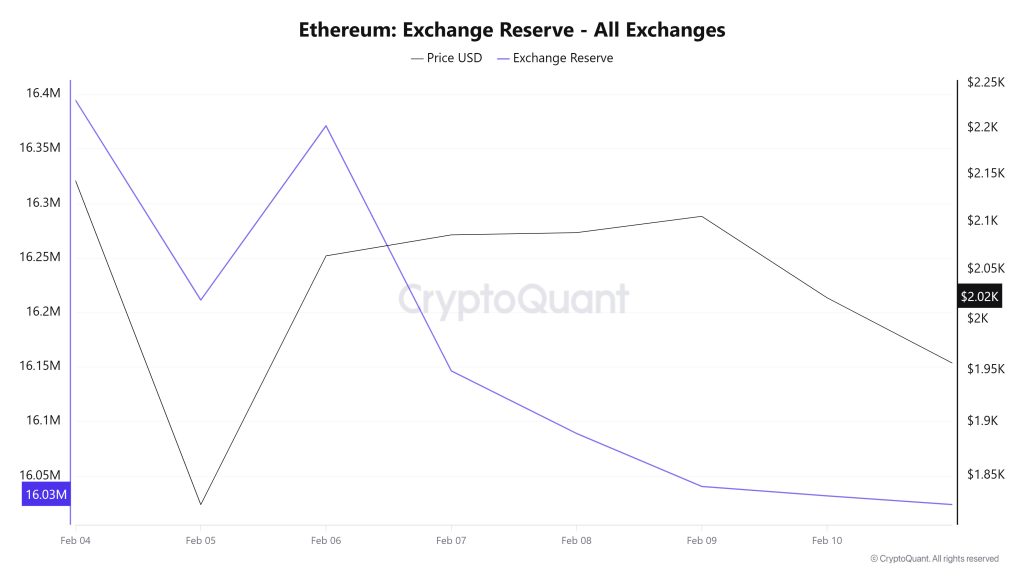
Between February 4 and 10, 2026, Ethereum reserves on exchanges declined from 16,336,551 ETH to 16,032,021 ETH, resulting in a net outflow of 304,530 ETH. During this period, exchange reserves decreased by approximately 1.86%, while the ETH price fell from $2,230 to $2,022, losing 9.36% of its value. The sharp drop in price to $1,823 on February 5 was particularly notable during this period. However, despite this decline, the strong net outflow from reserves indicated that investors viewed the drop as a buying opportunity rather than a reason to sell. Indeed, the significant net outflows observed on February 5 and 7 signaled that the ETH purchased was being withdrawn from exchanges and that the accumulation trend was strengthening. The price quickly rebounded above $2,000, showing that these purchases found a market. Volatility may continue in the short term, but the buying trend could stabilize the price.
| Date | 04-Feb | 05-Feb | 06-Feb | 07-Feb | 08-Feb | February 9 | February 10 |
|---|---|---|---|---|---|---|---|
| Exchange Inflow | 1,569,782 | 2,110,123 | 2,328,720 | 941,342 | 622,522 | 1,272,143 | 1,325,046 |
| Exchange Outflow | 1,511,575 | 2,293,338 | 2,168,939 | 1,166,047 | 679,879 | 1,320,771 | 1,333,659 |
| Exchange Netflow | 58,207 | -183,214 | 159,781 | -224,704 | -57,357 | -48,629 | -8,613 |
| Exchange Reserve | 16,336,551 | 16,211,544 | 16,371,325 | 16,146,620 | 16,089,263 | 16,040,634 | 16,032,021 |
| ETH Price | 2,230 | 1,823 | 2,064 | 2,086 | 2,088 | 2,106 | 2,022 |
Fees and Revenues
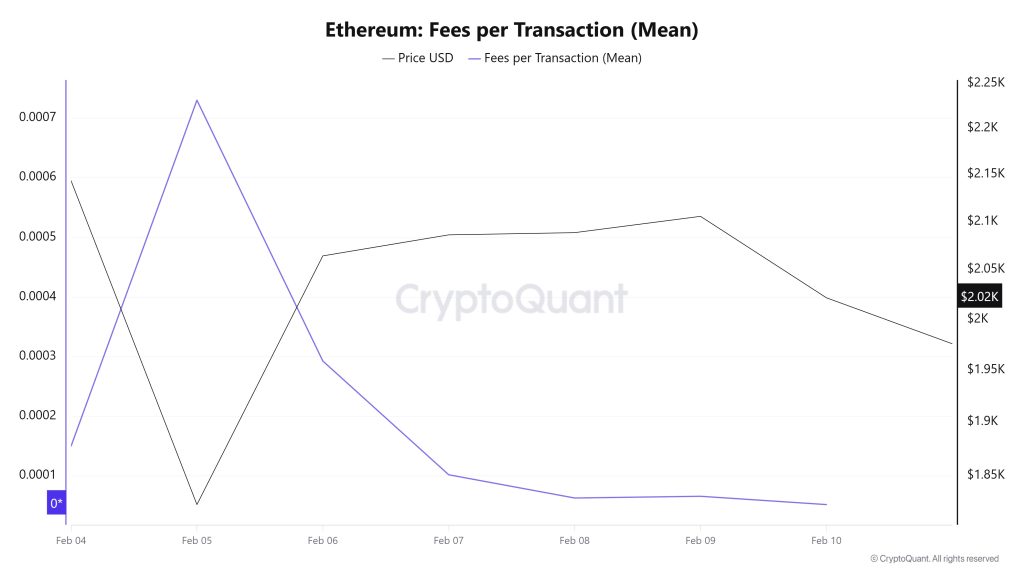
When examining the Ethereum Fees per Transaction (Mean) data between February 4 and 10, it is seen that on February 4, the first day of the week, the indicator reached 0.000149924942568988.
A decline was observed until February 8, when the indicator recorded a value of 0.000063007407454603.
On February 10, the last day of the weekly period, the indicator closed the week at 0.000051967668709517.
Ethereum: Fees (Total)
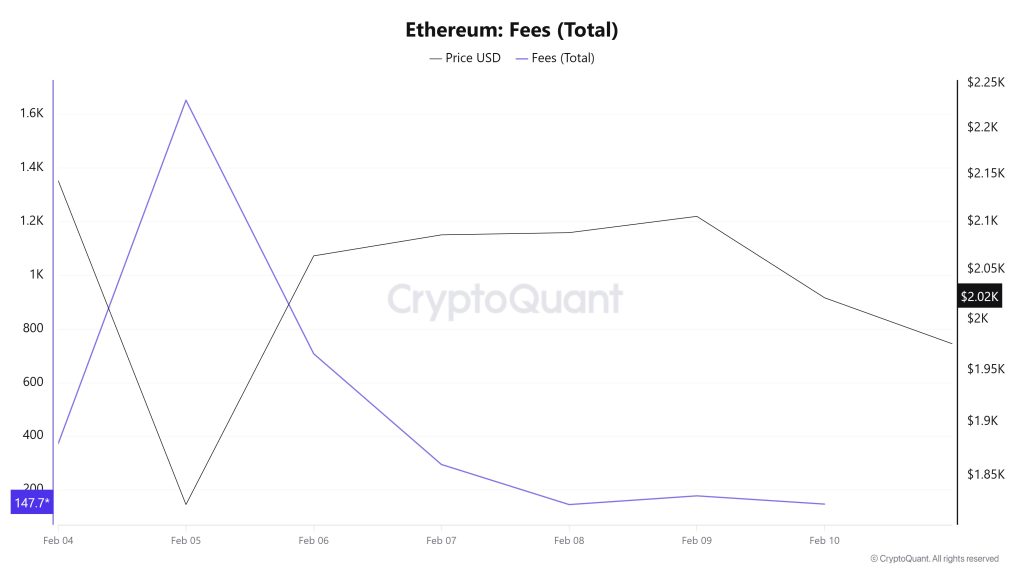
Similarly, when examining the Ethereum Fees (Total) data between February 4 and 10, it can be seen that on February 4, the first day of the week, the indicator stood at 373.24399159825487.
A decline was observed until February 8, when the indicator recorded a value of 145.9899902871321.
On February 10, the last day of the weekly period, the indicator closed the week at 147.77796506115507.
Blocks Mined
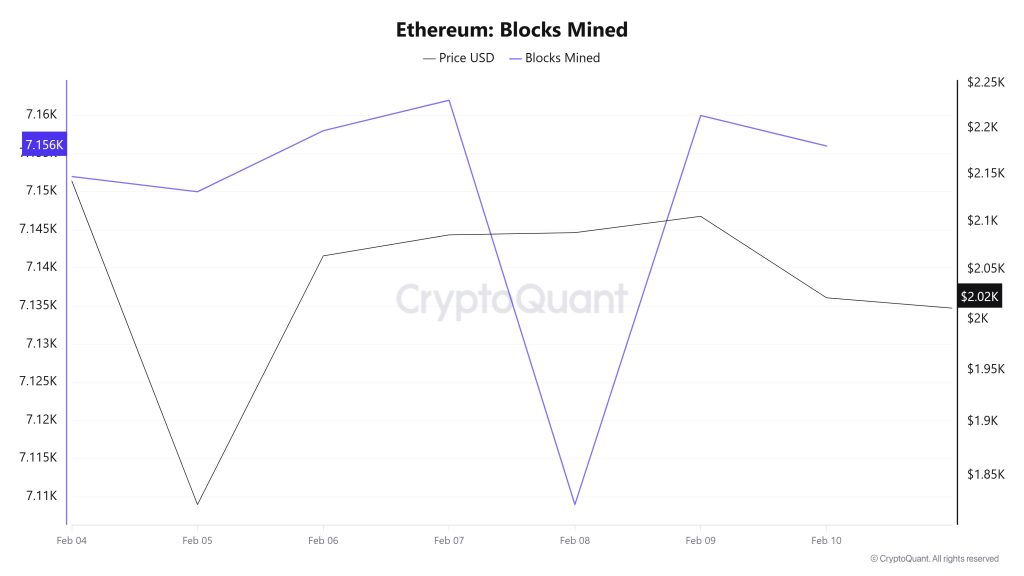
When examining Ethereum block production data between February 4 and 10, an increase was observed throughout the week. While 7,152 blocks were produced on February 4, this number rose to 7,156 by February 10.
During the period in question, a time-dependent correlation structure was observed between the Ethereum price and the number of blocks produced. However, the general trend shows that a positive correlation between these two variables is dominant.
Block Size
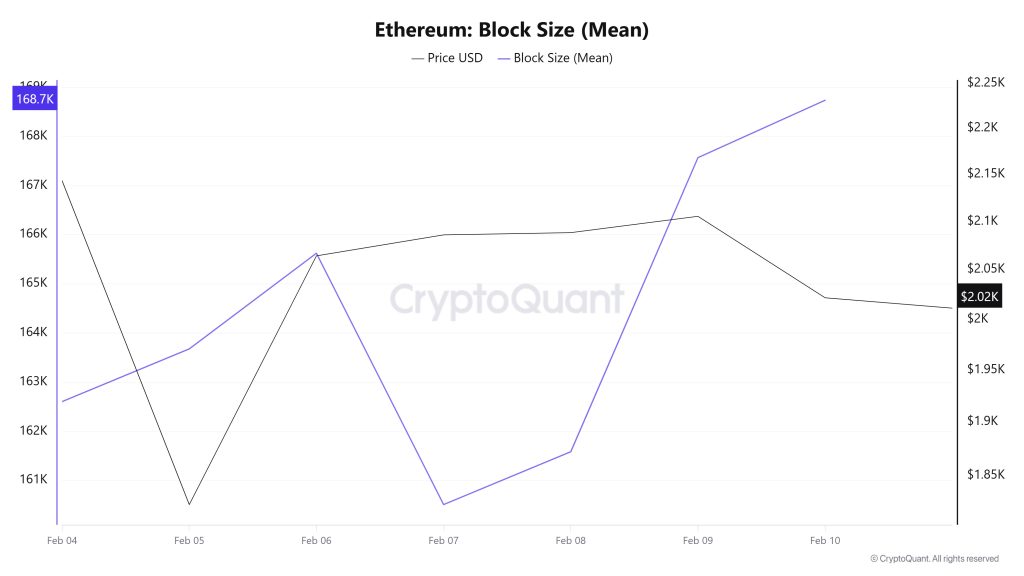
When examining the Ethereum block size data between February 4 and 10, a slight increase was observed throughout the week. While the average block size was measured at 162,606 bytes on February 4, this value rose to 168,740 bytes as of February 10.
During the relevant period, a time-dependent correlation structure was observed between block size and Ethereum price. However, the general trend reveals that a negative correlation between these two variables is dominant.
Block Interval
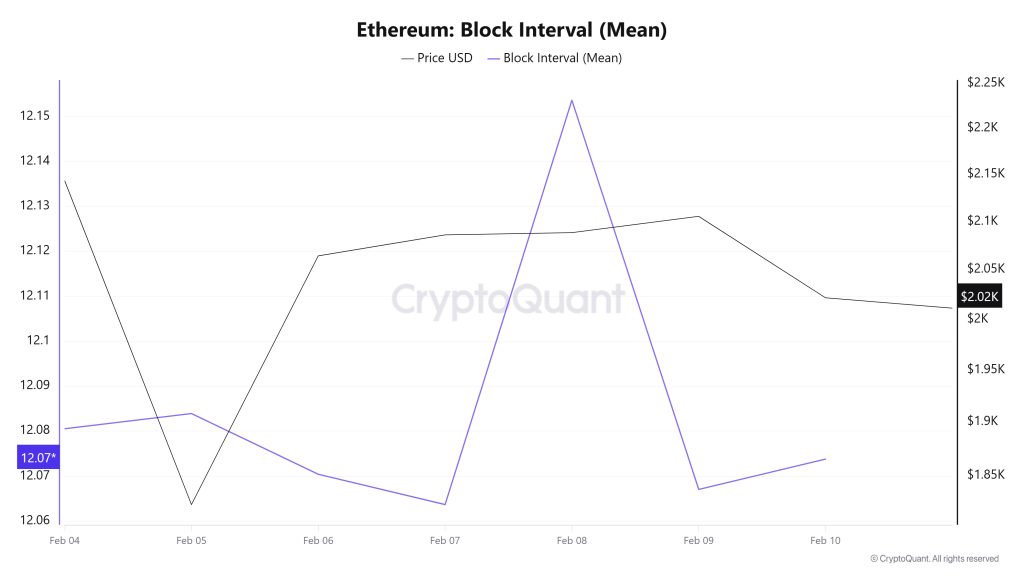
When examining the Ethereum block time between February 4 and 10, a slight decrease was observed throughout the week. While the average block time was recorded as 12.08 seconds on February 4, this time decreased to 12.07 seconds as of February 10.
During this period, a time-dependent correlation structure was observed between the Ethereum block time and price movement. However, the general trend indicates that a negative correlation between these two variables is dominant.
Transaction
![]()
While 19,657,910 transactions were executed on the Ethereum network in the previous period, the number of transactions decreased by approximately 9% this week to 17,937,870. The highest daily transaction volume for the period was recorded on February 7 at 2,896,853, while the lowest transaction volume was recorded on January 5 at 2,263,319.
When examining the correlation between transaction volume and price, it is positive, second. Although the acceleration in network activity compared to the previous period indicates that transaction volume momentum is recovering on the Ethereum side, the lack of a significant difference in transfer volume between days within the period suggests that there has been no noteworthy event on the DeFi side so far.
Tokens Transferred
The total amount of ETH transferred last week was 19,767,014 ETH, while this week the figure rose to 21,628,740 ETH, recording an increase of approximately 9.4%. The highest transfer volume during the period occurred on February 6 at 5,204,035 ETH, while the lowest transfer volume occurred on February 8 at 1,170,630 ETH.
While the relationship between price and the amount of tokens transferred was predominantly negative, the downward movement of the price throughout the period suggests that Ethereum assets in wallets were largely moved on the network for sale purposes.
The fluctuation in daily transfer volume, reaching up to 200%, when evaluated alongside the sharp increase in the average amount of Ethereum per transaction despite the increase in the number of transactions, indicates that the price fluctuation range on the network has widened significantly. This outlook signals a short-term volatile price structure for Ethereum. While there appears to be more large-scale players active compared to the previous period, this presents a positive picture in terms of network health but requires a cautious approach in terms of pricing dynamics. Although the chain is live and active and the number of users is high, it is seen that the capital moving on the network during the period was largely sales-oriented. This situation indicates that pricing remains weak compared to user activity. There is a crowd, there is movement, but the corresponding impact on pricing has not yet materialized.
Estimated Leverage Ratio
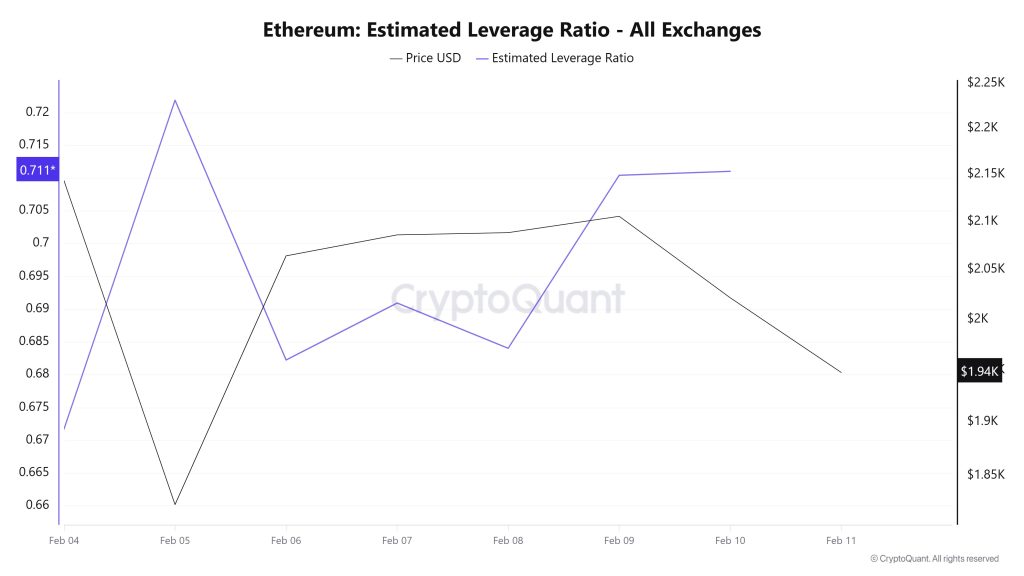
The metric followed a horizontal trend throughout the 7-day period. On February 4, the first day of the period, the metric stood at 0.671. It rose from this level, reaching its peak on February 5 at 0.721. The metric has remained flat for the remainder of the process and currently stands at 0.711. A higher ELR indicates that participants are more willing to take on risk and generally signals bullish conditions or expectations. Uptrends can also be driven by a decrease in reserves. Looking at Ethereum reserves, there were 16.39 million reserves at the beginning of the process, but this figure declined during the rest of the process and has now fallen to 16.01 million. At the same time, Ethereum’s Open Interest was seen at $26.30 billion at the beginning of the process. As of now, volume has declined during the process, and open interest has fallen to $24.11 billion. With all this data, the ELR metric has remained flat for most of the process. The asset’s price has fluctuated between $2,200 and $1,750 with all this data. Ultimately, the decline in open interest volume and reserves throughout the process explains the flat trend in the ELR metric. This indicates that investor risk appetite has increased slightly but has not fully recovered from the decision-making phase.
ETH Onchain Overall
| Metric | Positive 📈 | Negative 📉 | Neutral ➖ |
|---|---|---|---|
| Active Addresses | ✓ | ||
| Total Value Staked | ✓ | ||
| Derivatives | ✓ | ||
| Supply Distribution | ✓ | ||
| Exchange Supply Ratio | ✓ | ||
| Exchange Reserve | ✓ | ||
| Fees and Revenues | ✓ | ||
| Blocks Mined | ✓ | ||
| Transaction | ✓ | ||
| Estimated Leverage Ratio | ✓ |
*The metrics and guidance provided in the table do not alone explain or imply any expectation regarding future price changes in any asset. Digital asset prices can fluctuate based on numerous variables. The on-chain analysis and related guidance are intended to assist investors in their decision-making process, and basing financial investments solely on the results of this analysis may lead to unfavorable outcomes. Even if all metrics produce positive, negative, or neutral results simultaneously, the expected outcomes may not materialize depending on market conditions. It would be beneficial for investors reviewing the report to take these warnings into consideration.
LEGAL NOTICE
The investment information, comments, and recommendations contained in this document do not constitute investment advisory services. Investment advisory services are provided by authorized institutions on a personal basis, taking into account the risk and return preferences of individuals. The comments and recommendations contained in this document are of a general nature. These recommendations may not be suitable for your financial situation and risk and return preferences. Therefore, making an investment decision based solely on the information contained in this document may not result in outcomes that align with your expectations.
NOTE: All data used in Ethereum on-chain analysis is based on CryptoQuant.
