
Active Addresses
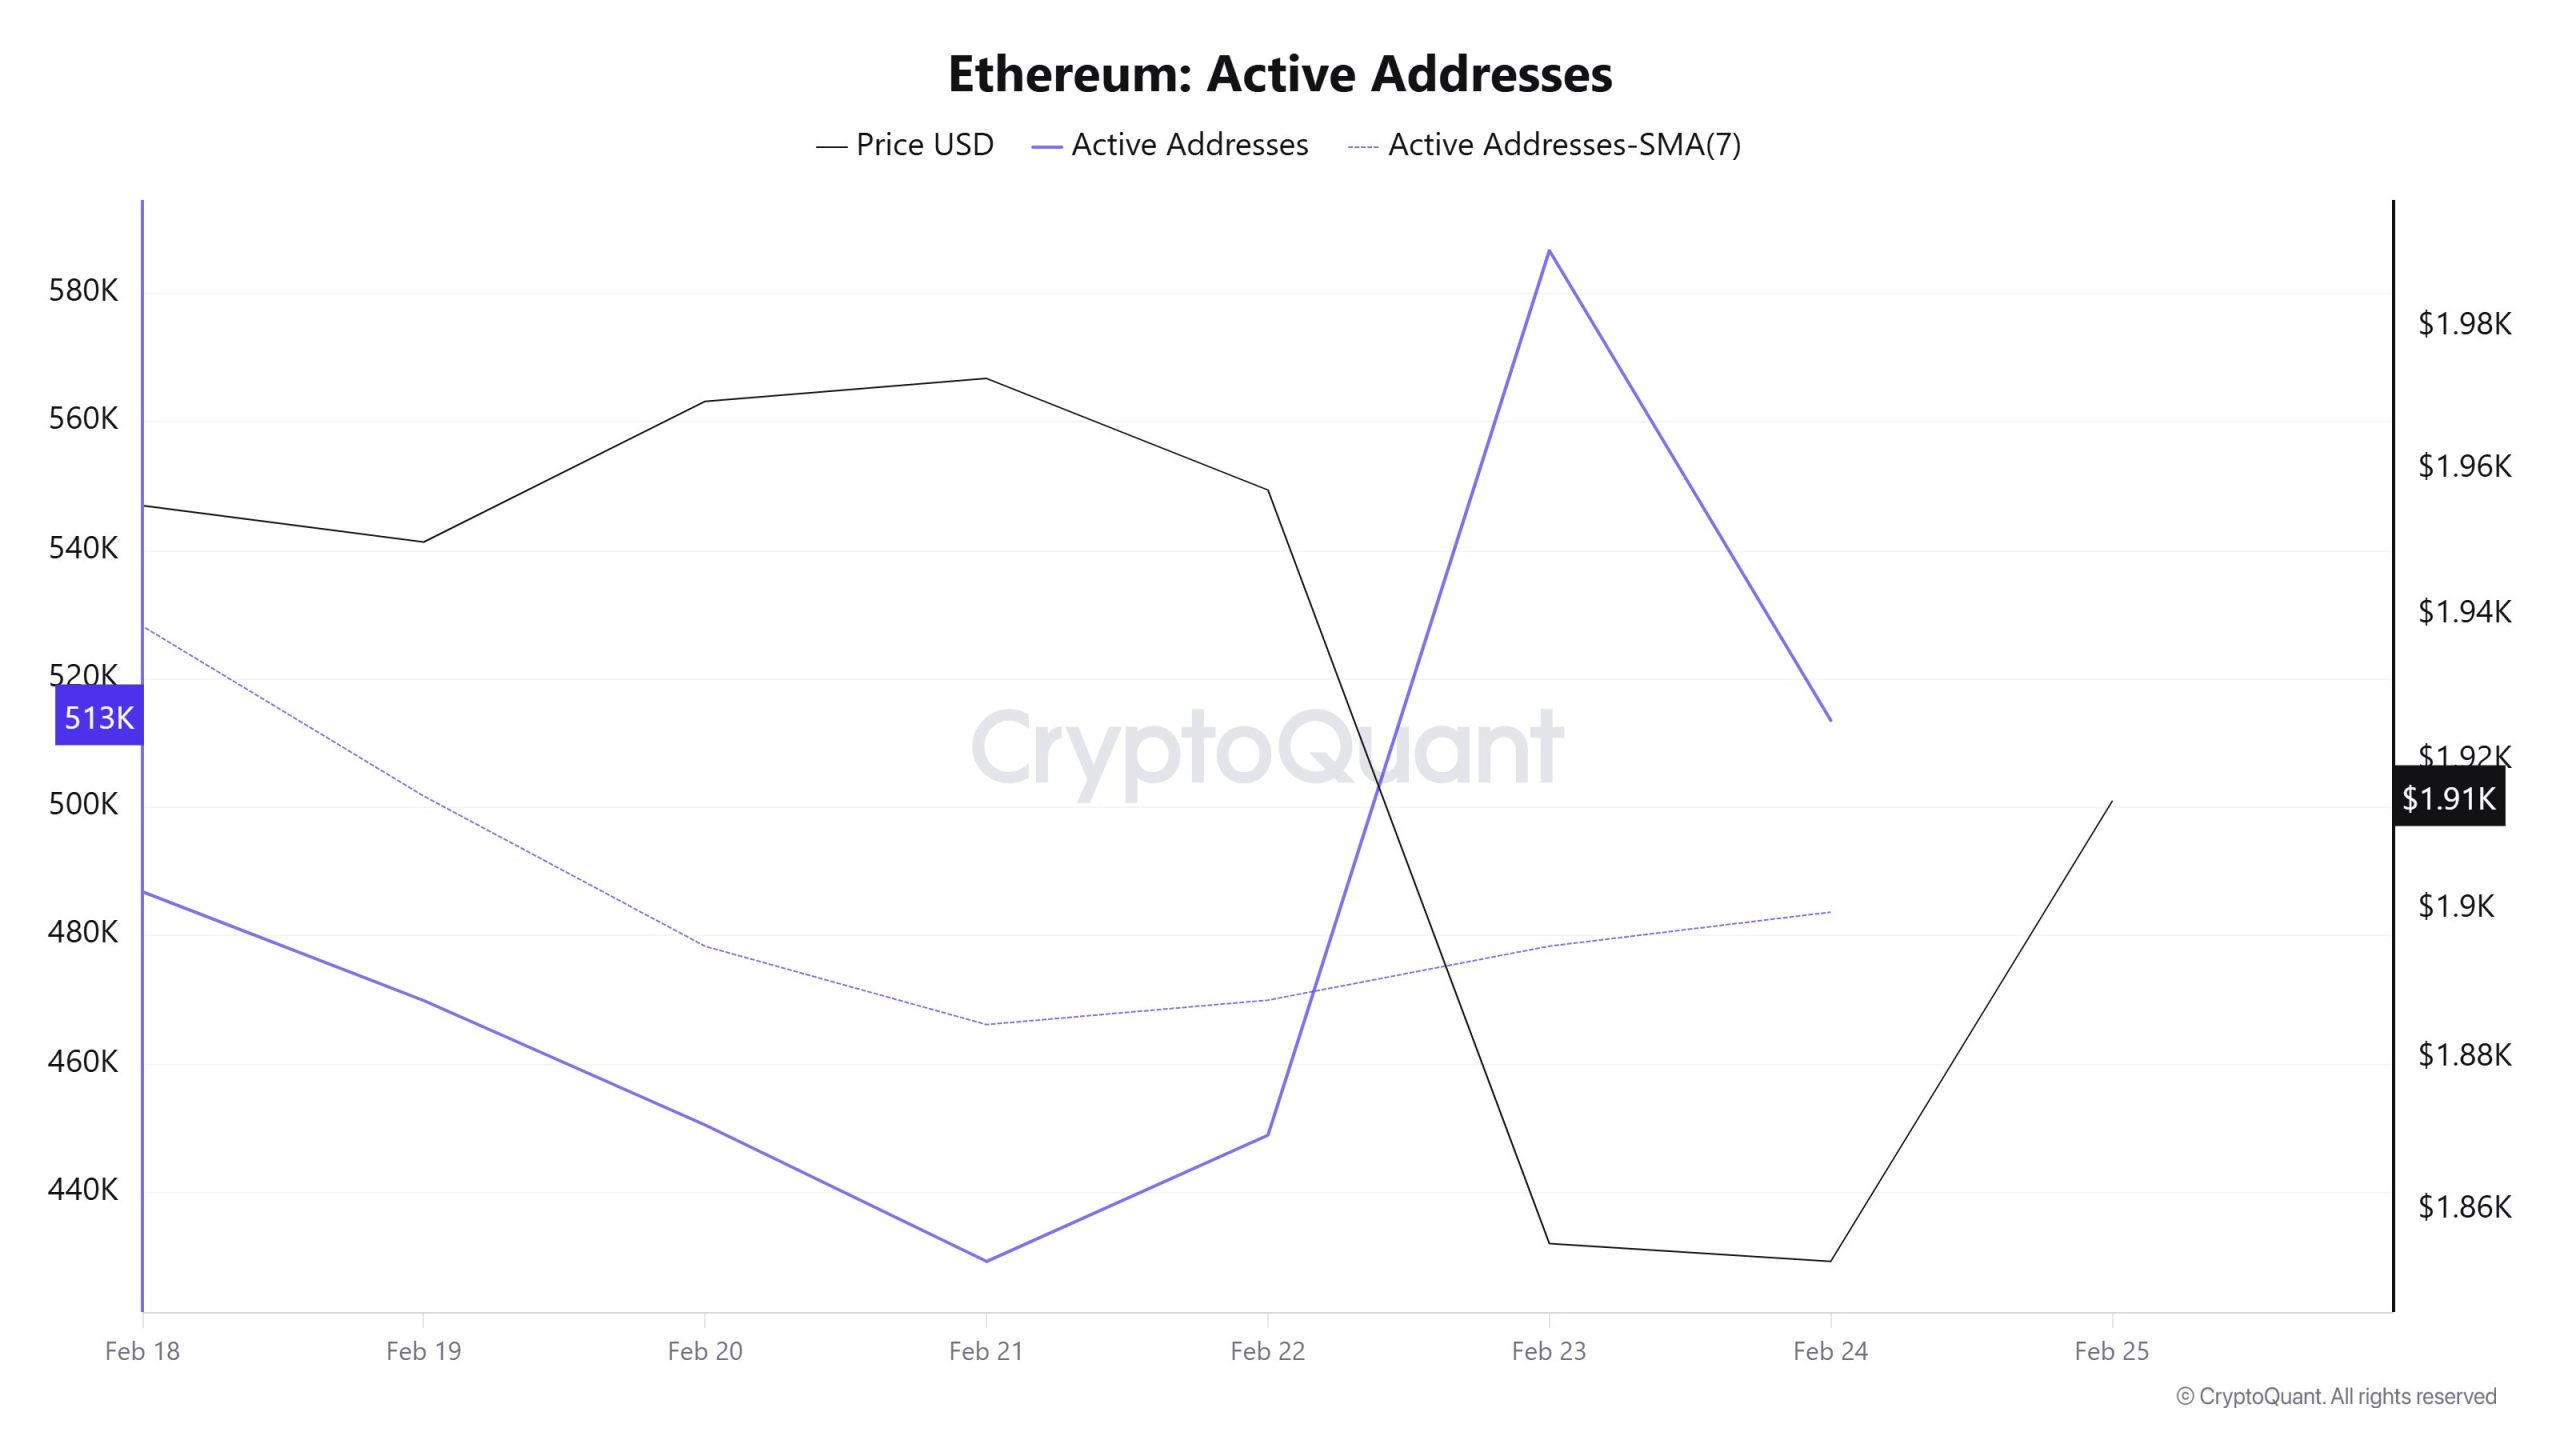
Between February 18 and February 24, there were a total of 3,385,819 active address entries on the Ethereum network. During this period, the Ethereum price fell from $2,000 to $1,800. A significant drop in the price curve was observed on February 23, when the number of active addresses peaked. When examining the 7-day simple moving average (SMA), it can be seen that the Ethereum price has been steadily declining.
Active Sending Addresses
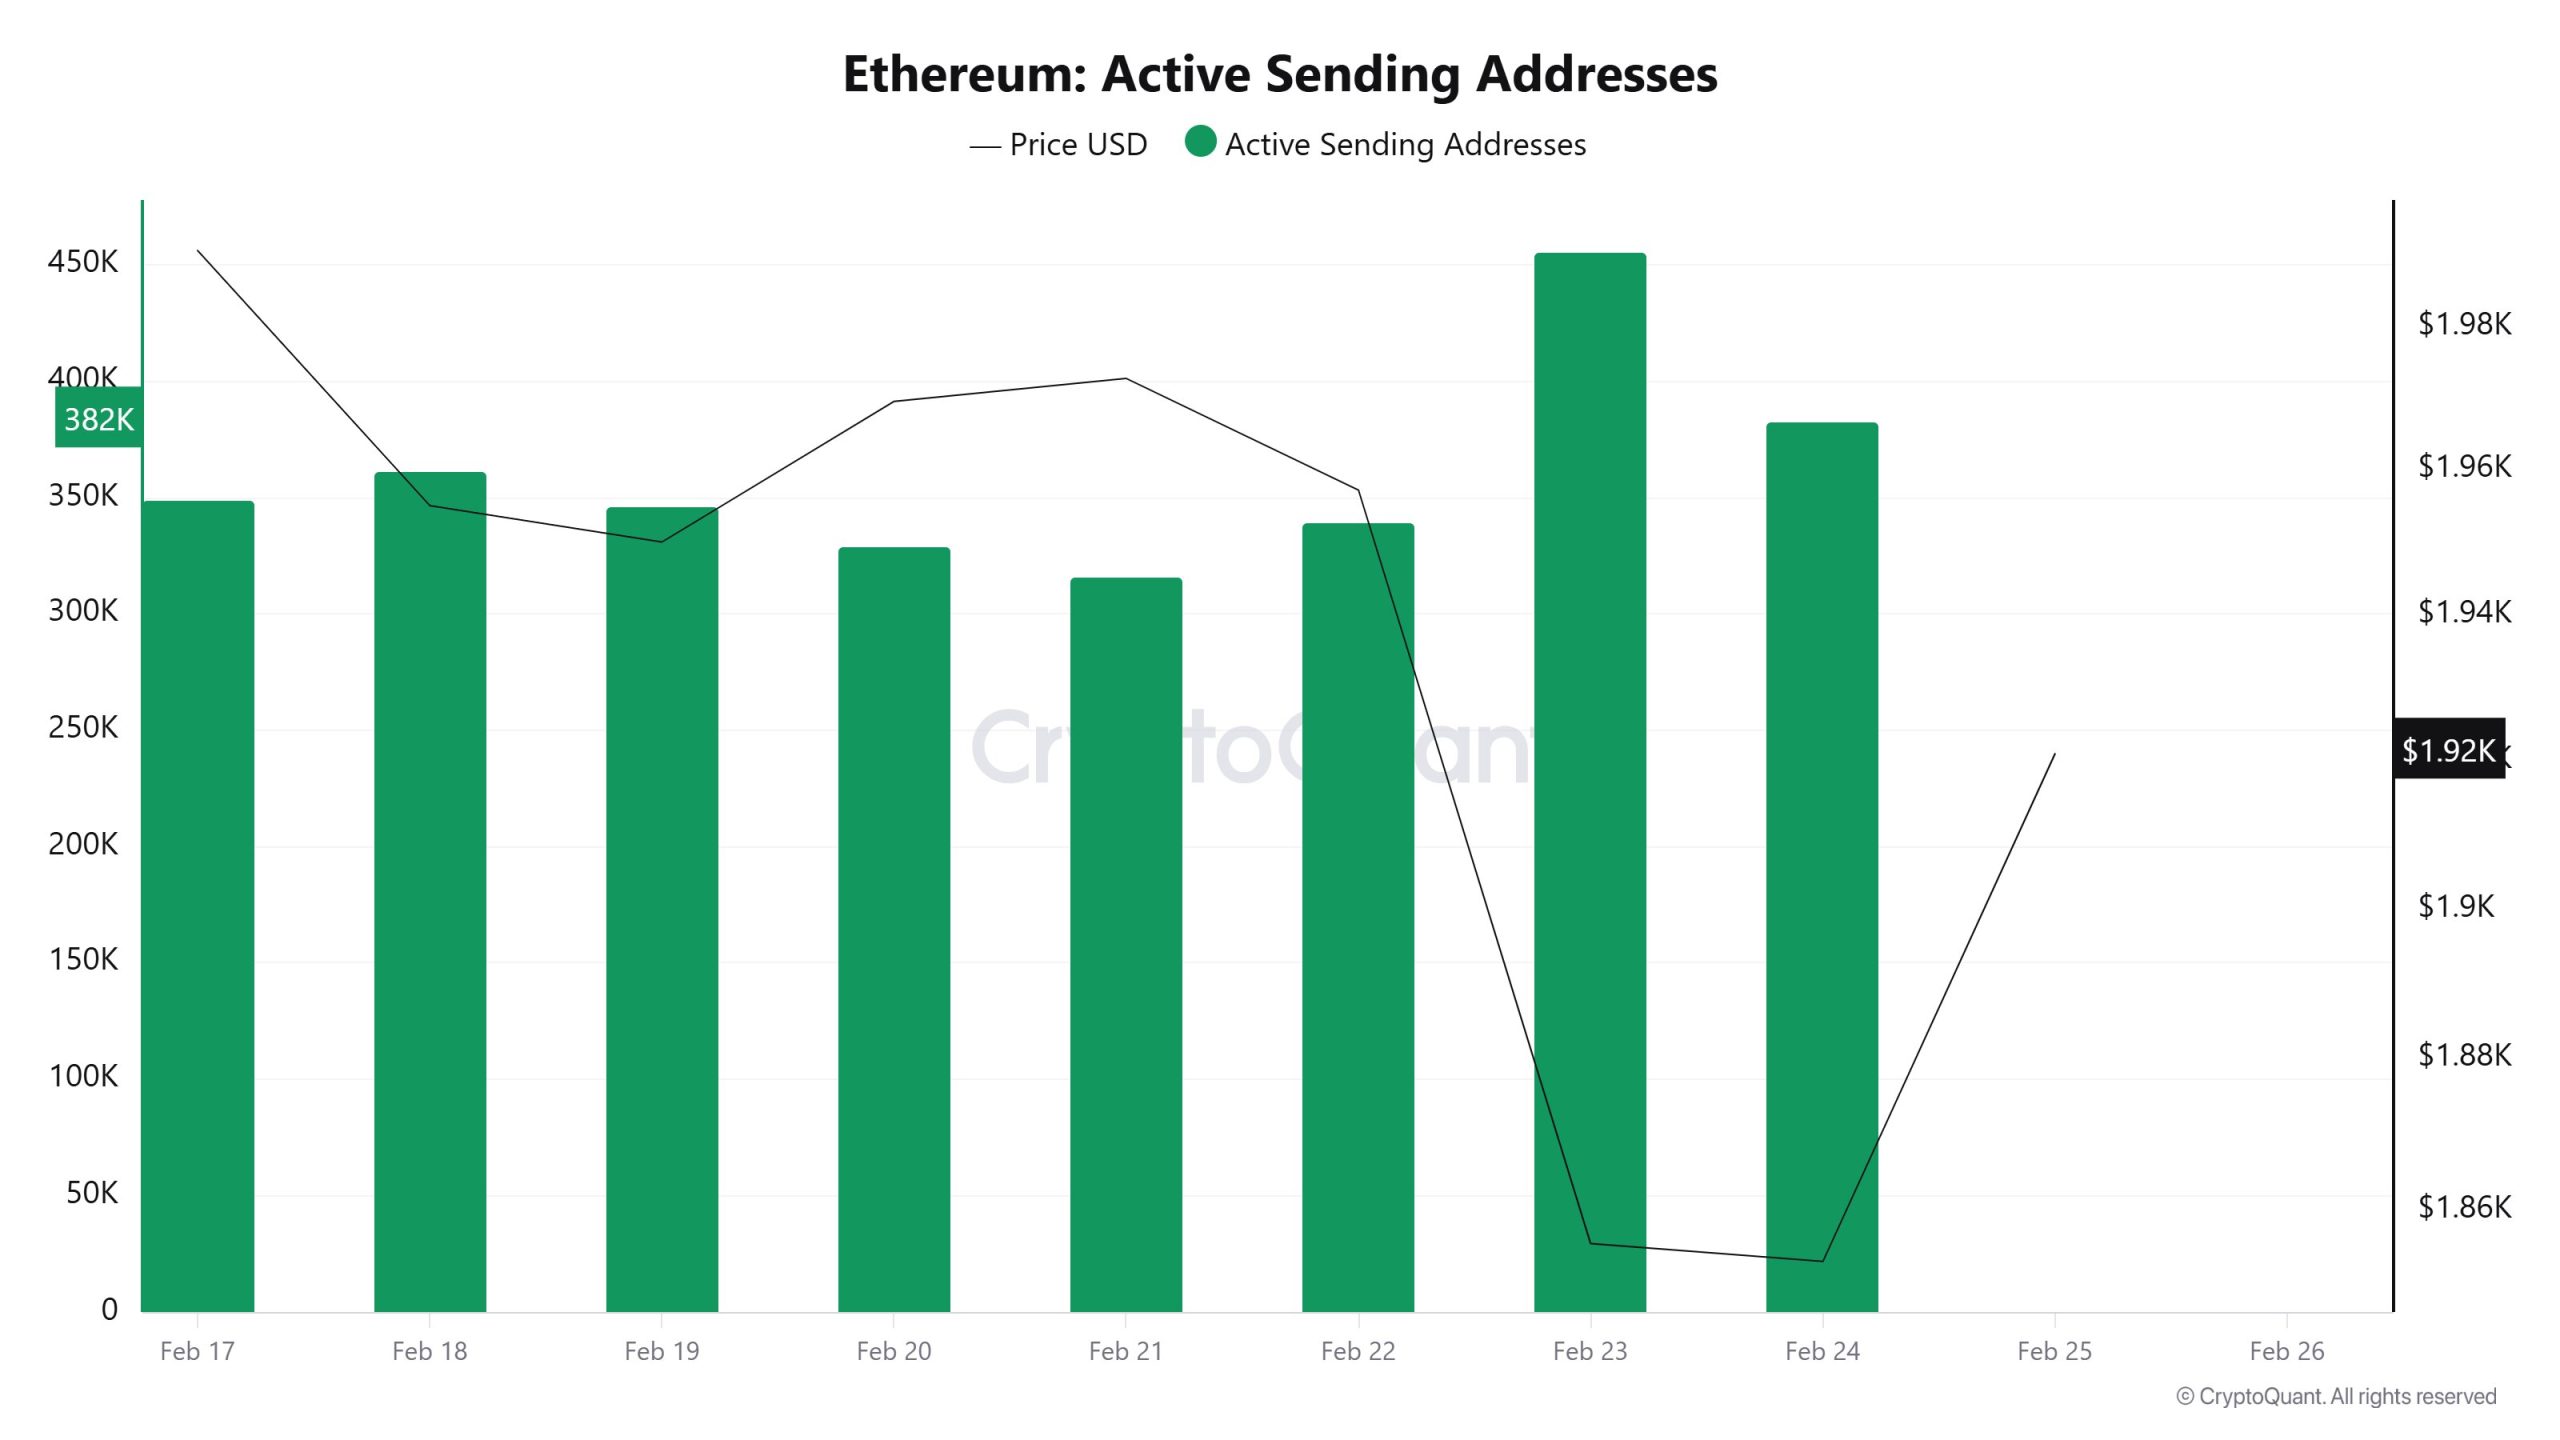
Between February 18 and February 25, high levels of active sending activity were observed in active sending addresses, as indicated by the Black Line (price line). On the day the price approached its lowest level on a weekly basis, active sending addresses reached 455,268.
Active Receiving Addresses
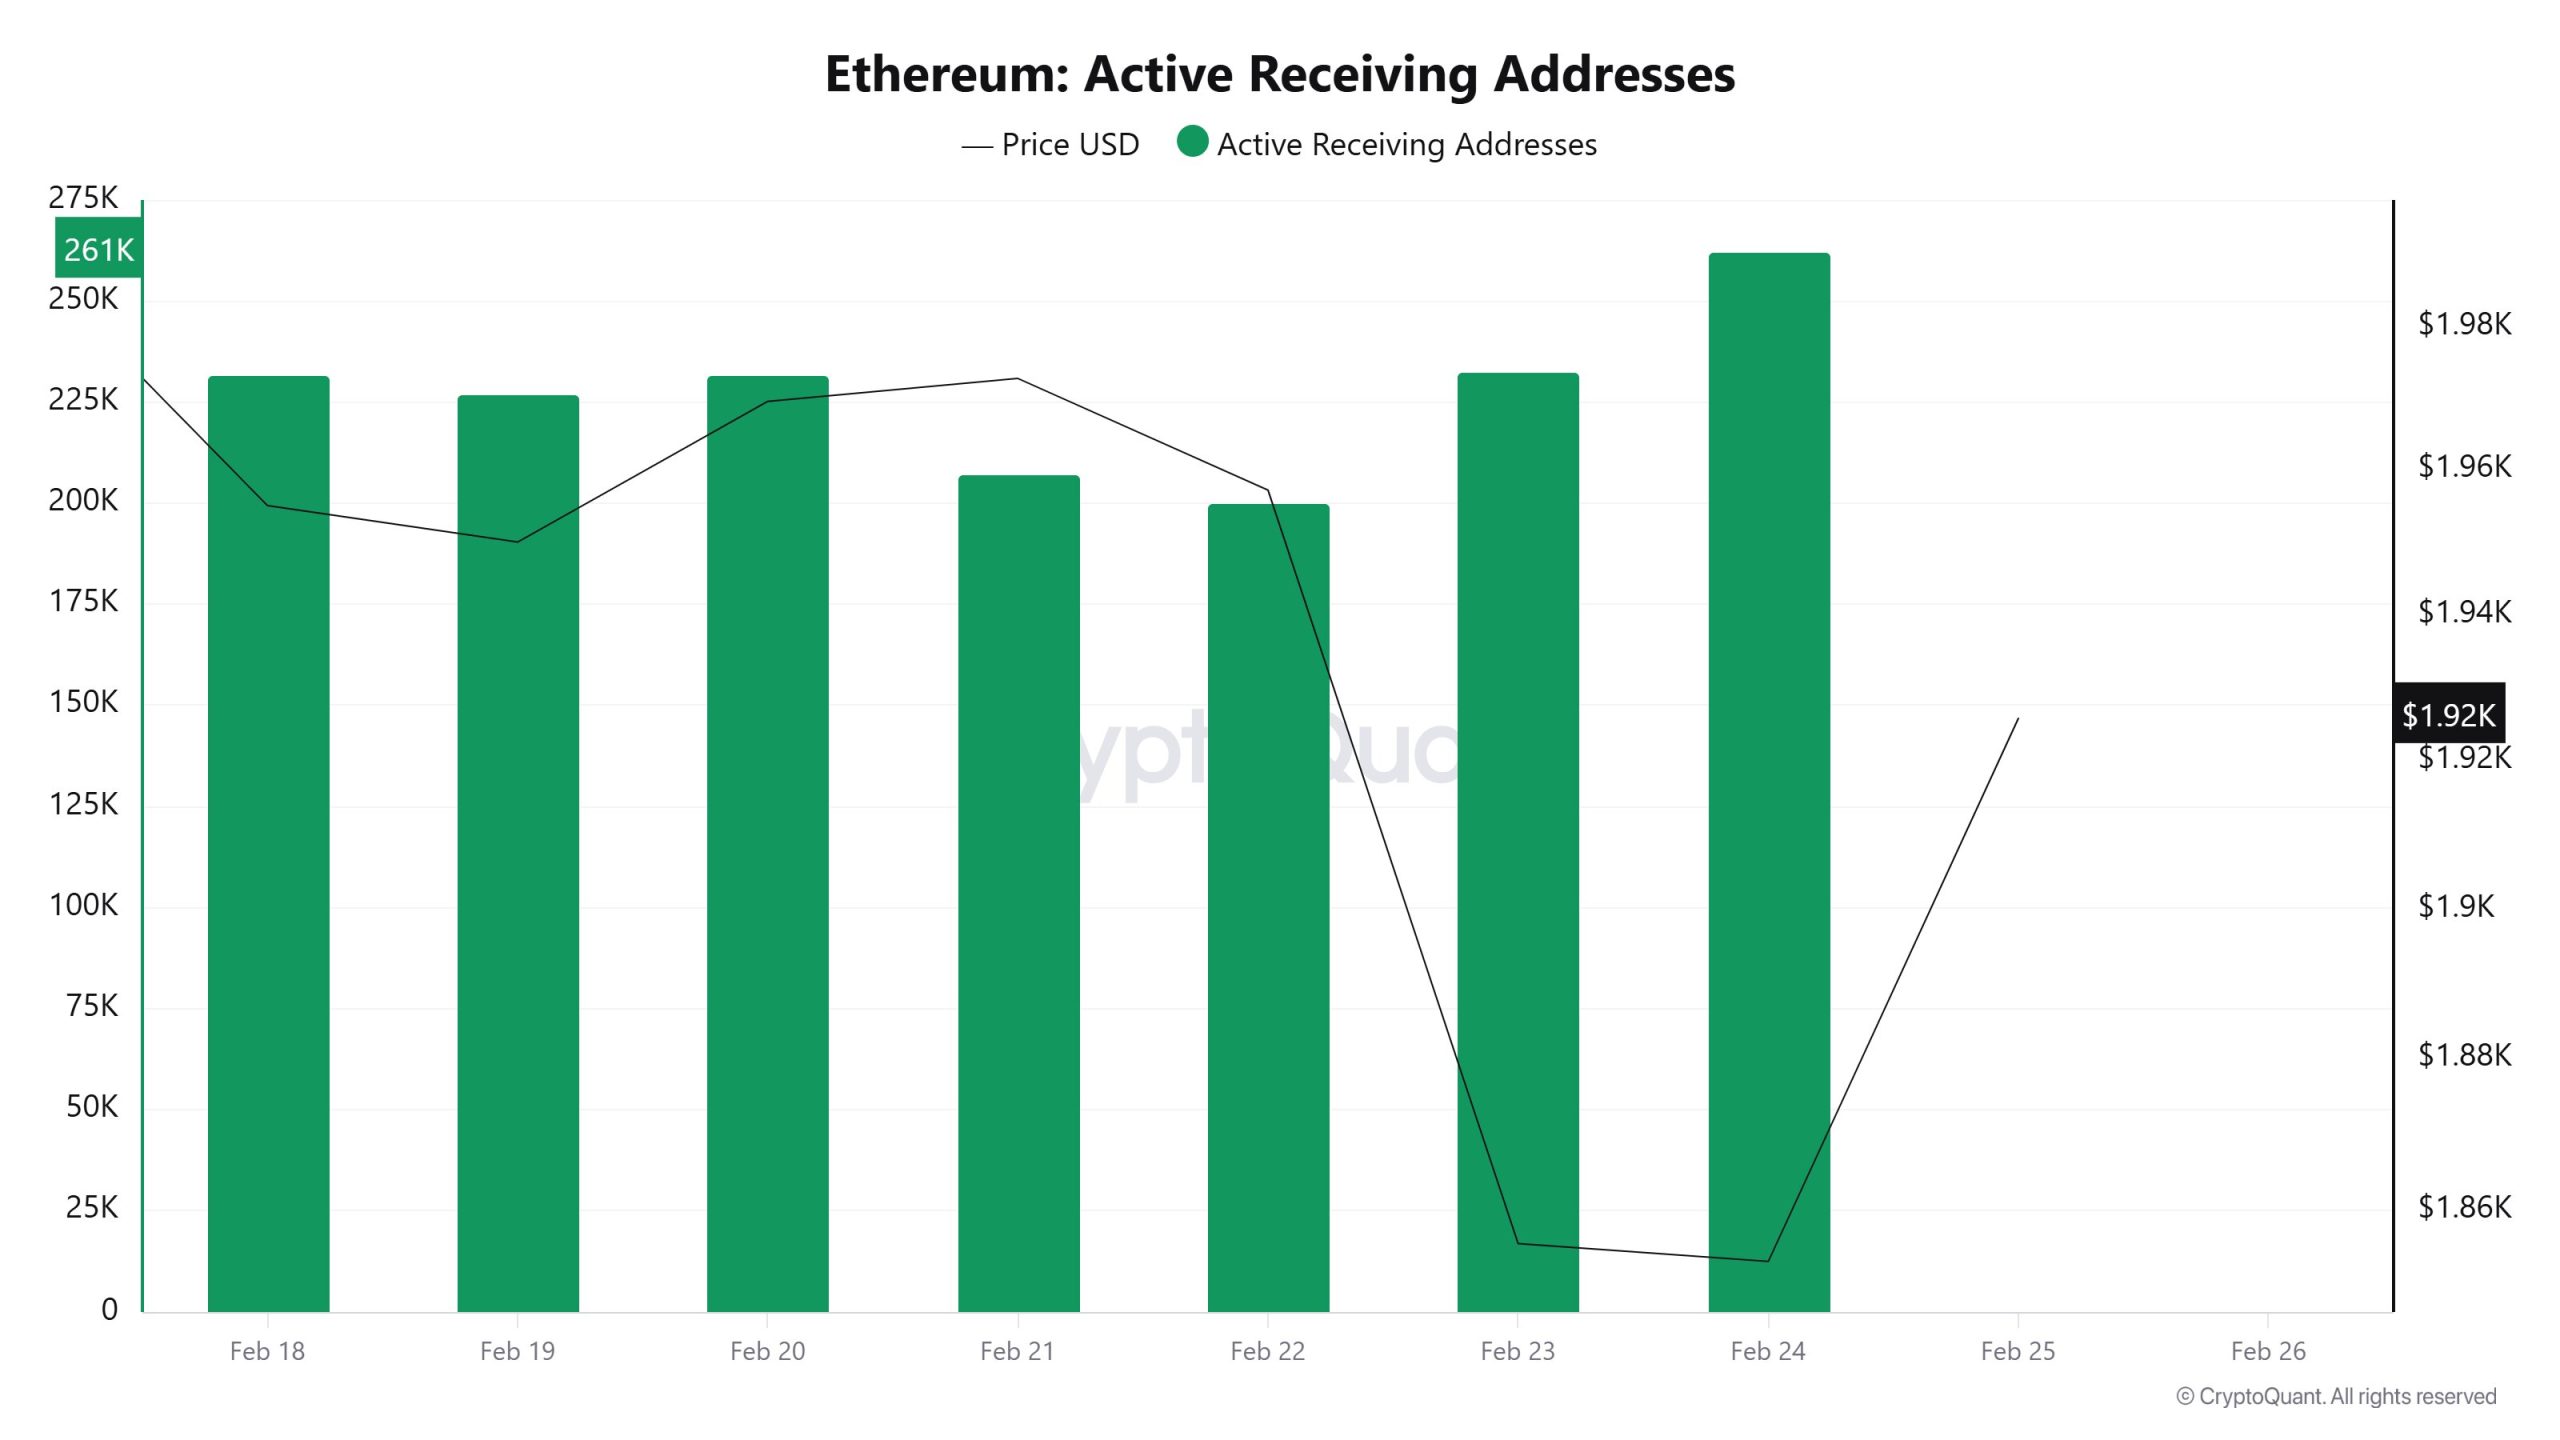
Between February 18 and February 25, there was no significant increase in active receiving addresses, except on the last day, while the price also moved downward, except on the last day. On the day the price reached its lowest level, active receiving addresses reached 261,947, indicating an increase in sales.
Total Value Staked
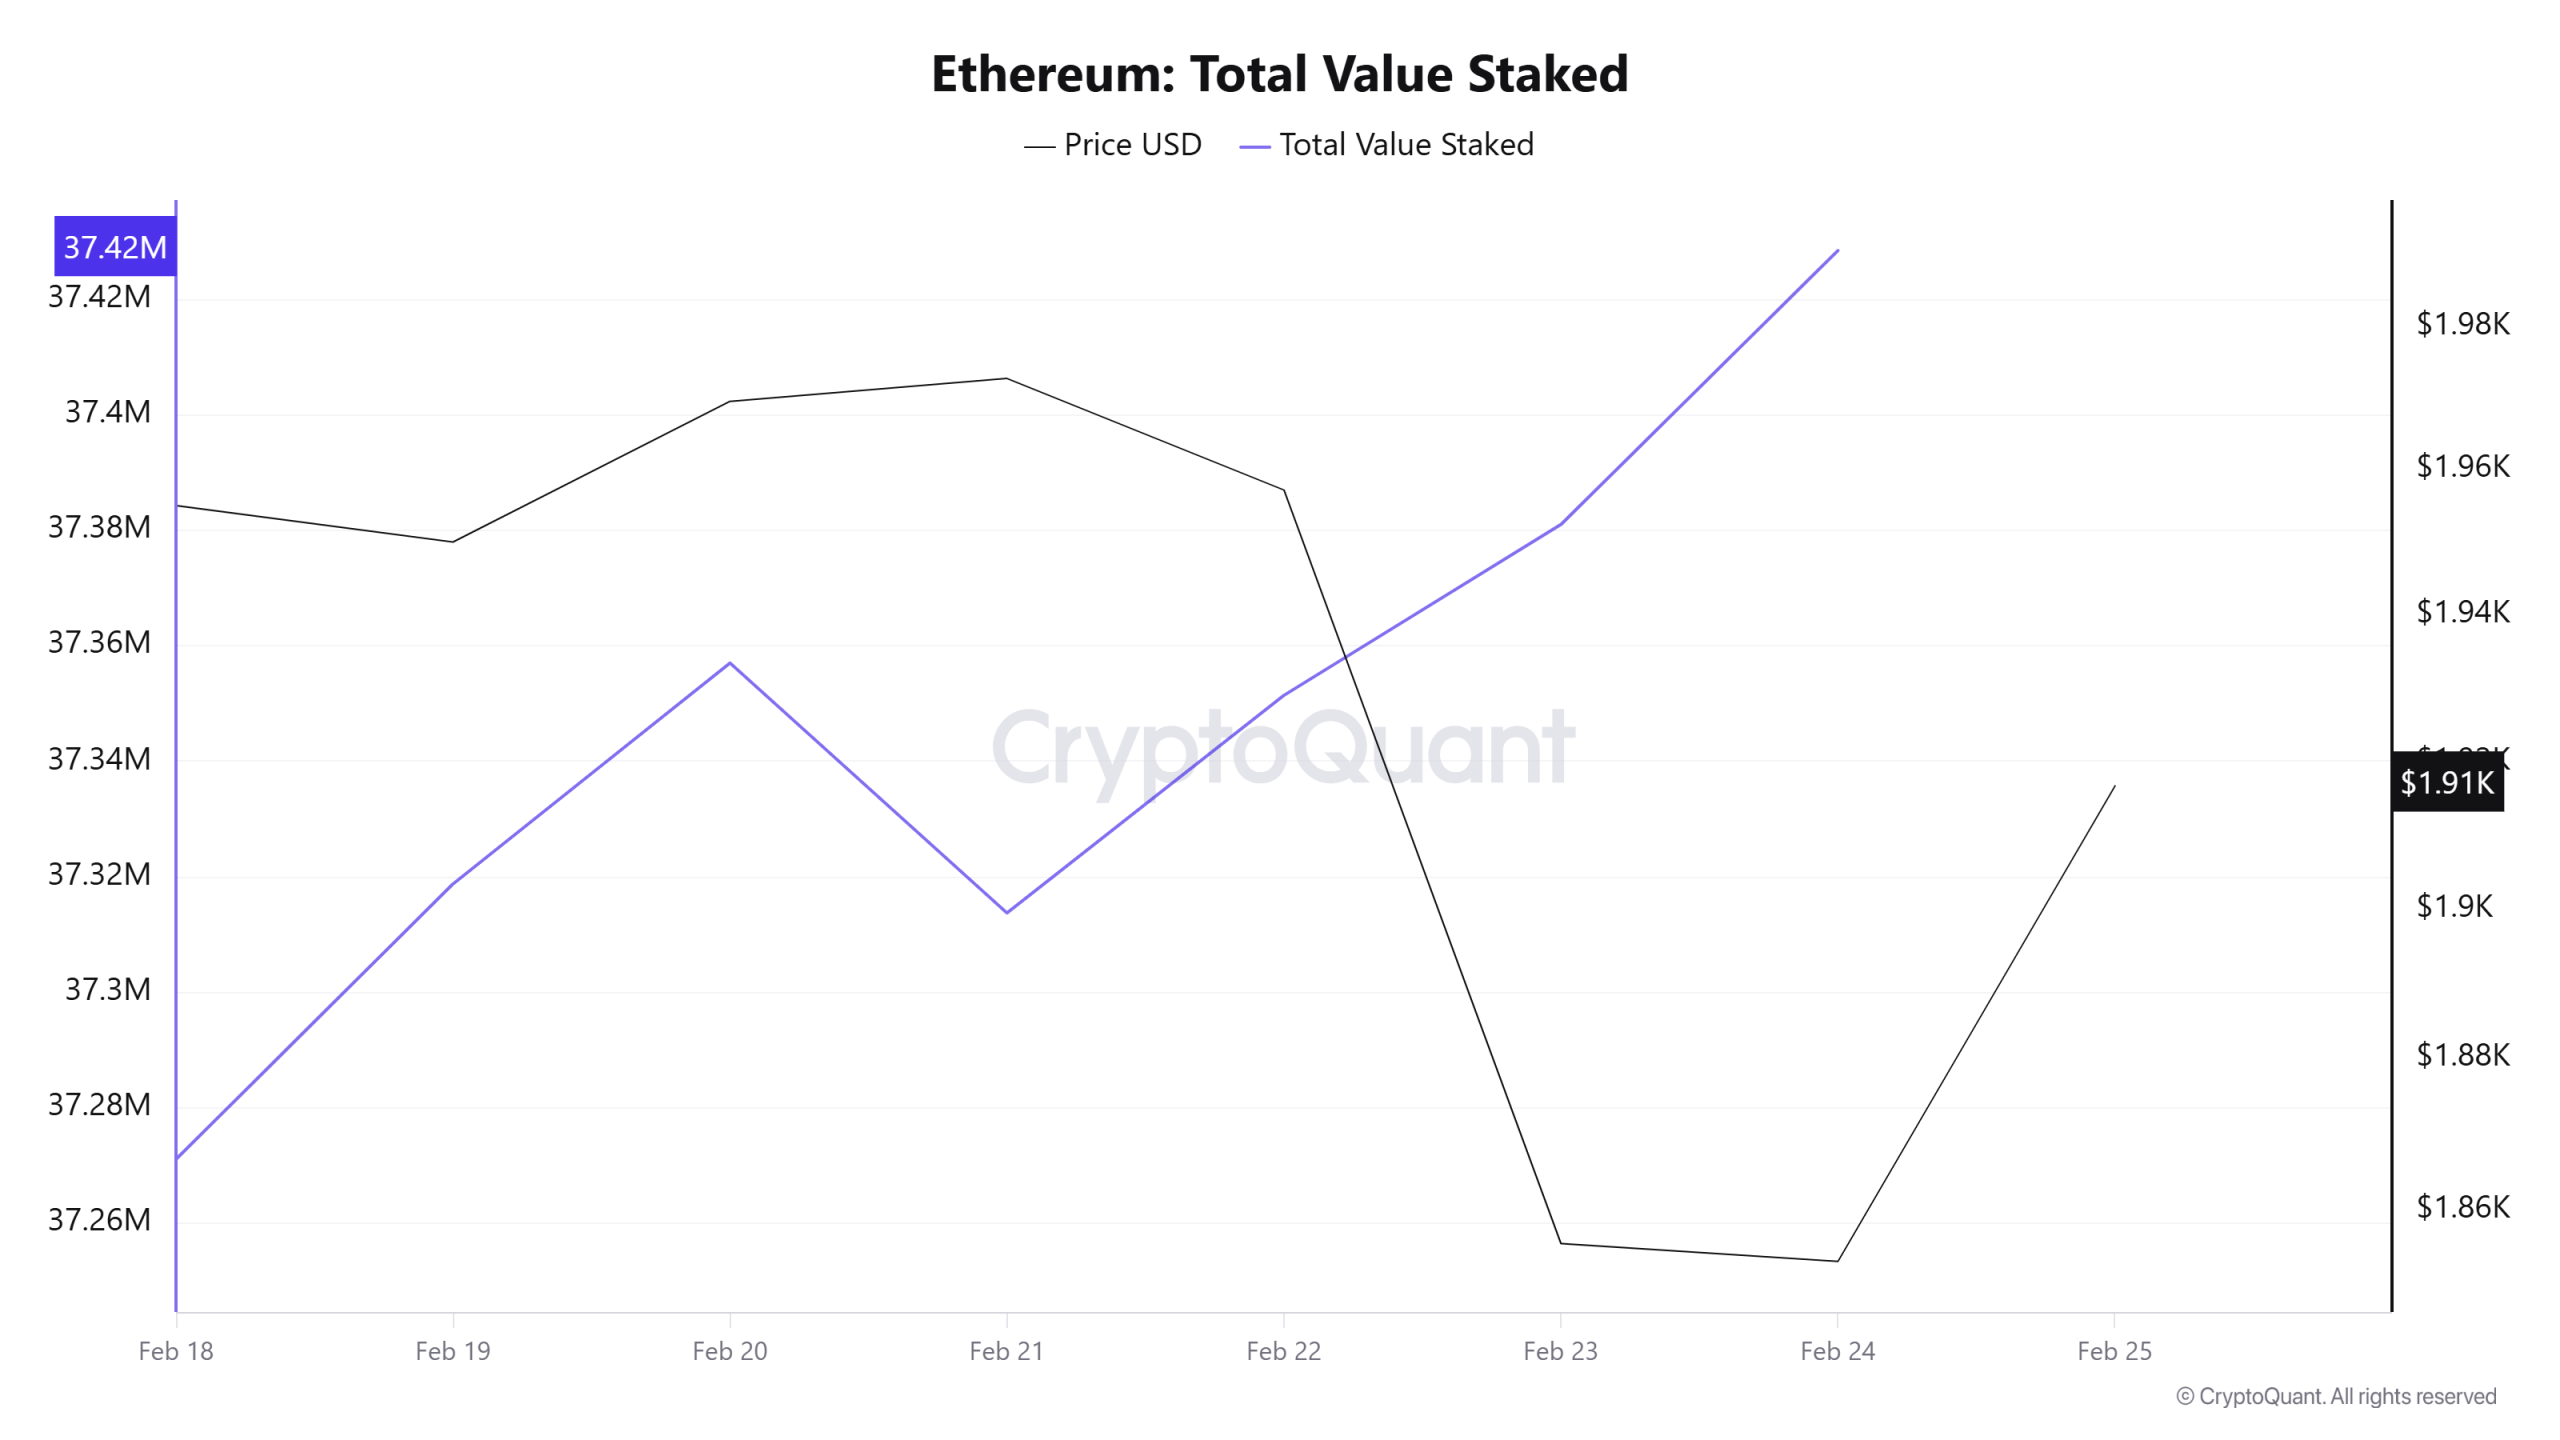
This week, Total Value Staked on Ethereum continued its upward trend, reaching approximately 37.42M, indicating that the locked supply continued to grow in the new week. In contrast, the ETH price experienced a sharp pullback during the week, followed by a limited recovery. Unlike last week, the continued increase in staking amounts despite price weakness confirms that investors are not moving towards unwinding and that the holding tendency is maintained. This is a positive signal supporting structural tightness on the supply side. However, the price’s inability to strongly accompany the increase in staking indicates that upward momentum still needs demand support in the short term. For the trend to strengthen, accelerating spot demand appears critical in addition to growth in locked supply.
Staking Inflows
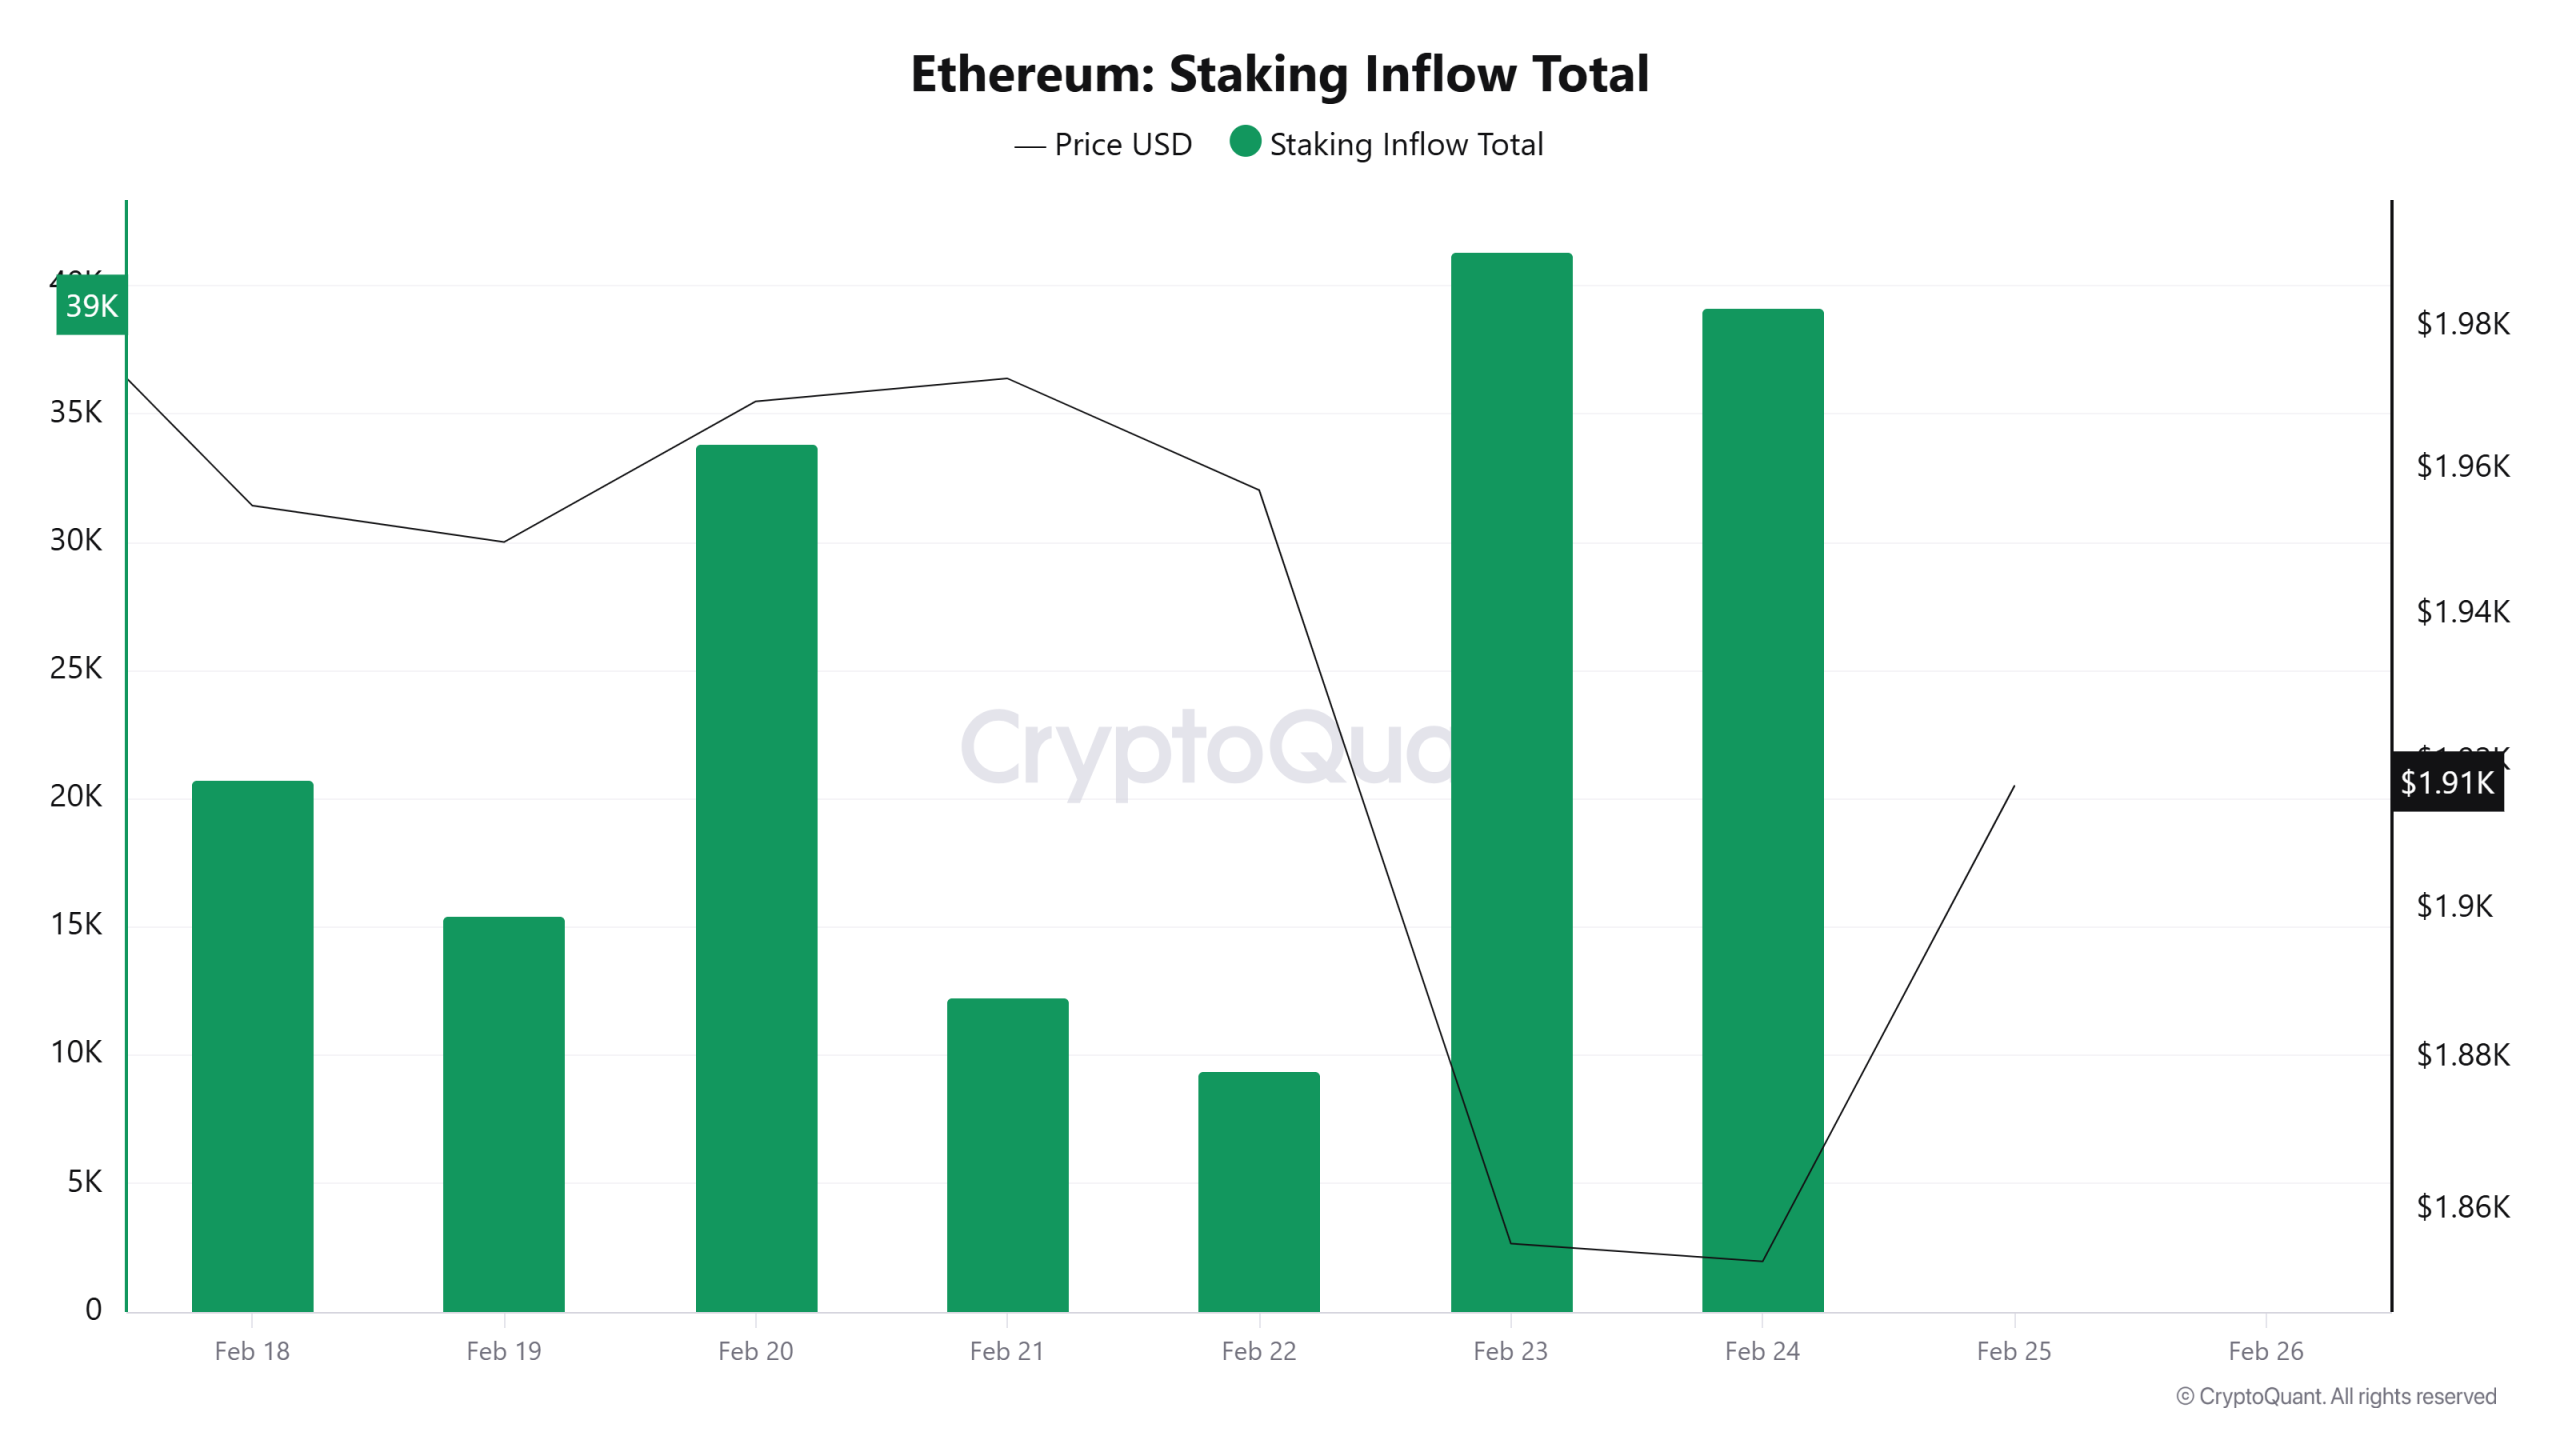
This week, staking inflows on the Ethereum side picked up speed again, with particularly strong inflows in recent days. Unlike last week, new participation in staking appears to be recovering. Despite price volatility, the increase in inflows indicates that investors’ appetite for staking has revived and the locking trend has strengthened. This scenario produces a constructive signal in terms of supply being withdrawn from the market. However, the sharp rise in inflows in a short period requires monitoring whether the momentum is sustainable. For a lasting strengthening, it will be critical for staking flows to maintain their high trajectory in the coming days.
Derivatives
Open Interest
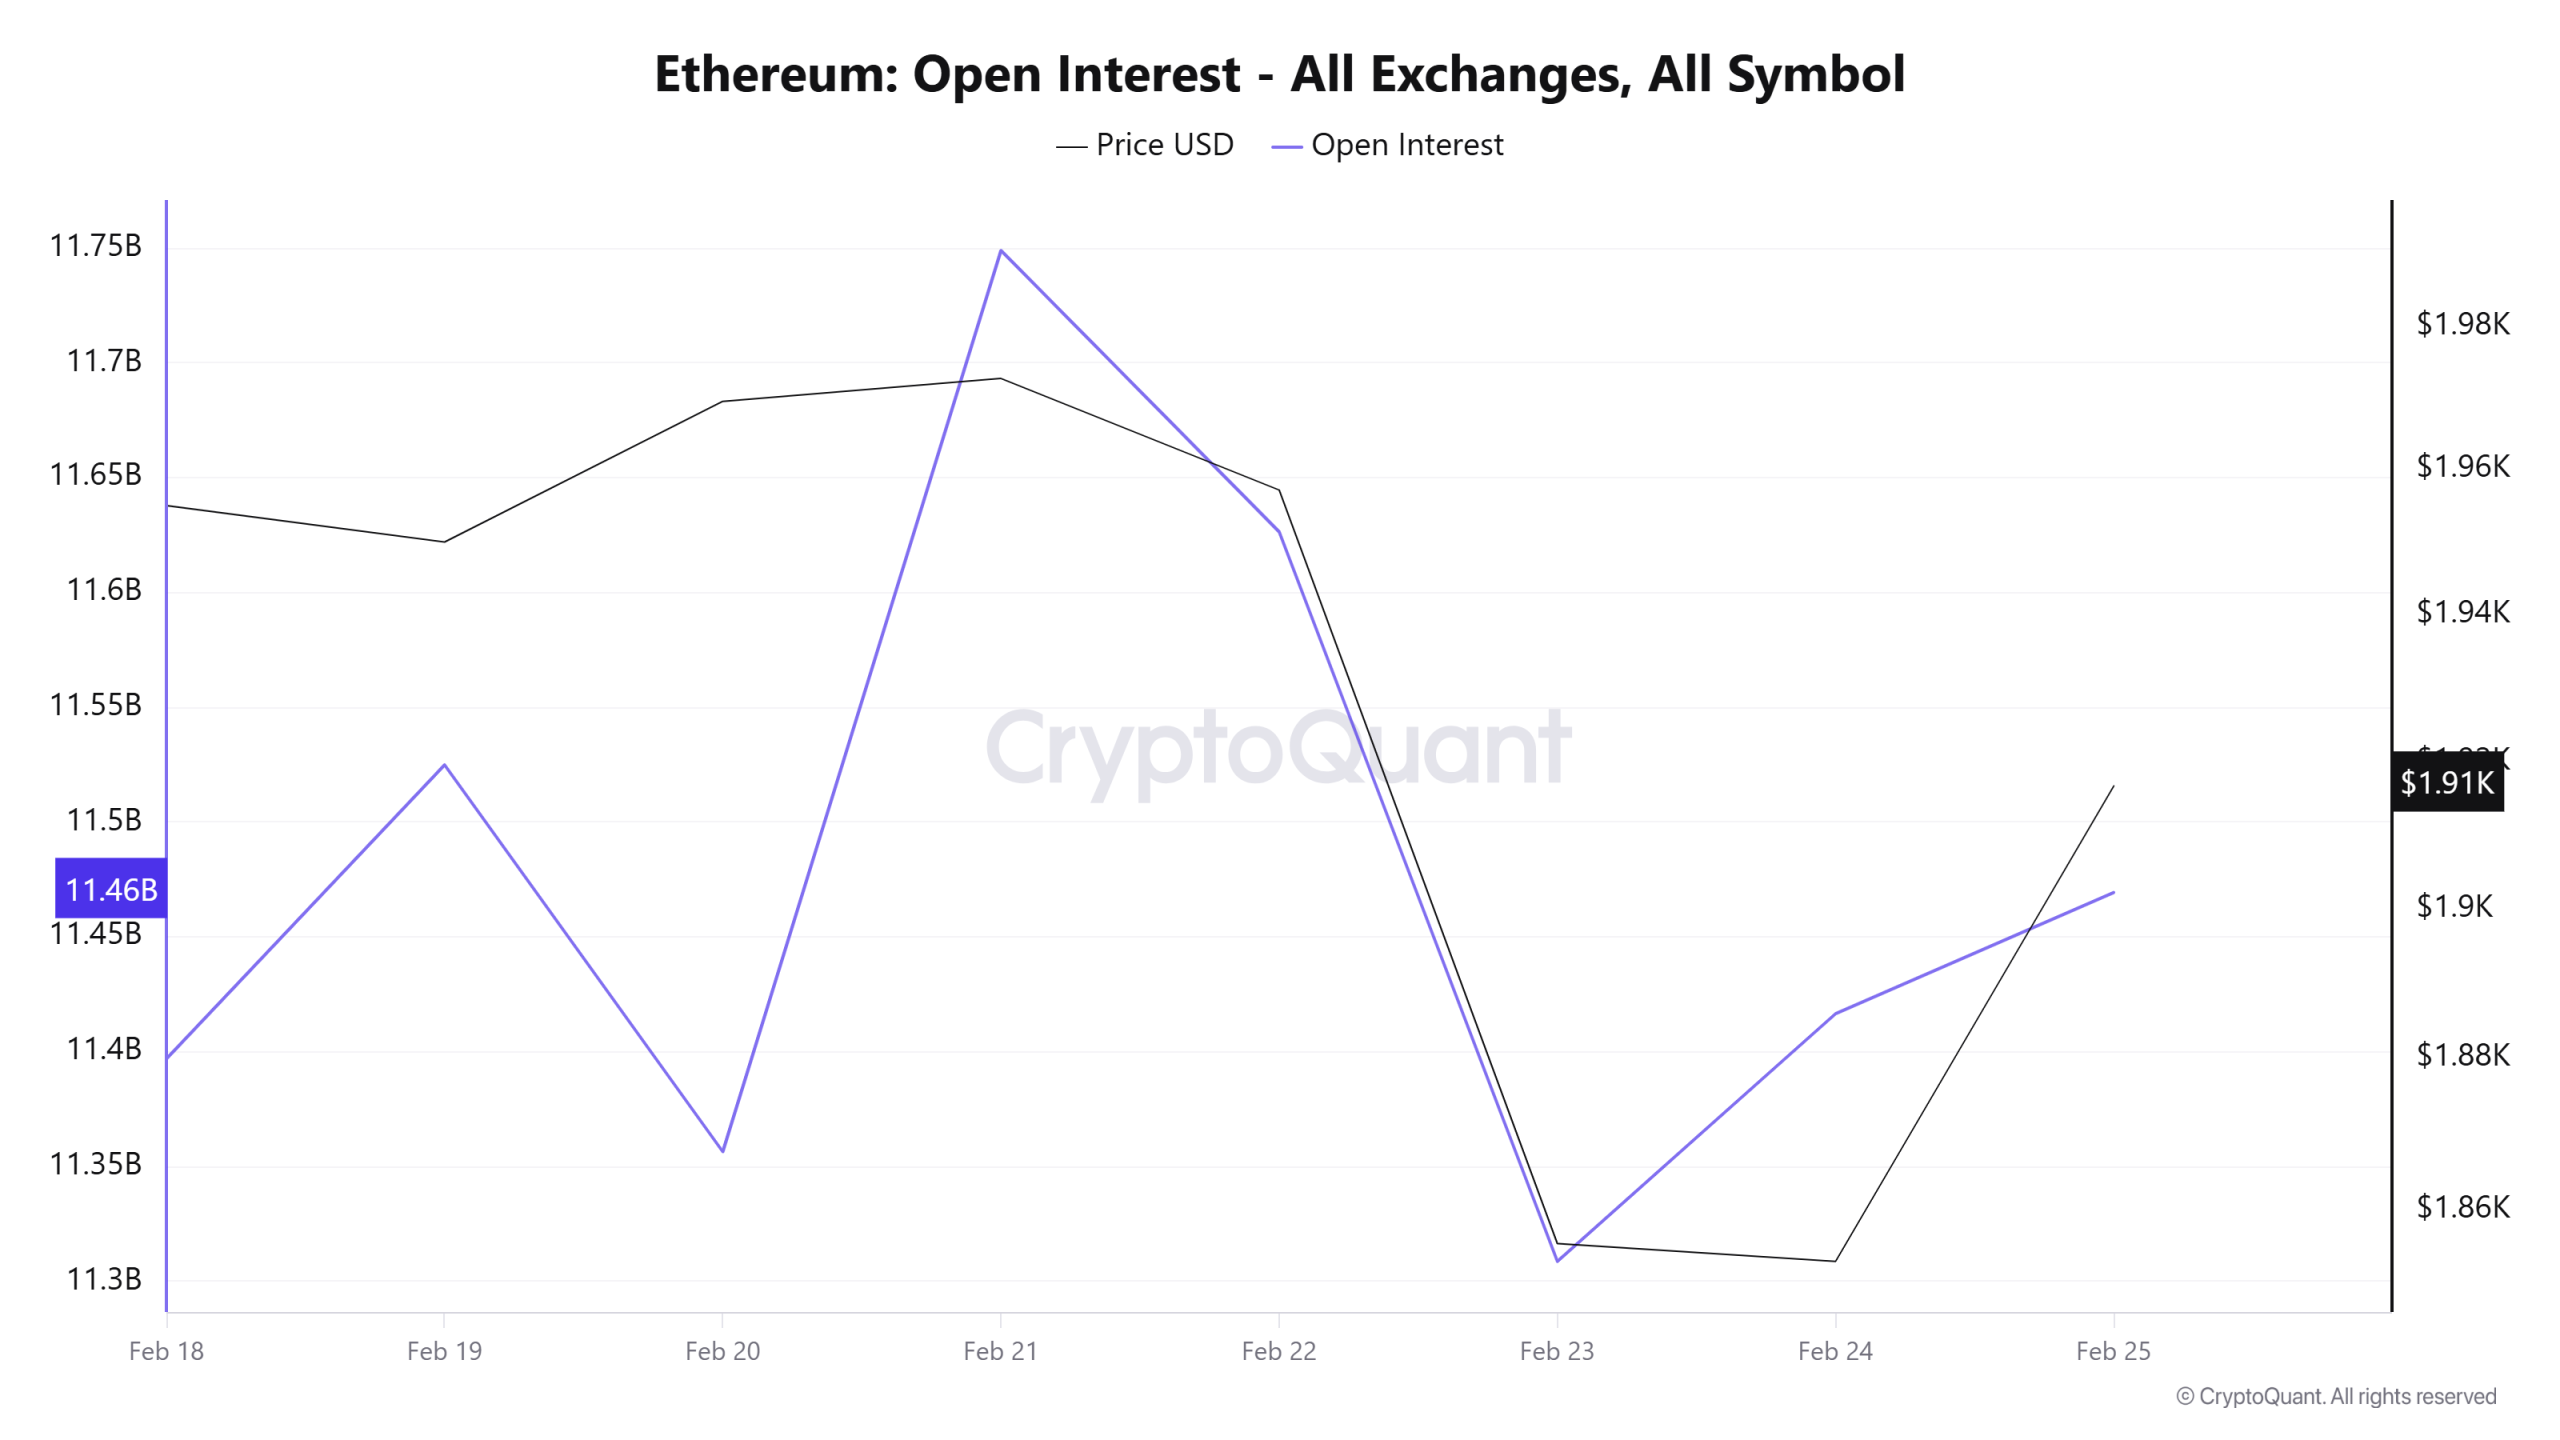
ETH Open Interest peaked around February 21 and then fell sharply, indicating a significant long liquidation on February 23. There has been a gradual recovery in open positions in recent days, but as the price has not strengthened to the same extent, new position entries appear cautious. Overall, leverage has been cleared, and the market is entering a position accumulation phase again.
Funding Rate
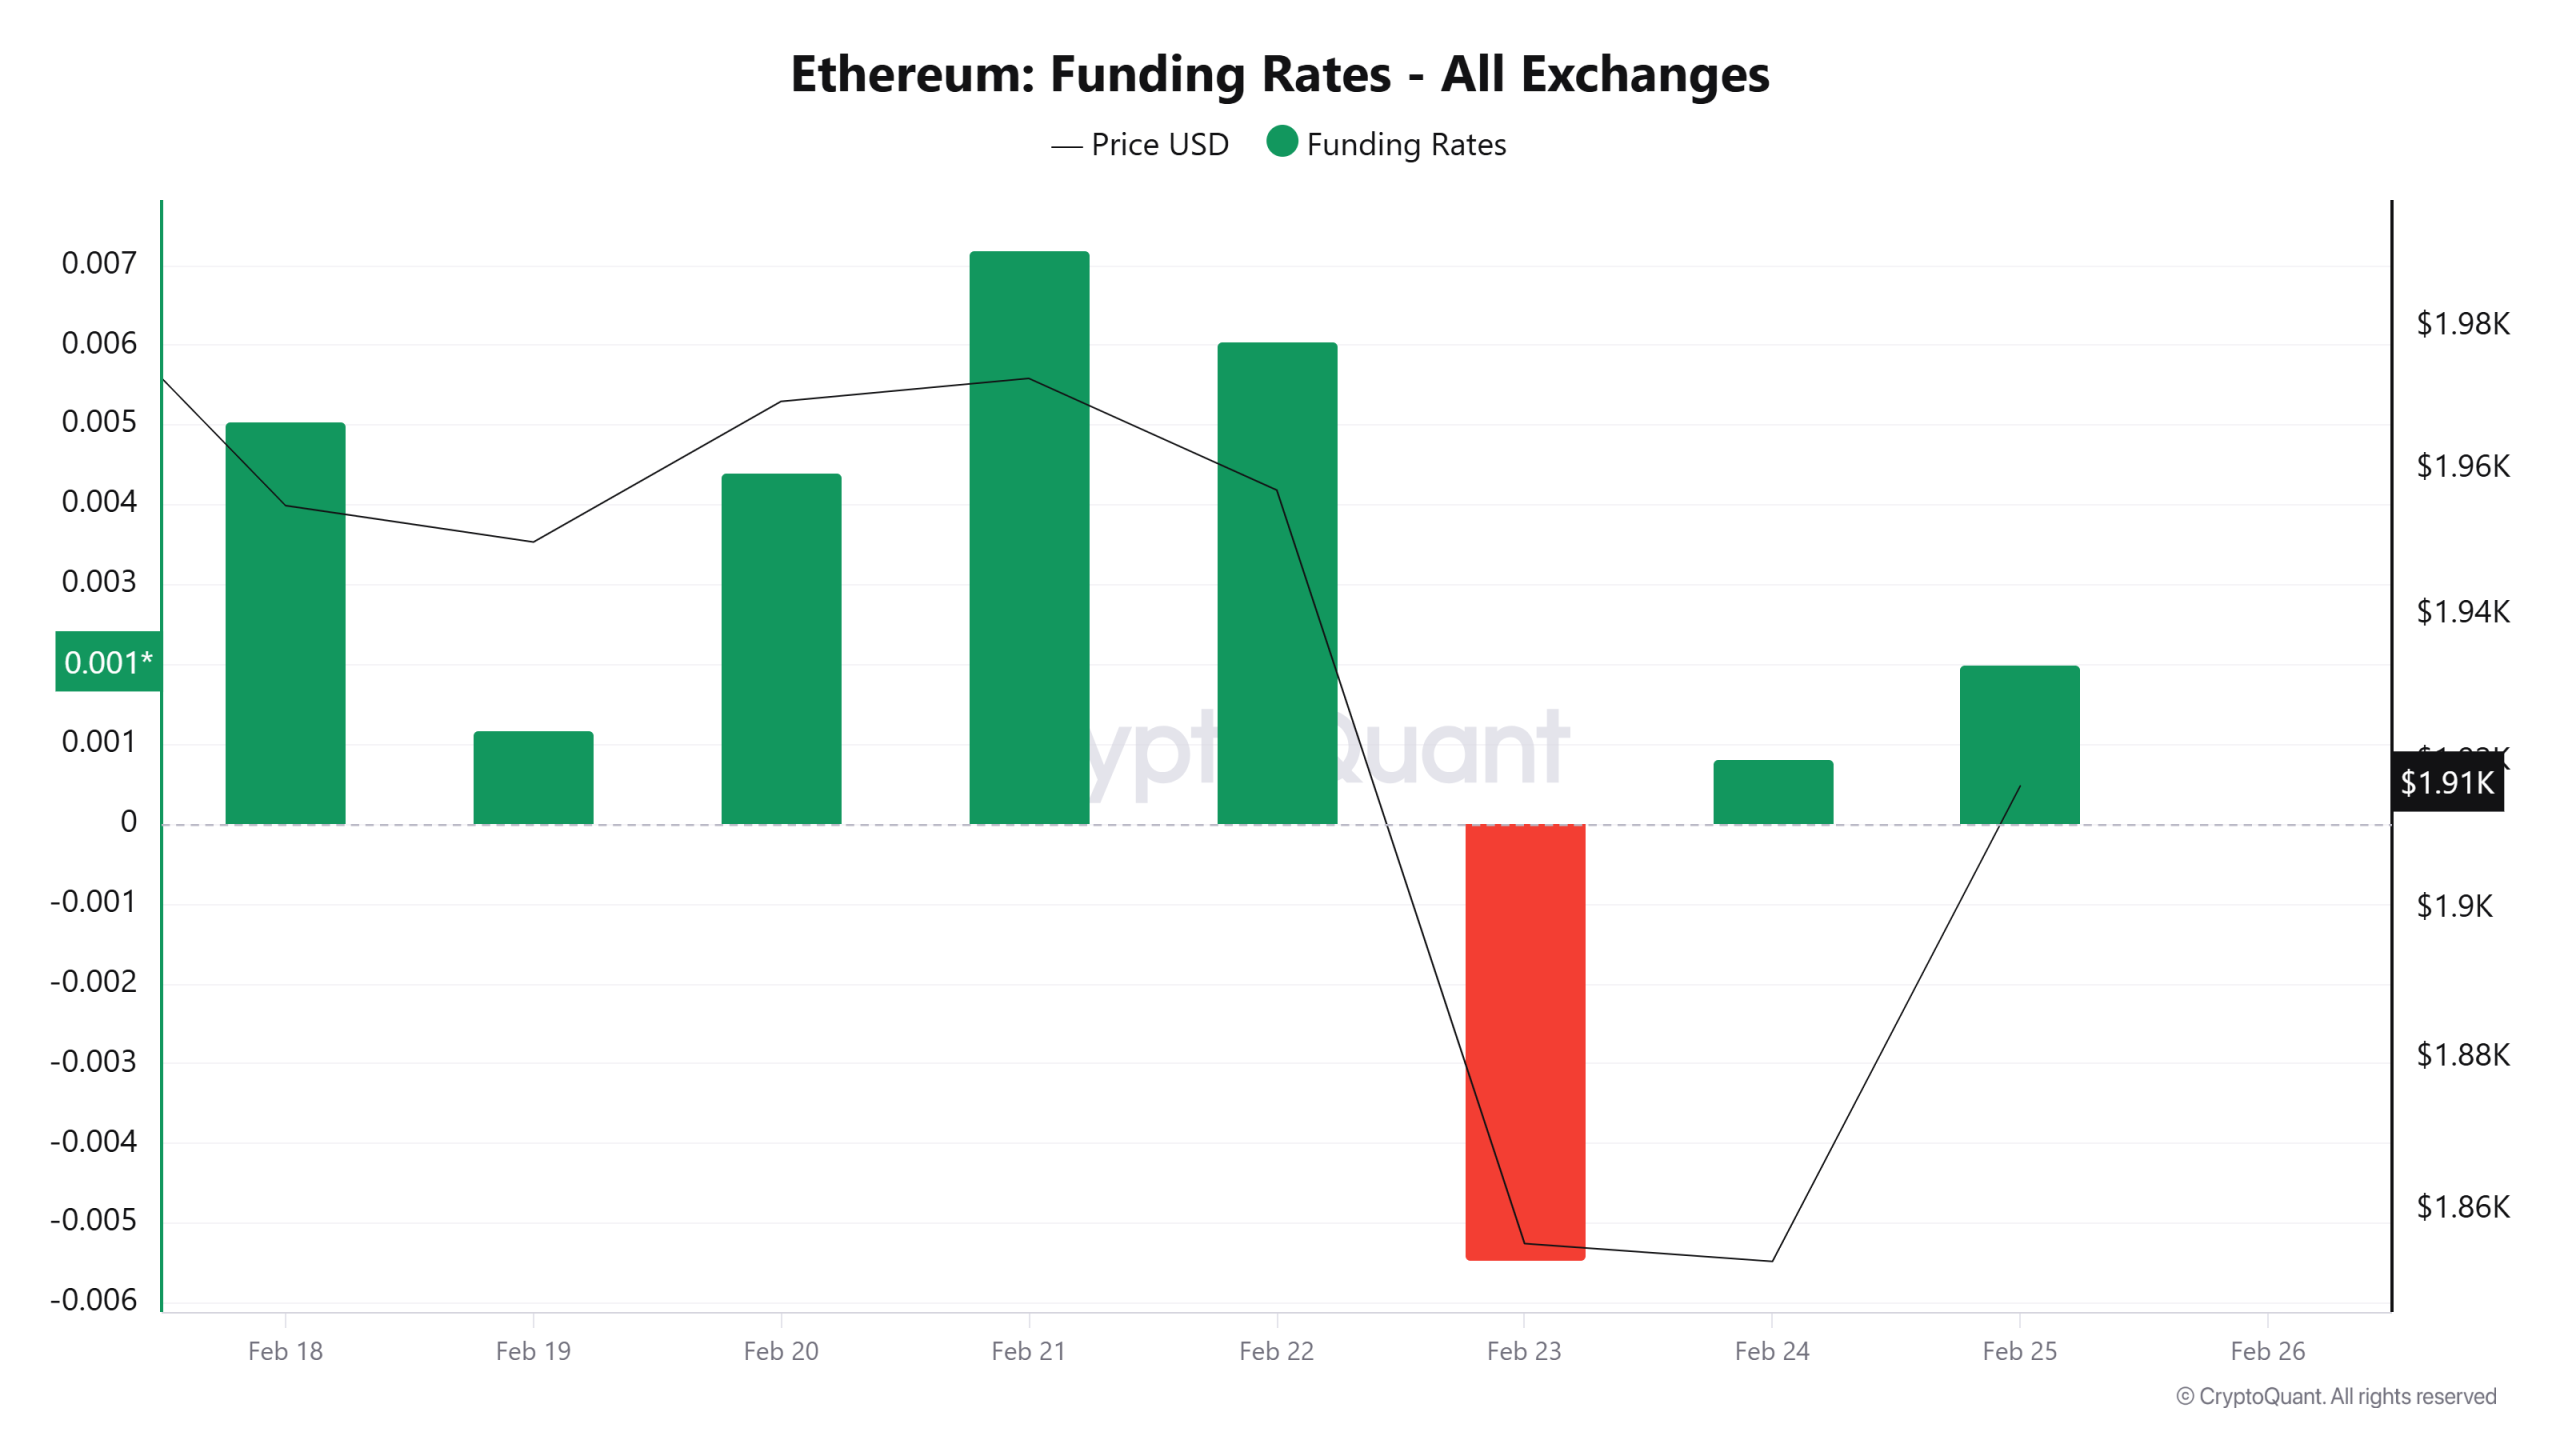
The ETH funding rate has generally been positive, meaning that the long side has remained dominant in the market. The sharp shift to negative on February 23 indicates a short-term long squeeze and panic closing. Its subsequent return to positive shows that long appetite has returned but is still fragile.
Long & Short Liquidations
As the ETH price fell from $2,030 to $1,800 last week, approximately $359 million in long positions were liquidated. During the same period, nearly $132 million in short positions were also liquidated.
| Date | Long Amount (Million $) | Short Amount (Million $) |
|---|---|---|
| February 18 | 48.10 | 19.81 |
| February 19 | 35.51 | 24.74 |
| February 20 | 25.25 | 21.61 |
| February 21 | 3.39 | 7.67 |
| February 22 | 10.73 | 3.63 |
| February 23 | 155.59 | 31.70 |
| February 24 | 81.07 | 23.03 |
| Total | 359.64 | 132.19 |
Supply Distribution
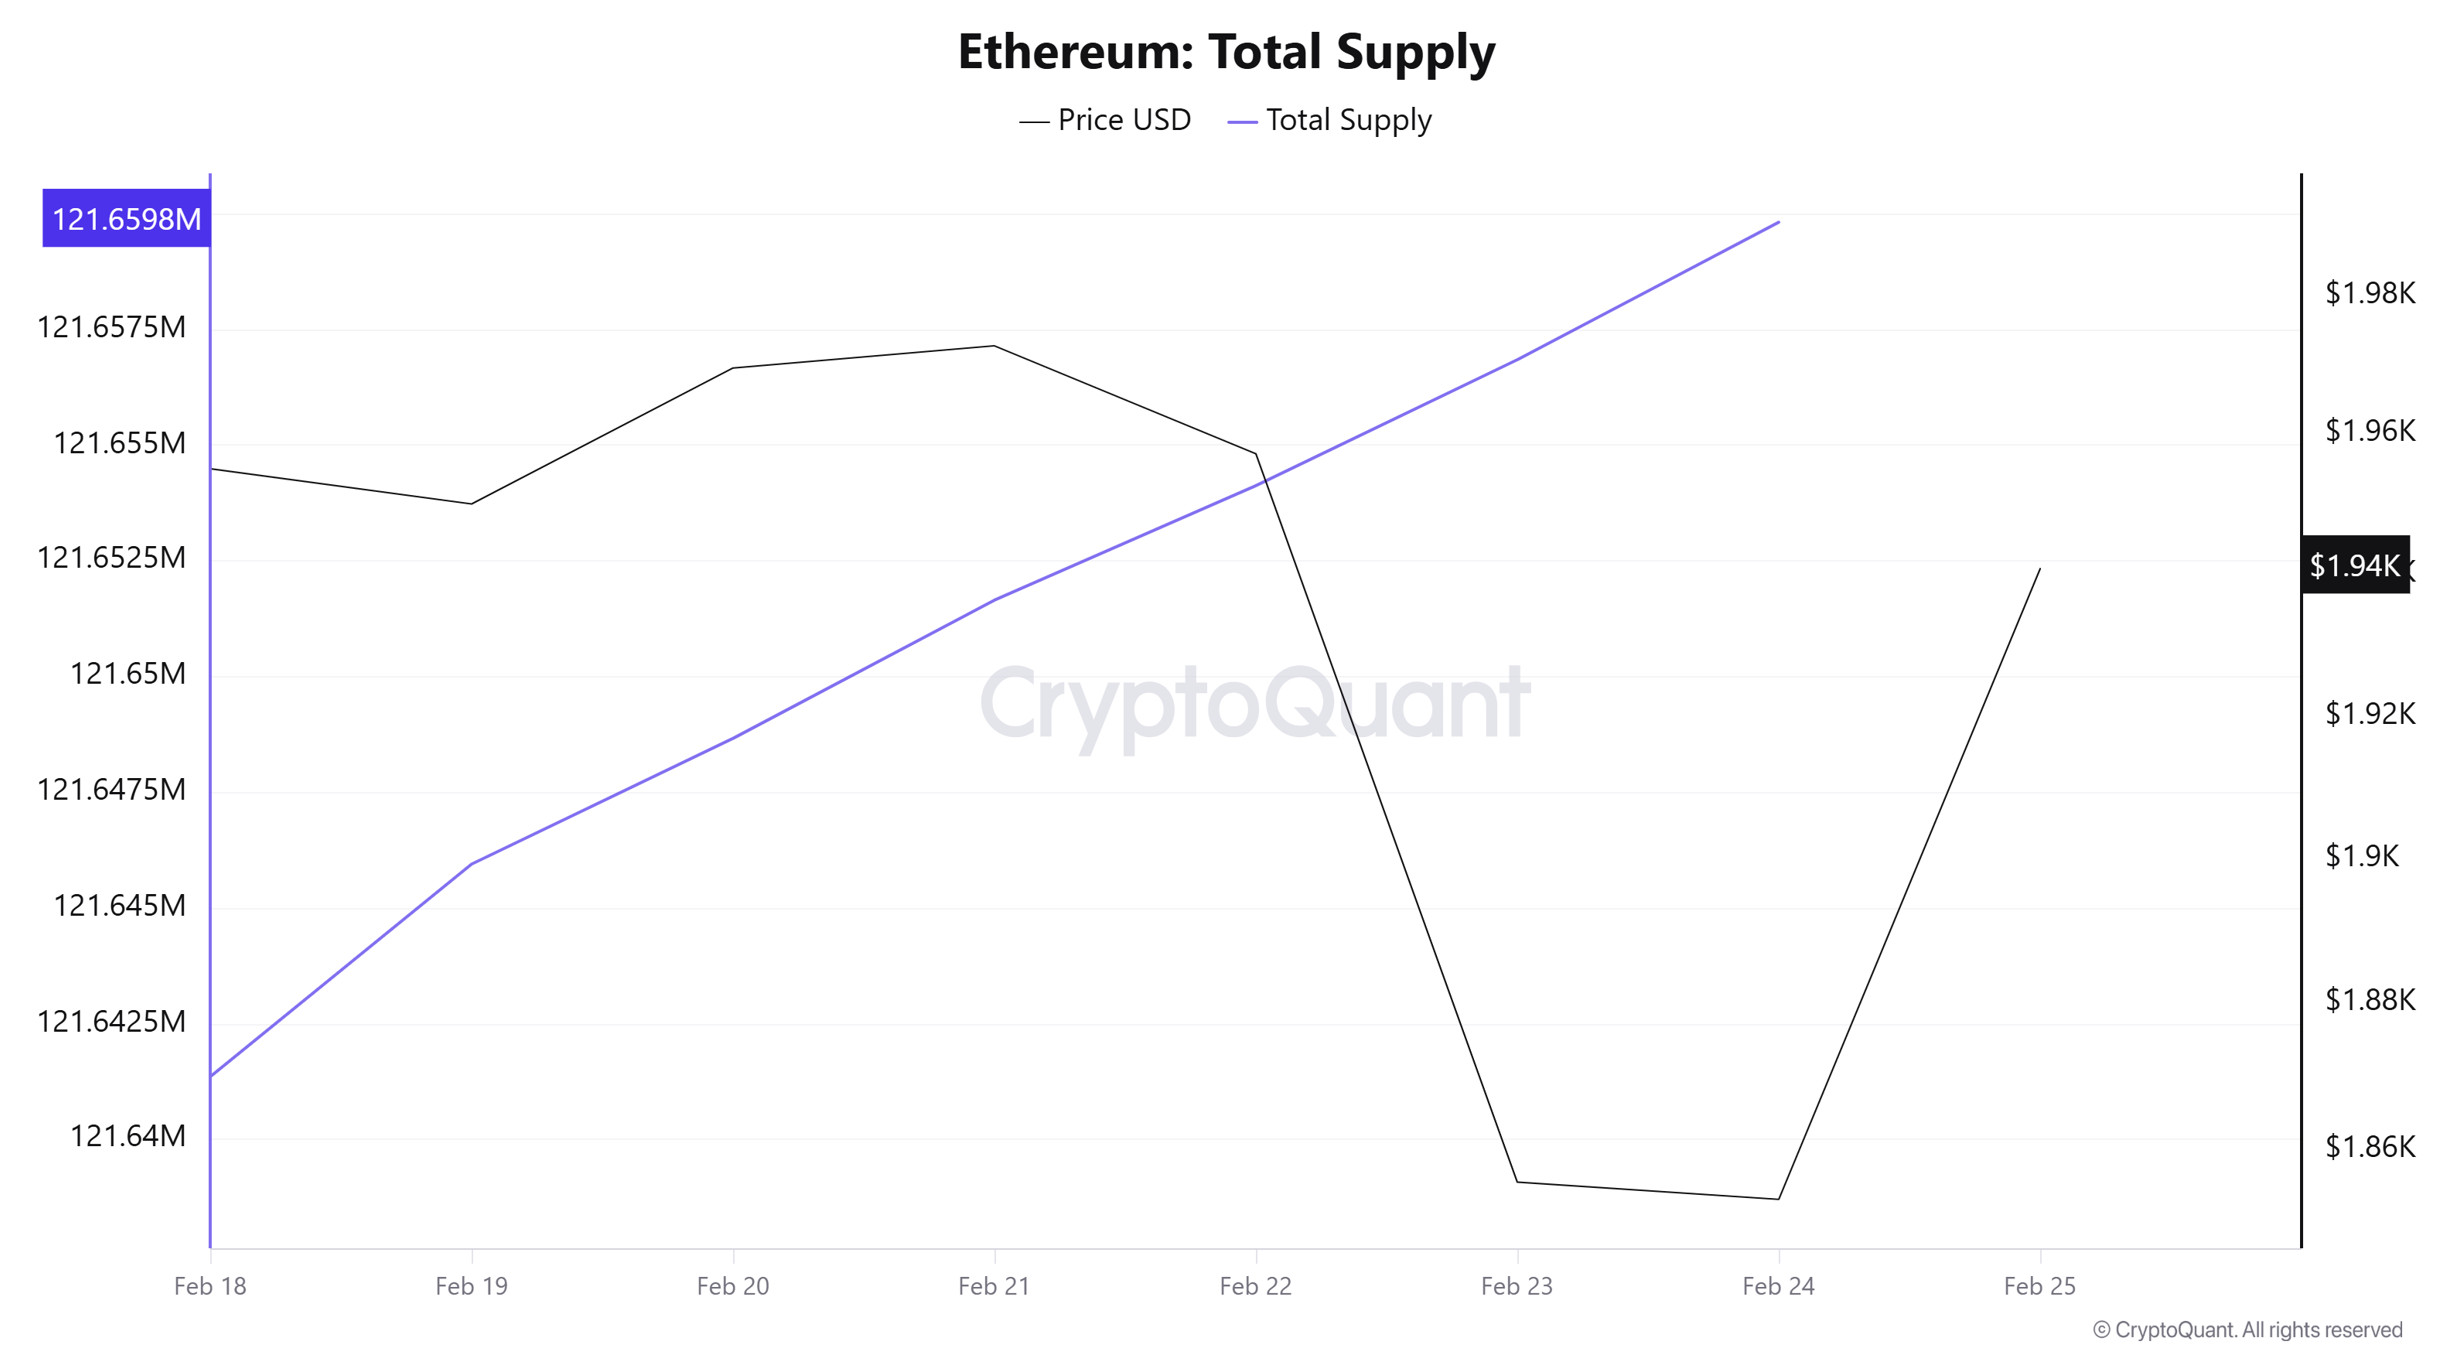
Total Supply: Reached 121,659,825 units, a decrease of approximately -0.0095% compared to last week.
New Supply: The amount of ETH produced this week was 2,713.
Velocity: The velocity value, which was 10.09 last week, increased to 10.12 this week.
| Wallet Category | 02/17/2025 | 02/23/2025 | Change (%) |
|---|---|---|---|
| 100 – 1k ETH | 8.7294M | 8.7251M | −0.05% |
| 1k – 10k ETH | 12.6019M | 12.8854M | 2.25% |
| 10k – 100k ETH | 21.3386M | 21.1112M | −1.06% |
| 100k+ ETH | 4.0664M | 4.194M | 3.10% |
During the week of February 17–23, 2025, small wallets (100–1k ETH) remained nearly stable, while medium-sized wallets (1k–10k ETH) increased by 2.25%, boosting ETH holdings. Wallets holding 10k–100k ETH experienced a slight decline, decreasing by −1.06%, while large holders (100k+ ETH) made significant purchases, increasing by 3.1%. Overall, the largest wallets and mid-tier holdings saw notable increases, while small holders remained stable.
Exchange Reserve
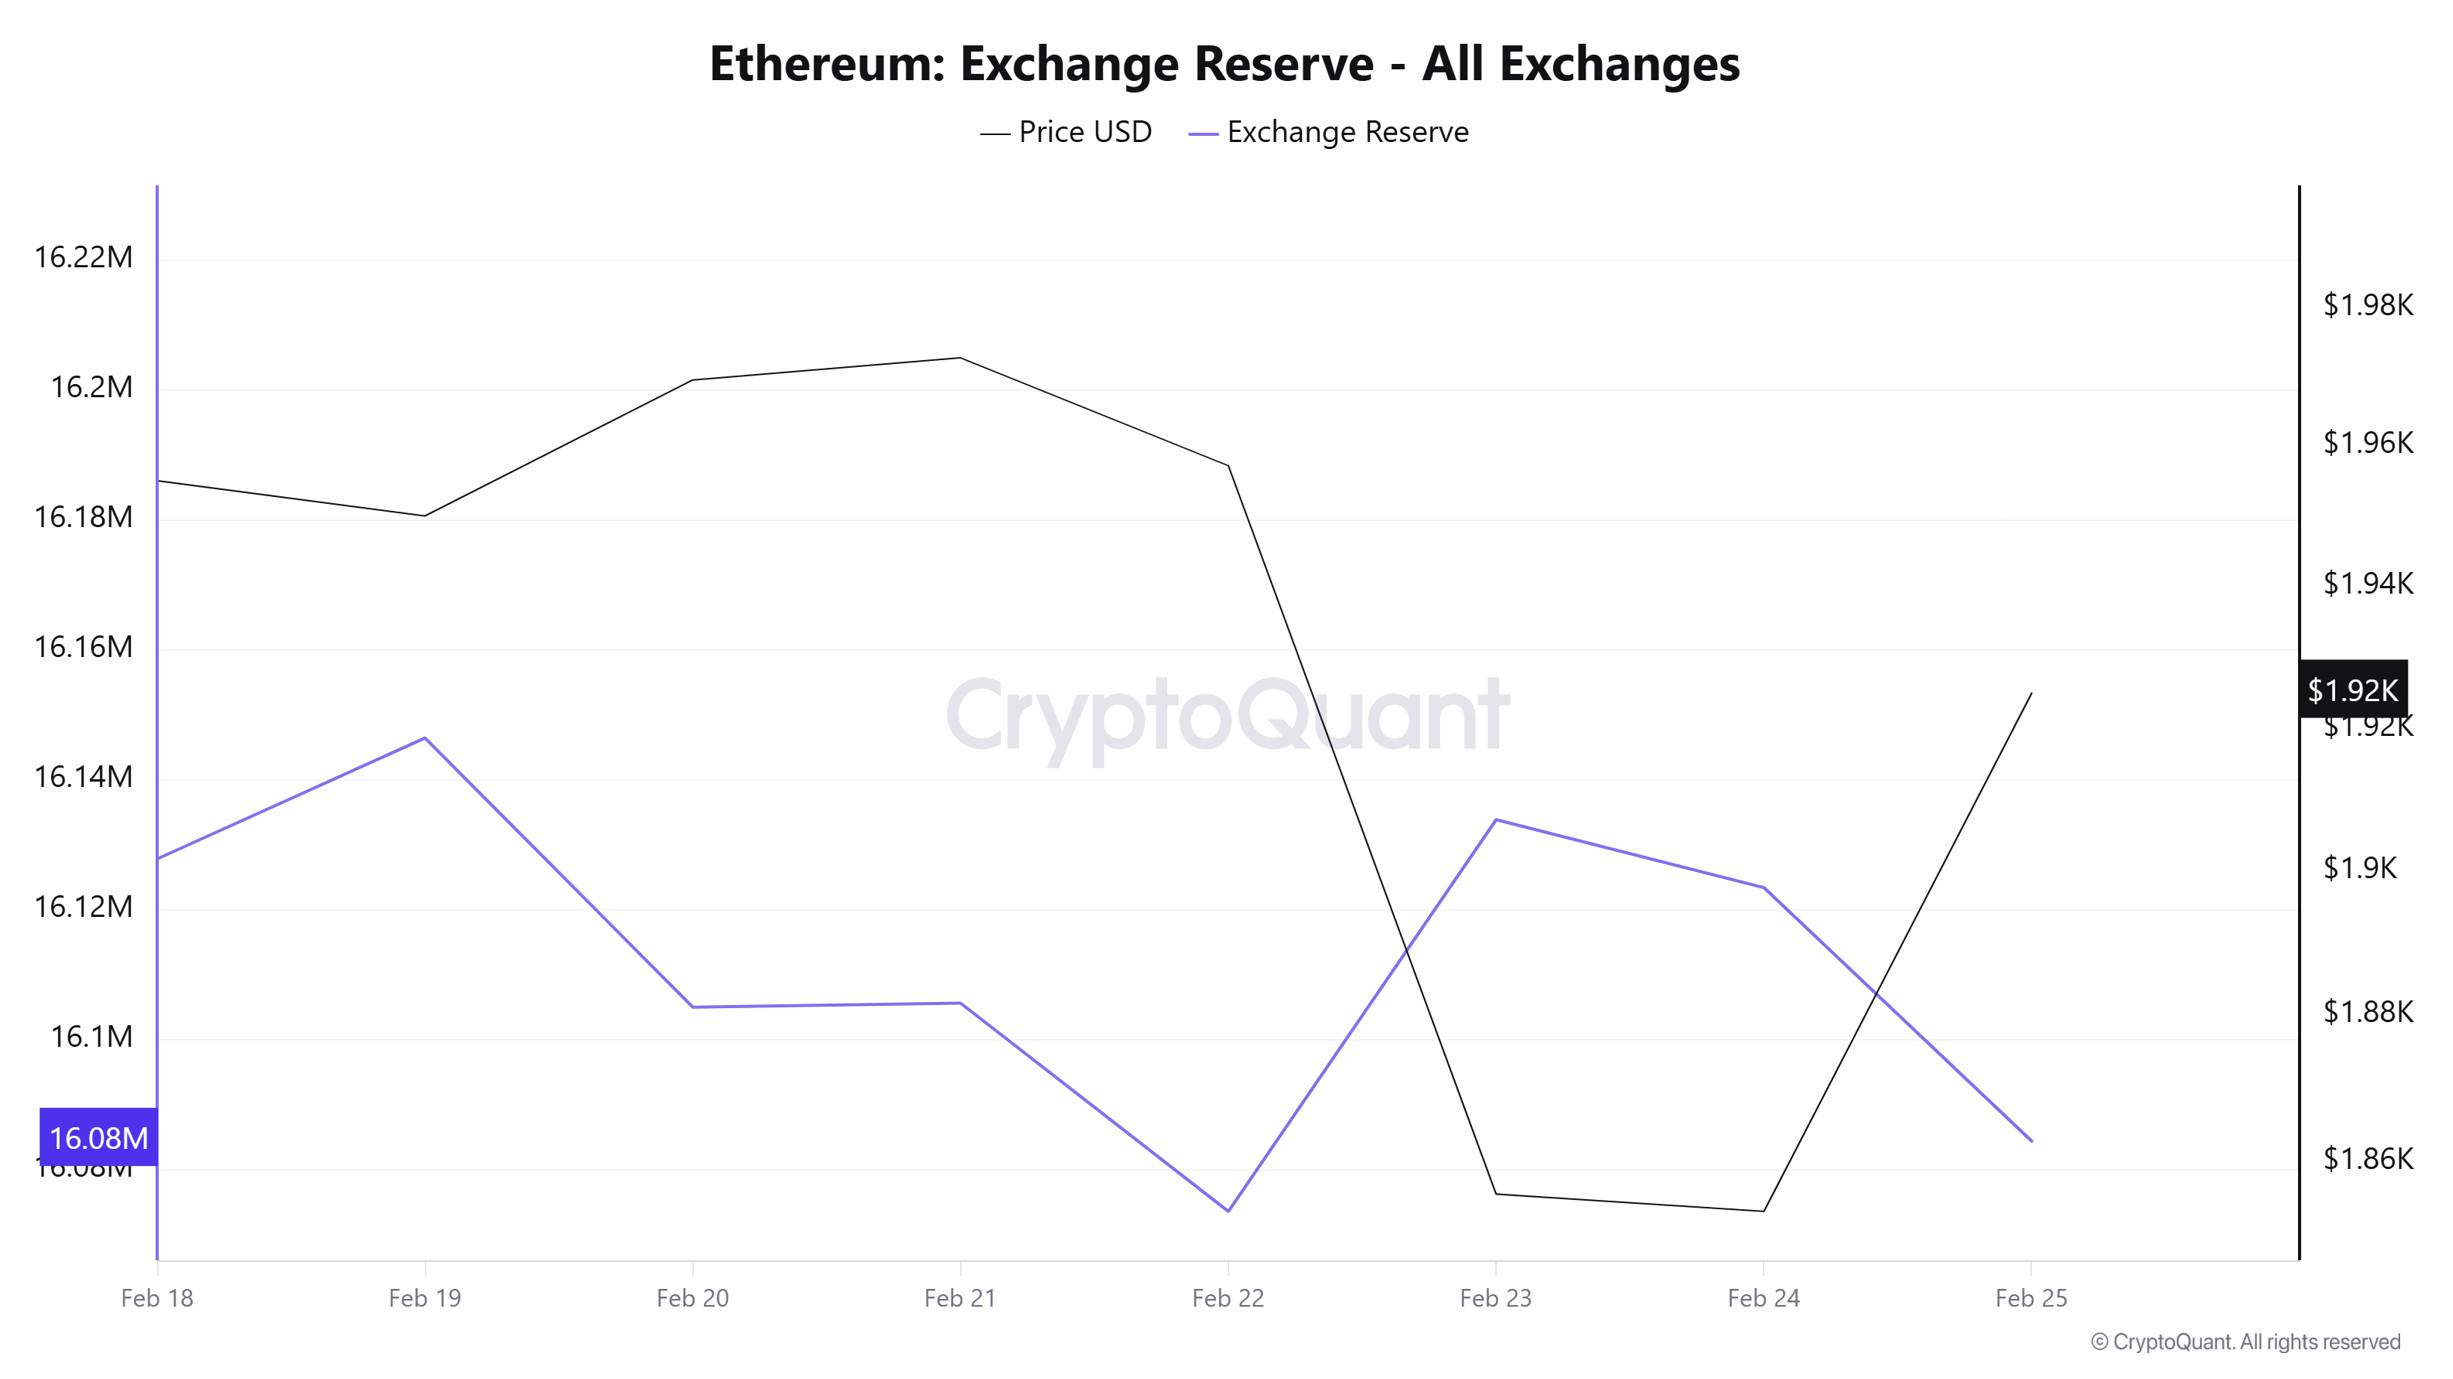
Between February 18–24, 2026, Ethereum reserves on exchanges decreased from 16,127,846 ETH to 16,123,439 ETH, resulting in a net outflow of 4,407 ETH. During this period, reserves decreased by approximately 0.03%. The total Netflow for the week was -100,536 ETH (the sum of daily net flows). This indicates that, looking at the overall picture, there was a limited outflow of ETH from exchanges on a weekly basis. On the price front, ETH declined from $1,955 to $1,853, losing 5.22% of its value. Despite the price decline, the lack of a significant increase in reserves suggests that the selling pressure may be more derived from derivatives markets or non-spot sources.
| Date | 18-Feb | 19-Feb | 20-Feb | 21-Feb | 22-Feb | 23-Feb | 24-Feb |
|---|---|---|---|---|---|---|---|
| Exchange Inflow | 888,875 | 839,259 | 1,109,573 | 291,300 | 306,622 | 1,084,574 | 912,460 |
| Exchange Outflow | 985,005 | 820,646 | 1,150,988 | 290,682 | 338,671 | 1,024,304 | 922,905 |
| Exchange Netflow | -96,129 | 18,613 | -41,414 | 618 | -32,049 | 60,269 | -10,444 |
| Exchange Reserve | 16,127,846 | 16,146,460 | 16,105,045 | 16,105,663 | 16,073,614 | 16,133,884 | 16,123,439 |
| ETH Price | 1,955 | 1,950 | 1,969 | 1,972 | 1,957 | 1,855 | 1,853 |
Estimated Leverage Ratio
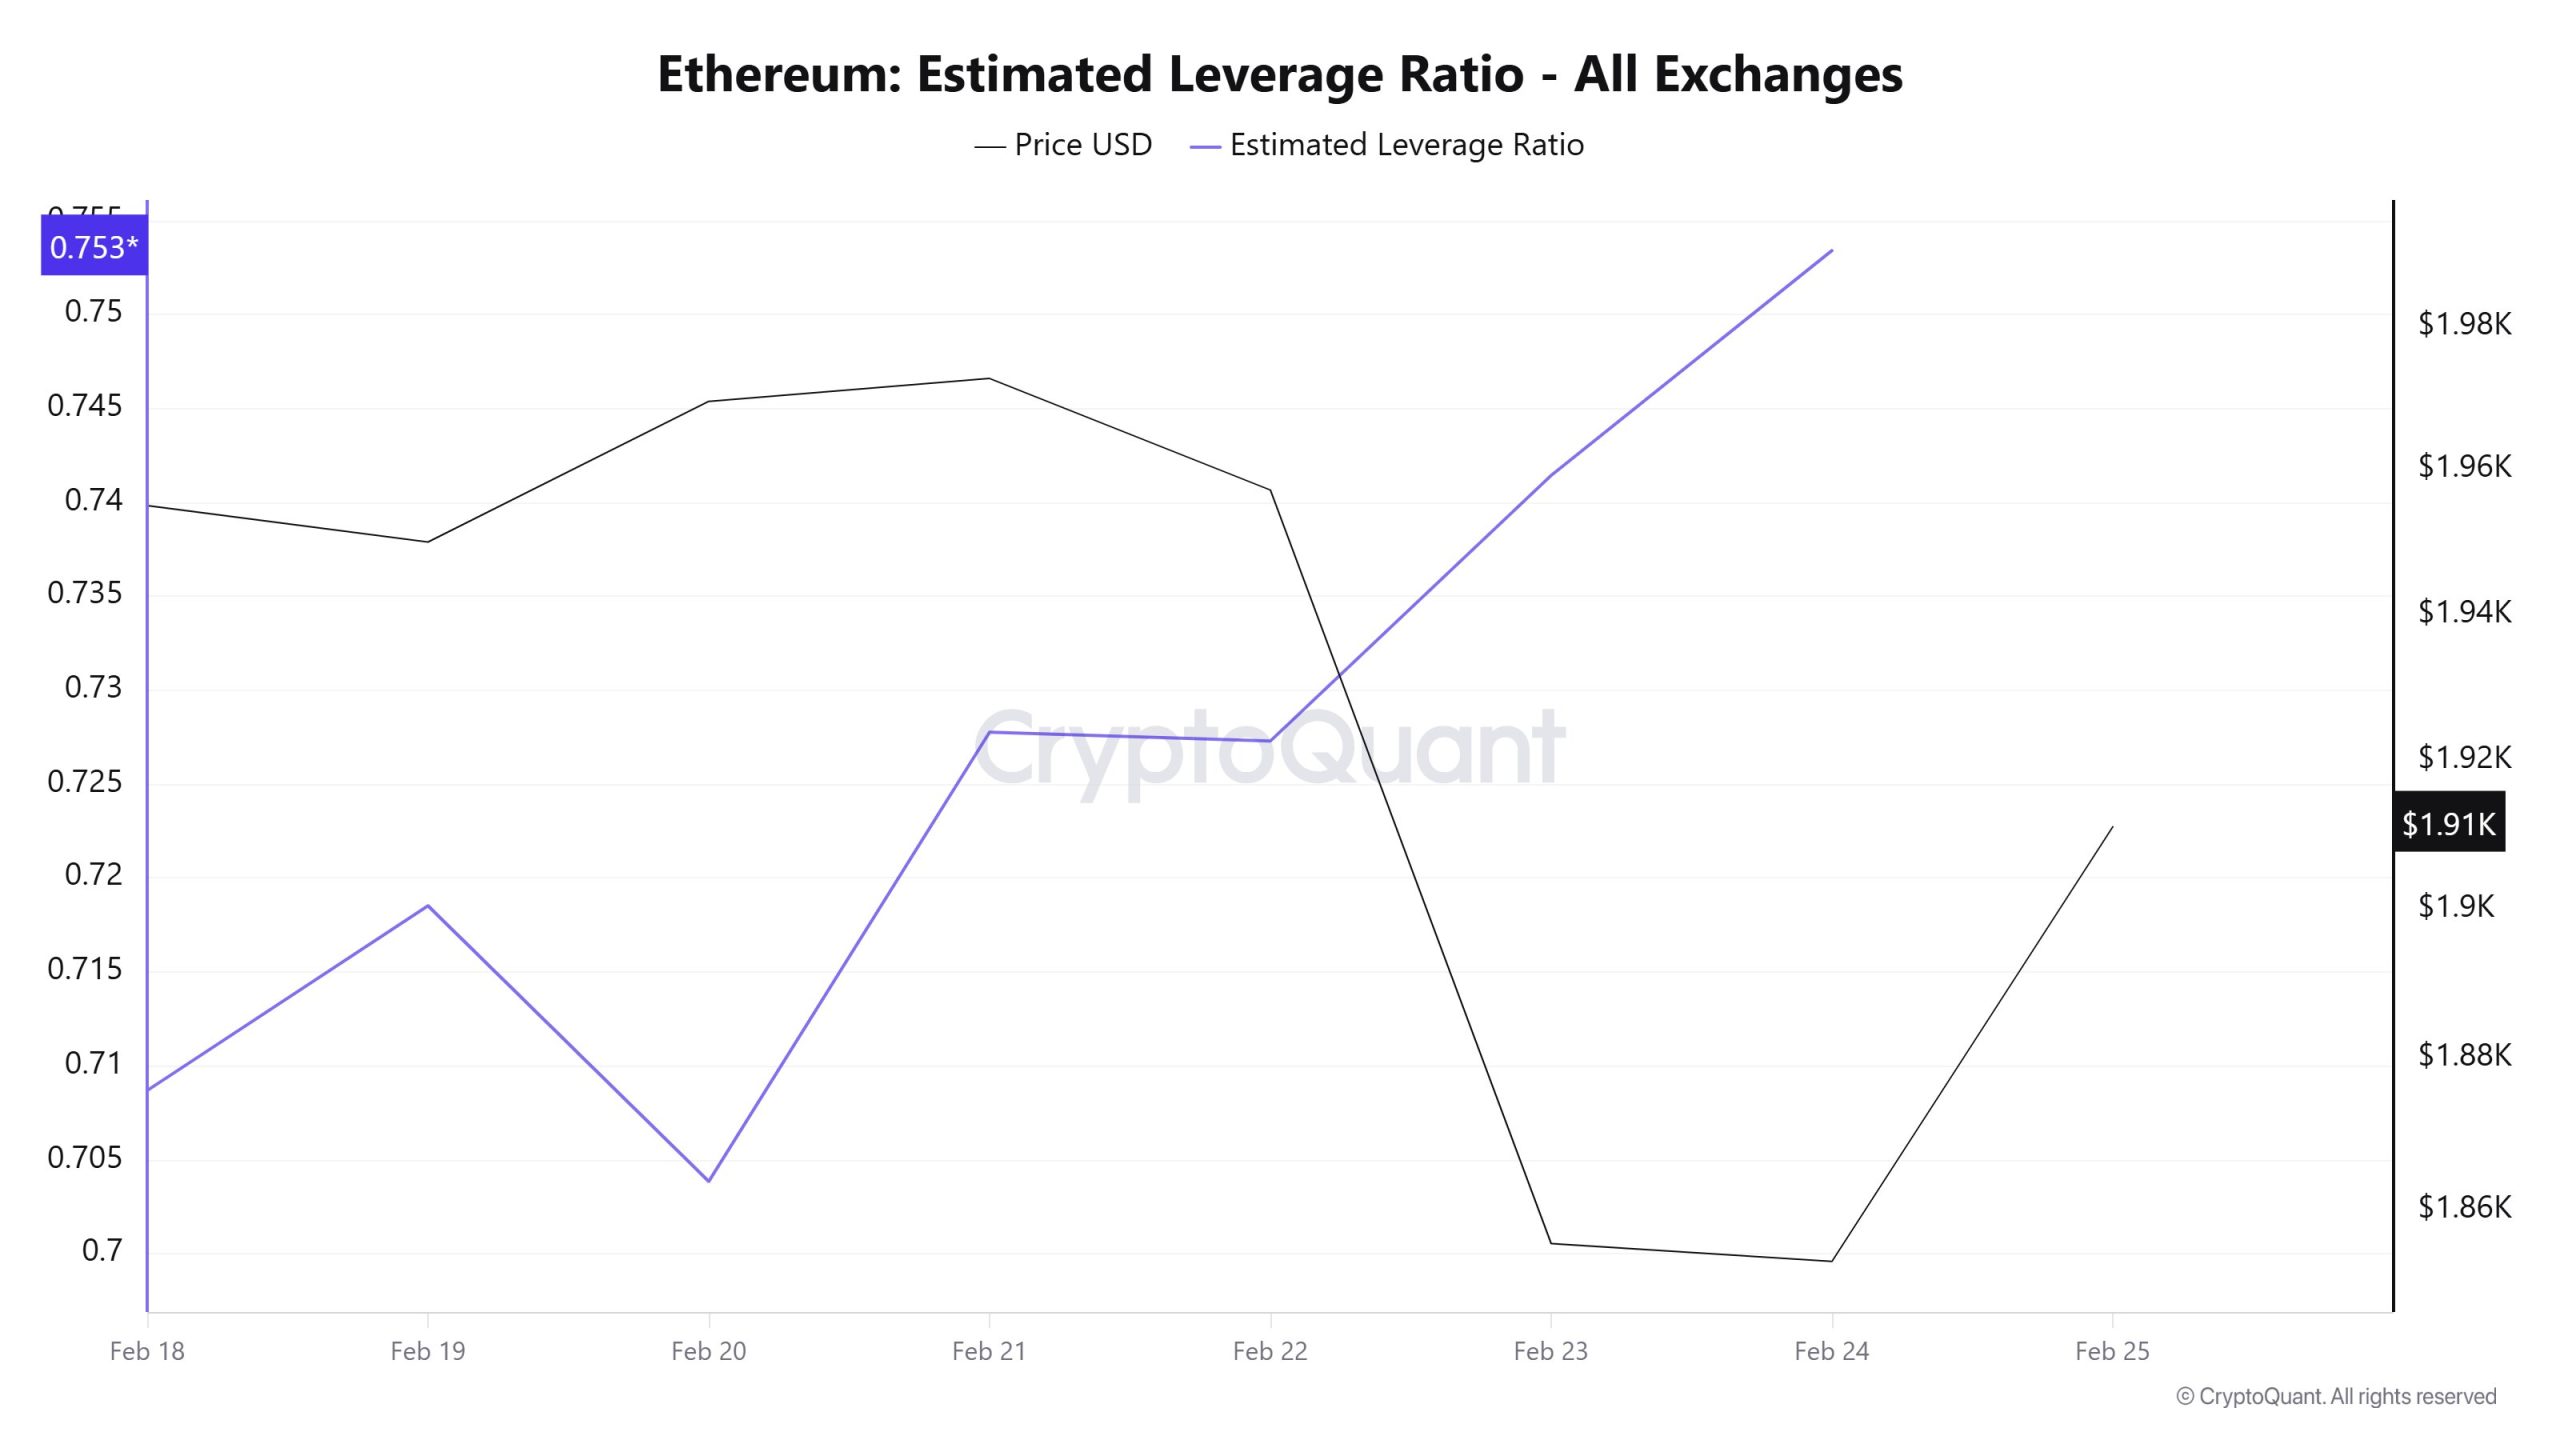
The metric experienced an increase over the 7-day period. Starting at 0.708 on February 18, the first day of the period, the metric rose steadily from that level. Currently at 0.753, the metric is at its highest point. A higher ELR indicates that participants are willing to take on more risk and generally signals bullish conditions or expectations. Uptrends can also be driven by a decrease in reserves. Looking at Ethereum reserves, there were 16.12 million reserves at the start of the process, but this figure remained within a narrow band for the remainder of the process and has now fallen to 16.09 million. At the same time, Ethereum’s open interest was seen at $23.57 billion at the beginning of the process. Currently, the volume has remained flat within a narrow band during the process, and open interest has declined to $23.48 billion. With all this data, the ELR metric experienced an uptrend for most of the process. The asset’s price fluctuated between $1,800 and $2,000 alongside all this data. Ultimately, the horizontal trend in open interest volume and reserves throughout the process indicates that the slight rise in the ELR metric was a bubble. This shows that investors’ risk aversion persists.
Legal Notice
The investment information, comments, and recommendations contained in this document do not constitute investment advisory services. Investment advisory services are provided by authorized institutions on a personal basis, taking into account the risk and return preferences of individuals. The comments and recommendations contained in this document are of a general nature. These recommendations may not be suitable for your financial situation and risk and return preferences. Therefore, making an investment decision based solely on the information contained in this document may not result in outcomes that align with your expectations.
NOTE: All data used in Ethereum on-chain analysis is based on CryptoQuant.
