
Active Addresses
Active Sending Addresses
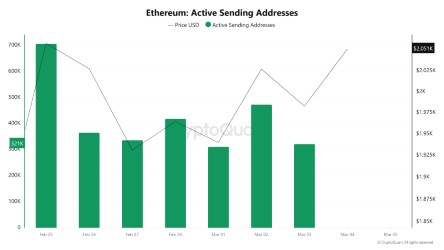
During the week of February 25 – March 3, the number of active sender addresses on the Ethereum network followed a fluctuating trend. The metric rose to around 700,000 at the beginning of the week, then declined significantly over the following days, falling to around 330,000. It rebounded midweek, rising above 400,000, and then surged again around March 2, reaching 470,000. Towards the end of the week, it fell back to around 320,000. The overall picture shows that sender address activity started the week strongly but then took on a more cautious tone.
Active Receiving Addresses
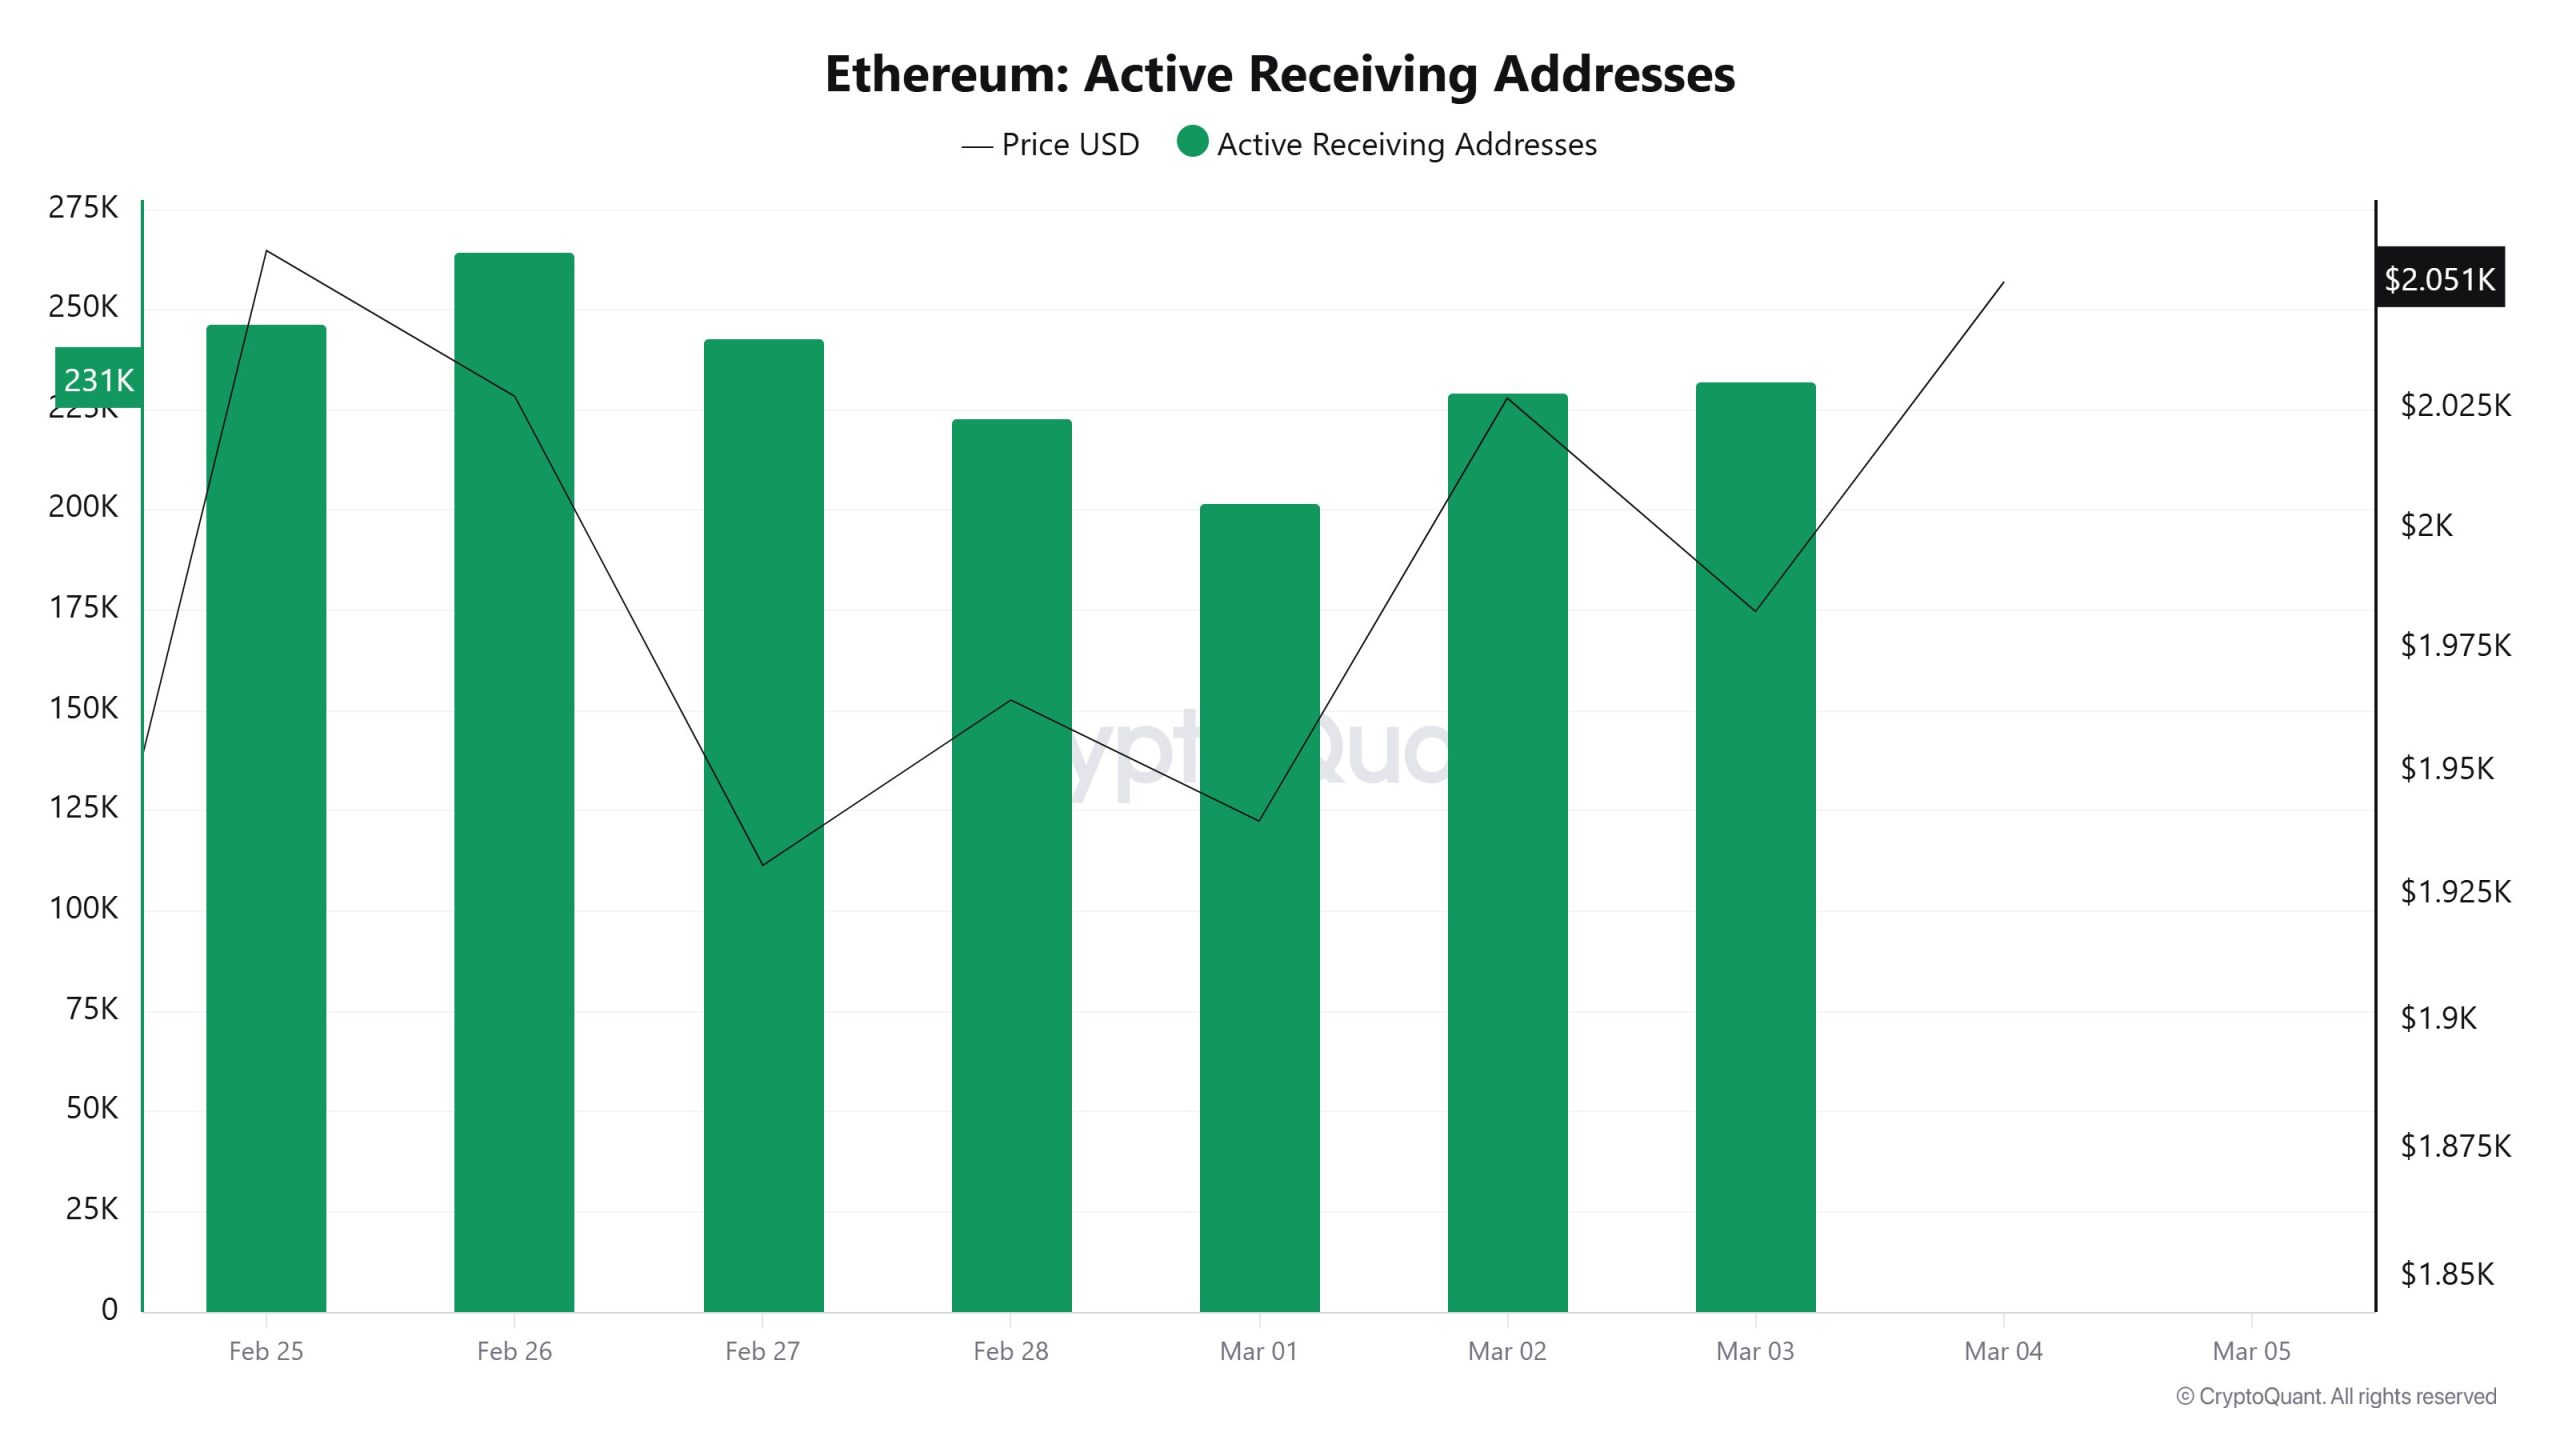
The number of active receiving addresses on the Ethereum network showed a relatively balanced picture throughout the week. The metric, which was around 245,000 on February 25, rose to around 260,000 on February 26. Although there was a brief decline in the following days, it recovered again later in the week, reaching a level close to 230,000.
Total Value Staked
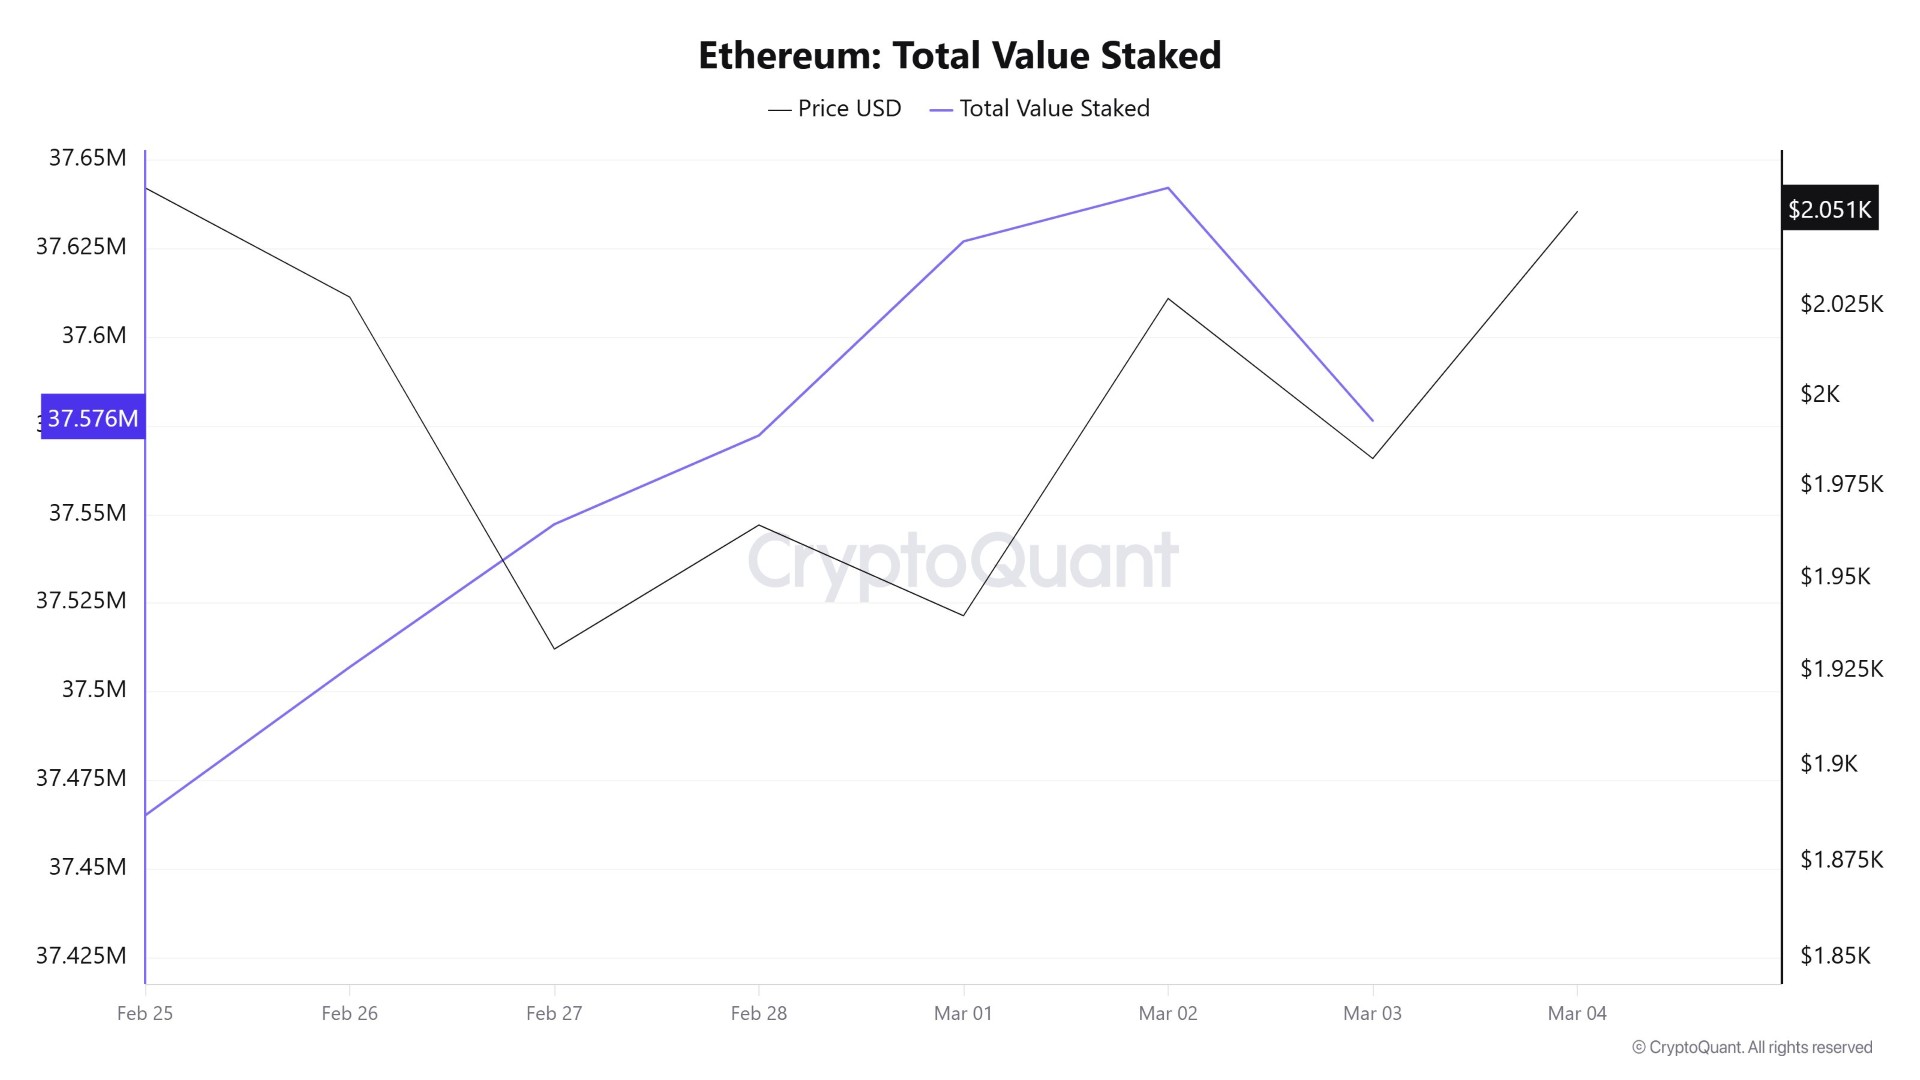
The total amount of ETH staked on the Ethereum network generally maintained an upward trend throughout the week. The total staked amount, which stood at approximately 37.46 million ETH on February 25, gradually increased over the course of the week, reaching 37.64 million ETH around March 2. Although there was a slight pullback towards the end of the week, the total staked amount remains at high levels. This indicates that long-term investors continue to show interest in staking.
Staking Inflows
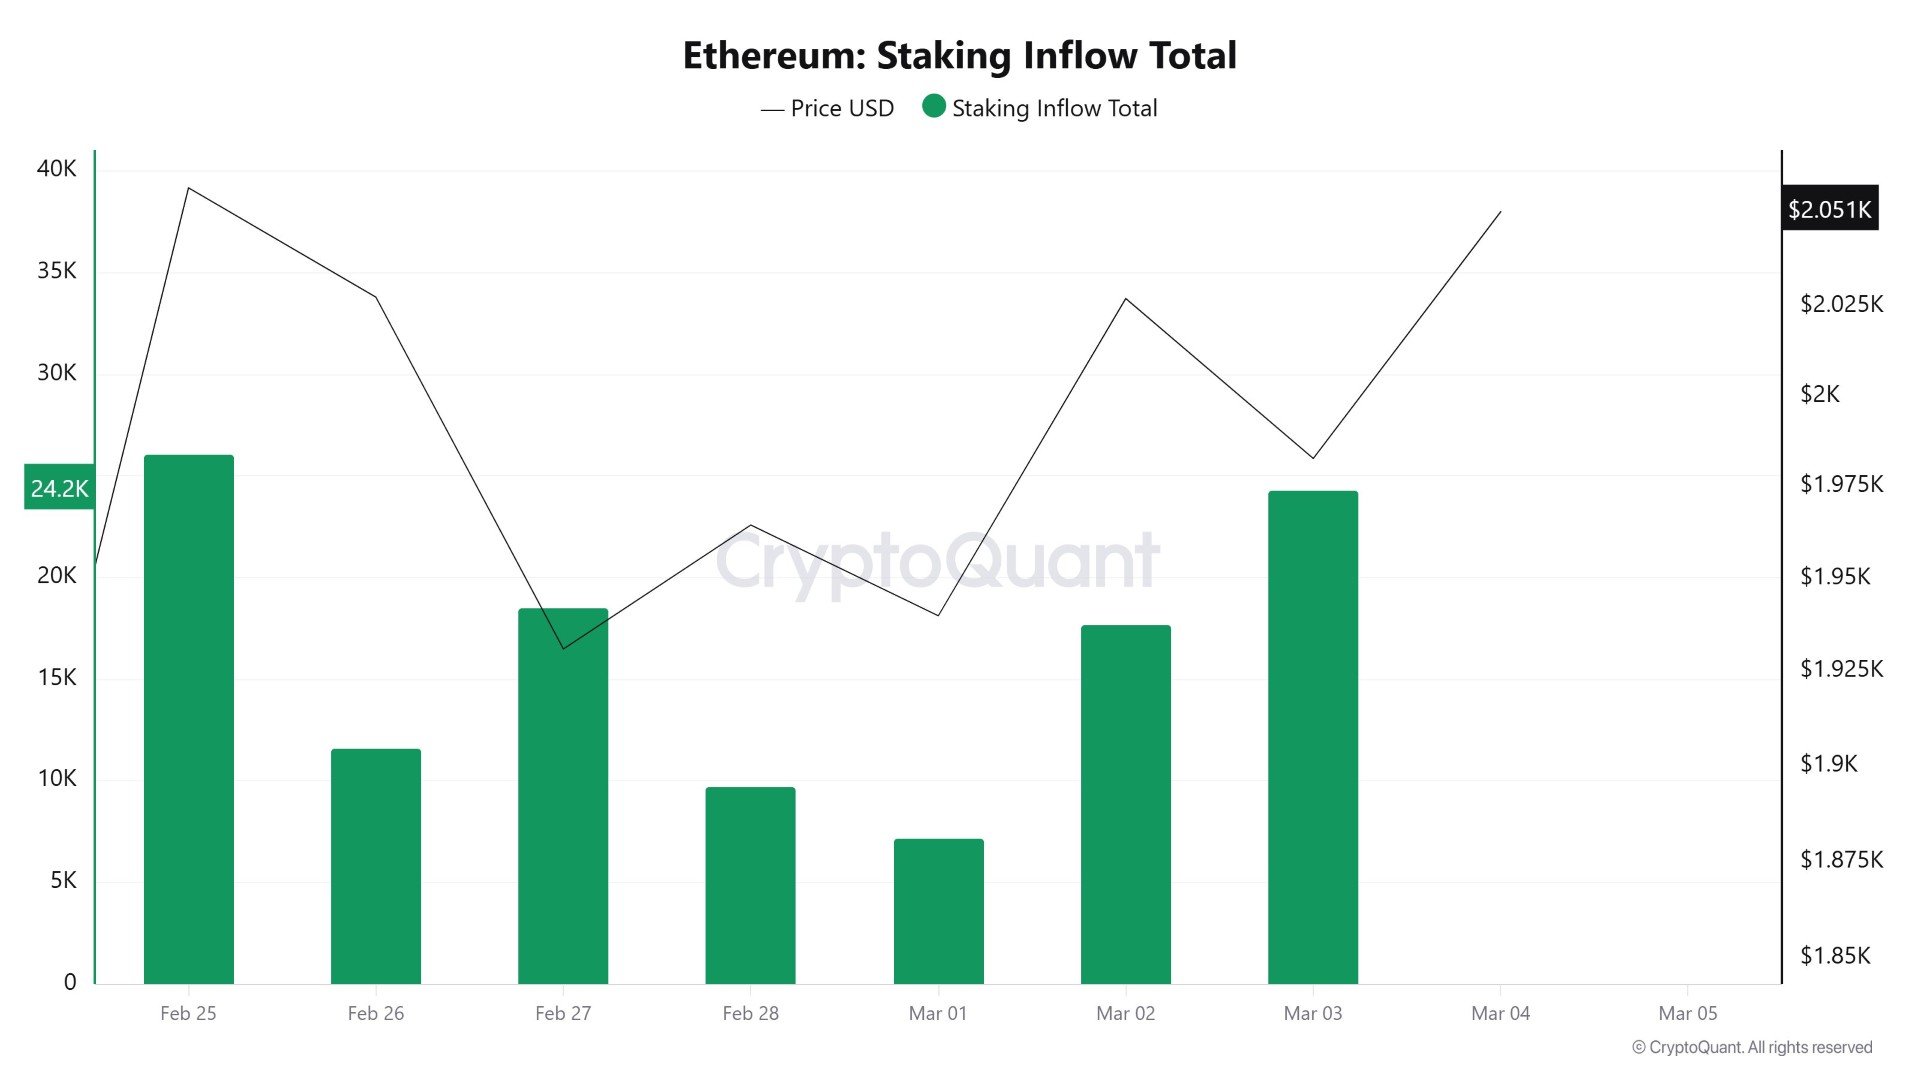
Ethereum staking inflow data fluctuated significantly throughout the week. Inflows, which were around 24,000 ETH at the beginning of the week, fell to around 11,000 on February 26. Although they rose again to 18,000 on February 27, they weakened again in the following days, falling to around 7,000. In the second half of the week, staking inflows rebounded, reaching around 17,000 on March 2 and 23,000 on March 3. This volatility in the indicator shows that while there may be short-term fluctuations in staking, overall interest remains strong.
Derivatives
Open Interest
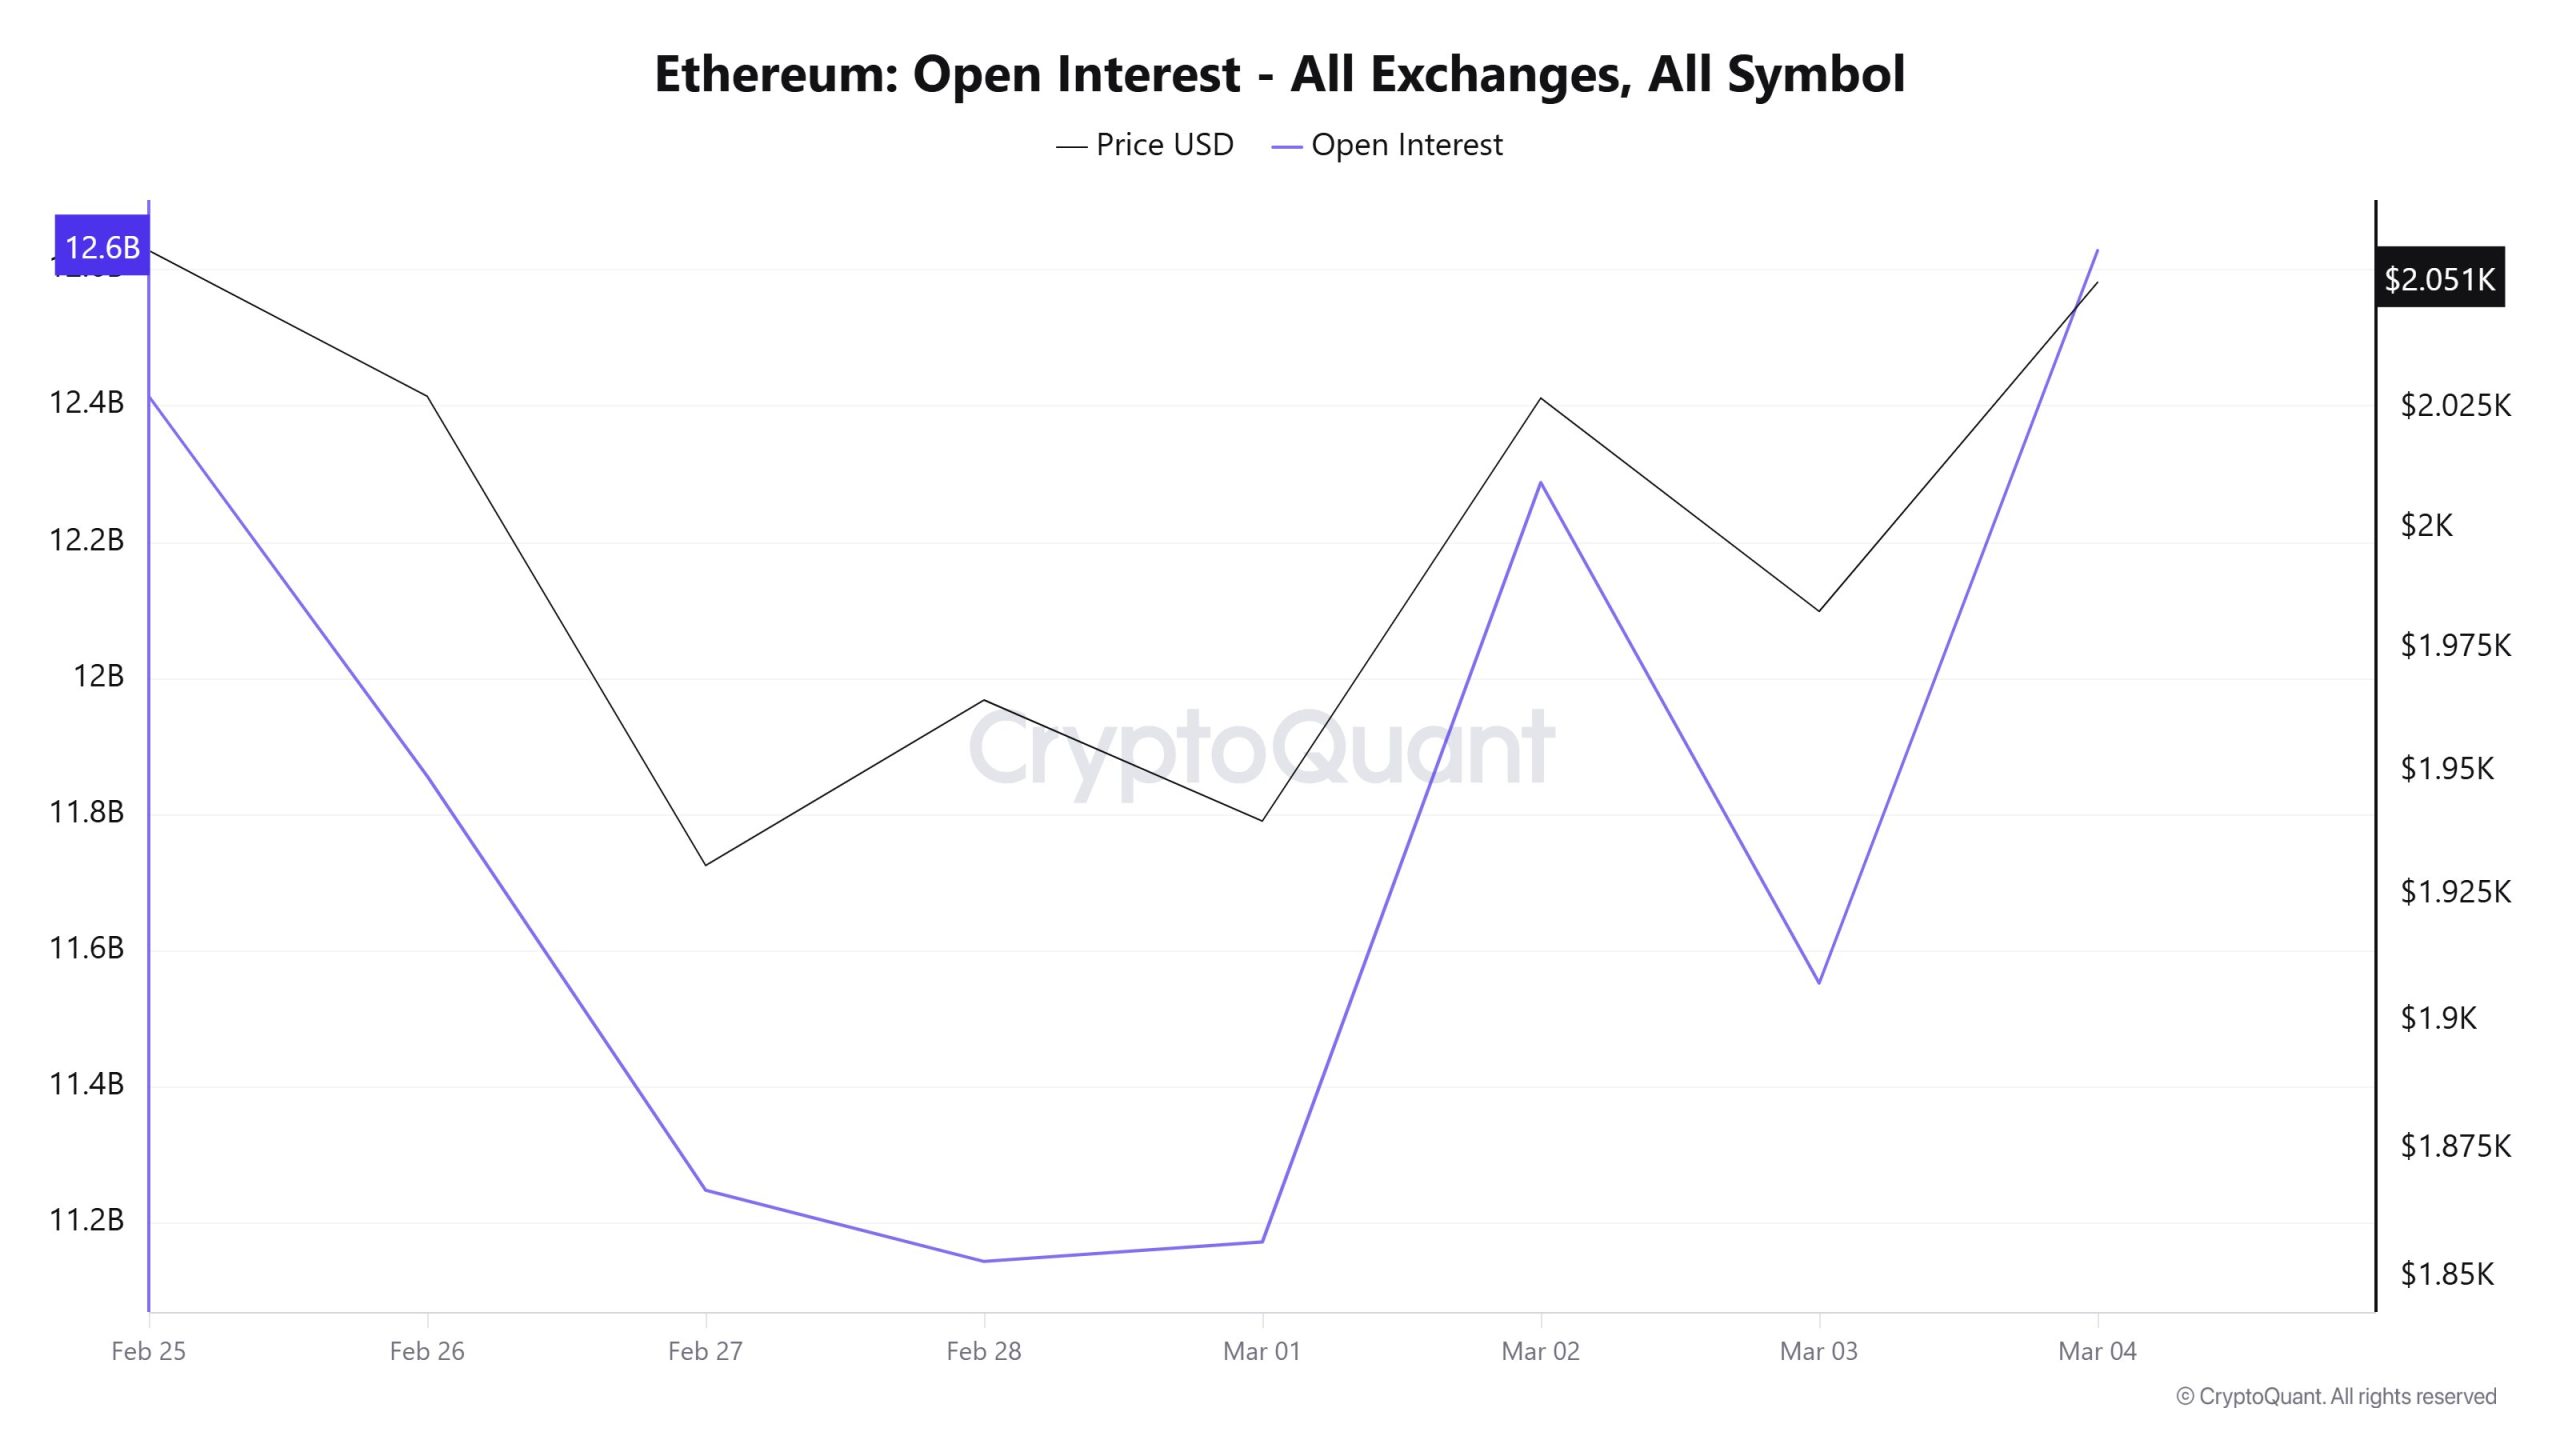
Ethereum open interest data showed a significant decline in the first part of the week. The metric, which stood at around $12.4 billion on February 25, fell to around $11.1 billion on February 28. However, a strong recovery was seen in the second half of the week, and open interest rose again, reaching $12.6 billion by March 4. This increase indicates that new positions are being entered in the derivatives market as prices rise.
Funding Rate
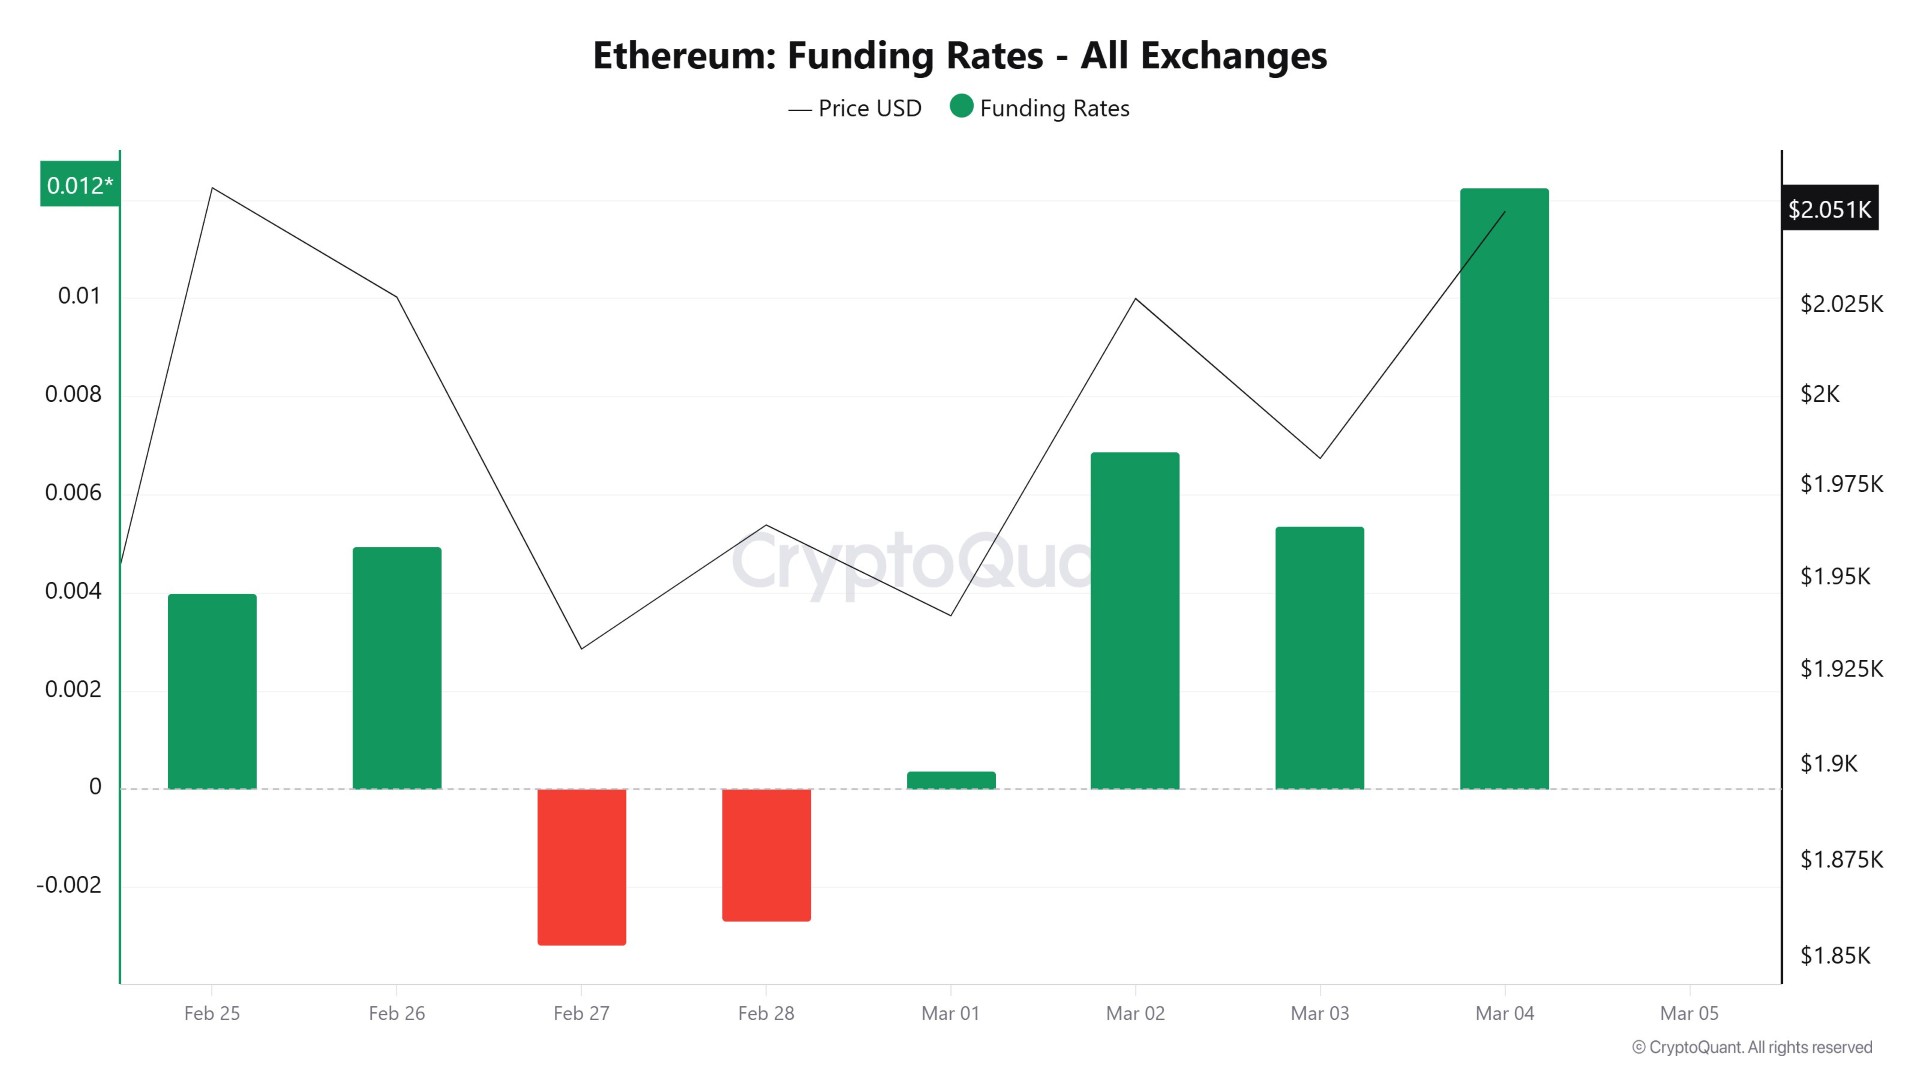
The Ethereum funding rate data showed a volatile pattern throughout the week. Starting in positive territory at the beginning of the week, the funding rate briefly turned negative on February 27 and 28. It then recovered and returned to positive territory, rising significantly toward the end of the week. The funding rate’s return to positive territory indicates that long positions are gaining traction again in the derivatives market.
Long & Short Liquidations
With the ETH price rising from $1,850 to $2,090 last week, a total of approximately $938 million in short positions were liquidated. During the same period, nearly $417 million in long positions were also liquidated.
| Date | Long Amount (Million $) | Short Amount (Million $) |
|---|---|---|
| February 25 | 36.24 | 626.39 |
| February 26 | 50.05 | 33.66 |
| February 27 | 77.70 | 24.30 |
| February 28 | 92.23 | 78.24 |
| March 1 | 65.04 | 55.96 |
| March 2 | 32.81 | 82.24 |
| March 3 | 63.06 | 37.70 |
| Total | 417.13 | 938.49 |
ETH On-Chain Total
| Metric | Positive 📈 | Negative 📉 | Neutral ➖ |
|---|---|---|---|
| Active Addresses | ✓ | ||
| Total Value Staked | ✓ | ||
| Derivatives | ✓ | ||
| Exchange Supply Ratio | ✓ |
*The metrics and guidance provided in the table do not alone explain or imply any expectation regarding future price changes in any asset. Digital asset prices can fluctuate based on numerous variables. The on-chain analysis and related guidance are intended to assist investors in their decision-making process, and basing financial investments solely on the results of this analysis may lead to unfavorable outcomes. Even if all metrics produce positive, negative, or neutral results simultaneously, the expected outcomes may not materialize depending on market conditions. It would be beneficial for investors reviewing the report to take these warnings into consideration.
Legal Notice
The investment information, comments, and recommendations contained in this document do not constitute investment advisory services. Investment advisory services are provided by authorized institutions on a personal basis, taking into account the risk and return preferences of individuals. The comments and recommendations contained in this document are of a general nature. These recommendations may not be suitable for your financial situation and risk and return preferences. Therefore, making an investment decision based solely on the information contained in this document may not result in outcomes that align with your expectations.
NOTE: All data used in Ethereum on-chain analysis is based on CryptoQuant.
