
Fear & Greed Index
Source: Alternative.me
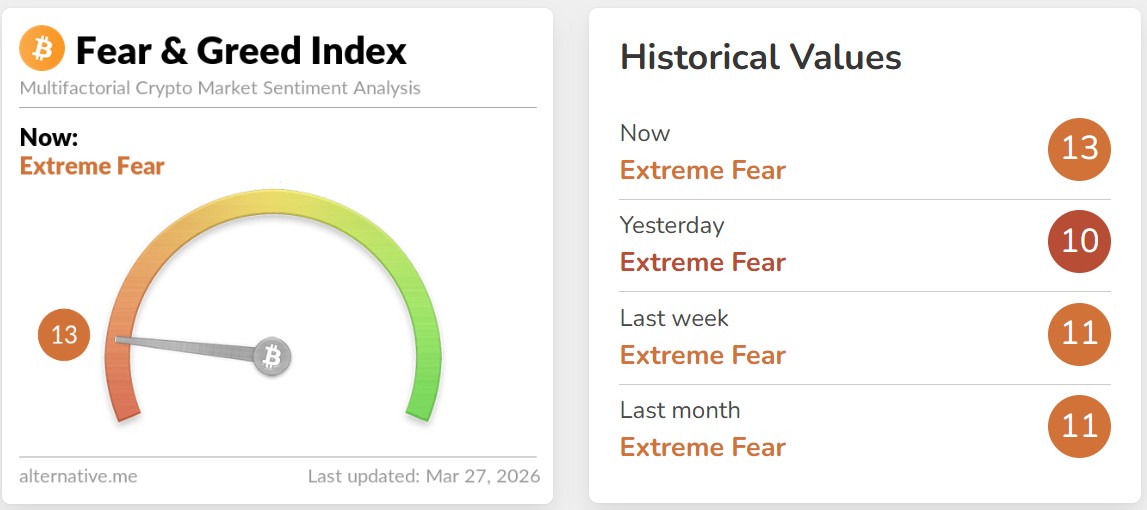
- Change in Fear and Greed Level: +2
- Last Week’s Level: 11
- This Week’s Level: 13
The Fear and Greed Index rose from 11 last week to 13 this week, indicating a slight improvement in investor sentiment. Despite this increase, the index remains firmly in the “extreme fear” zone, showing that overall market sentiment is still weak. Compared to the previous week, the rise suggests that selling pressure has eased marginally, but a strong shift in sentiment has not yet formed.
Looking at the recent trend, the index continues to hover at low levels, signaling that market participants remain cautious and risk appetite is still limited. Although there is a minor recovery, this move appears more like a stabilization rather than the beginning of a strong sentiment reversal.
The relationship between Bitcoin price action and the index remains consistent. The slight uptick suggests that buying interest has started to reappear at lower levels, but it is not yet strong enough to drive a sustained upward move. Institutional flows may be providing partial support, but the overall structure still reflects a fragile market environment.
In the short term, a move toward the 20 level would be the first sign that sentiment is meaningfully improving. However, as long as the index stays below this threshold, cautious behavior is likely to dominate. A drop back toward the 10 level could indicate renewed weakness and continued pressure on the market.
Fund Flows
Source: Coinshares
Overview:
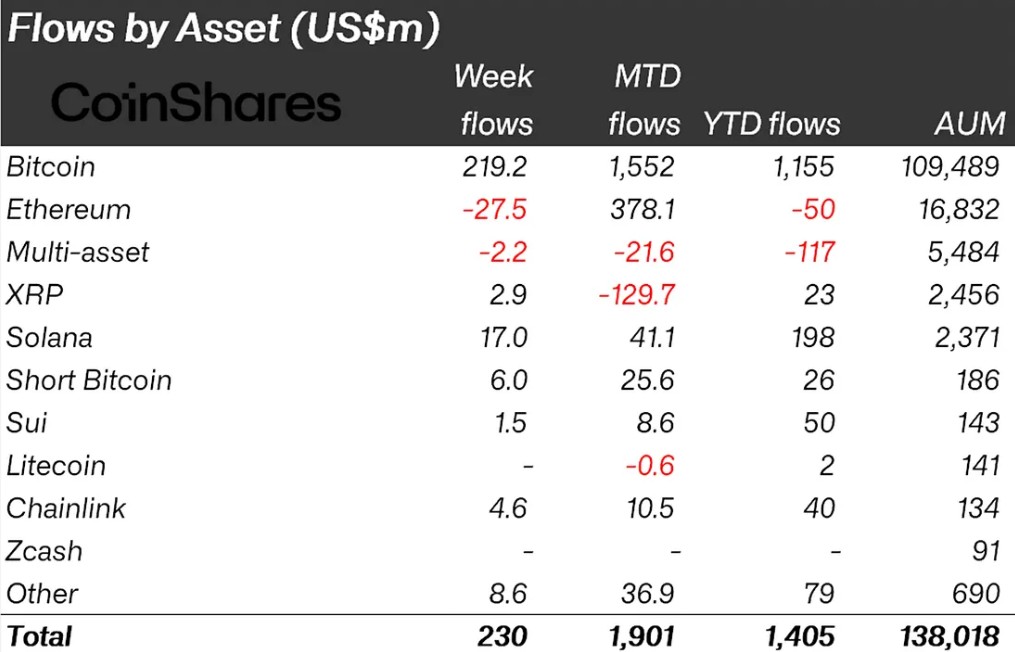
Crypto asset investment products saw moderate inflows this week, though the strength of flows weakened compared to the previous period. According to CoinShares data, institutional interest remains primarily focused on Bitcoin, while Ethereum and some multi-asset products experienced outflows. The overall structure shows a more selective and cautious allocation trend.
Weekly total inflows: $230 million
MTD (Month-to-date): +$1.901 billion
YTD (Year-to-date): +$1.405 billion
The majority of weekly fund inflows once again flowed into Bitcoin.
Bitcoin weekly inflows: $219.2M – Institutional demand remains concentrated on Bitcoin, continuing to dominate overall flows. Total yearly inflows remain strong at $1.155B.
Ethereum weekly flow: -$27.5M – Ethereum saw a return to outflows this week, indicating that the recent recovery attempt has weakened. The YTD figure remains negative at -$50M, showing continued pressure.
Solana weekly inflow: $17.0M – Positive flows continue on the Solana side, maintaining its strong yearly performance with $198M YTD inflows.
XRP weekly inflow: $2.9M – A modest inflow was recorded this week, but the negative MTD figure of -$129.7M indicates that broader selling pressure has not fully reversed.
Other assets:
• Short Bitcoin: +$6.0M
• Sui: +$1.5M
• Chainlink: +$4.6M
• Multi-asset: -$2.2M
• Litecoin: No weekly flow, MTD remains slightly negative
The overall picture shows that institutional capital is heavily concentrated in Bitcoin, while Ethereum and some diversified products continue to face outflows. Altcoins are seeing selective inflows, but the market still reflects a cautious and uneven risk appetite.
Total Market Cap
Source: TradingView
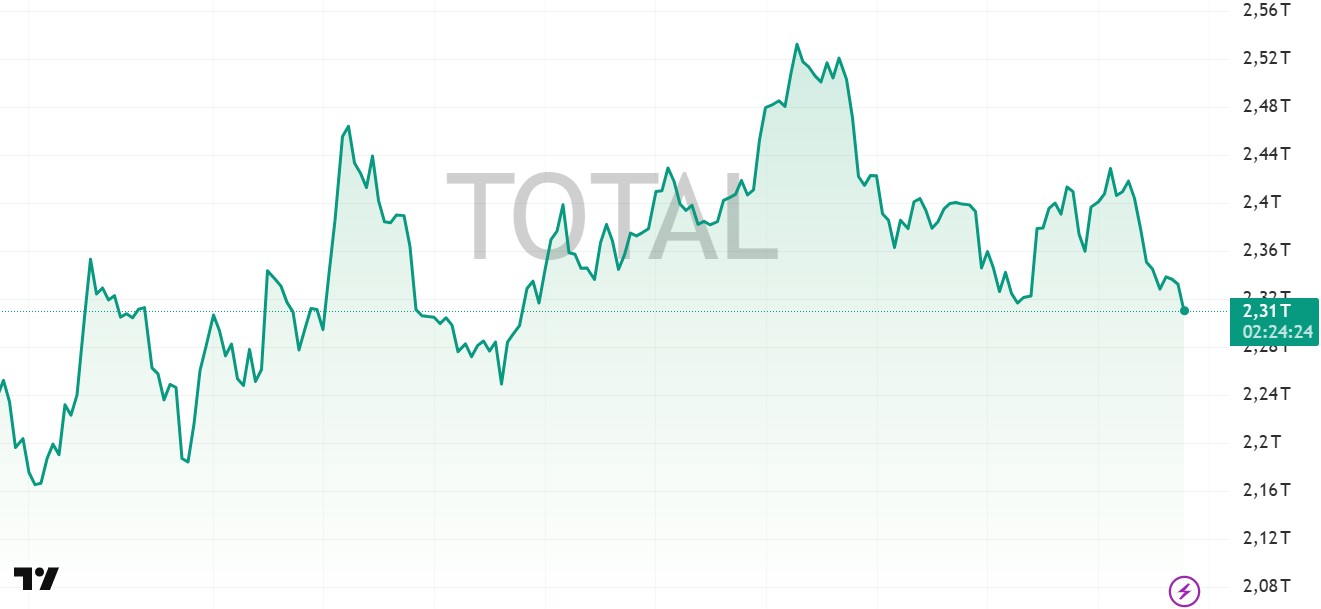
- Market Capitalization Last Week: $2.39 Trillion
- Market Capitalization This Week: $2.31 Trillion
The cryptocurrency market showed a weakening trend this week, with total market capitalization declining from 2.39 trillion USD to approximately 2.31 trillion USD. Although there were short-term recovery attempts during the week, these moves remained limited and were met with selling pressure. The weekly high was recorded around 2.45 trillion USD, while the low was approximately 2.28 trillion USD. The overall structure indicates that the market is struggling to sustain upward momentum and remains under pressure.
Total 2
The Total 2 index started the week near the 990 billion USD level but followed a downward trajectory throughout the period. Despite brief upward reactions, these remained weak, and the index gradually declined, currently standing at approximately 955 billion USD. The weekly high was around 1.00 trillion USD, while the low was close to 930 billion USD. This structure shows that although altcoins attempt to hold certain levels, selling pressure continues to dominate.
Total 3
The Total 3 index began the week around 720 billion USD and exhibited a similar pattern of lower highs and gradual decline. While there were intermittent recovery attempts, these were not strong enough to reverse the trend. The index peaked near 740 billion USD during the week but later pulled back and is currently hovering around 708 billion USD. The weekly low was recorded near 700 billion USD. Compared to Total 2, volatility remains relatively higher, indicating continued sensitivity in mid-cap and smaller altcoins.
Looking at the overall picture, both Total 2 and Total 3 indices reflect ongoing weakness in the altcoin market. The inability to maintain upward moves and the consistent selling pressure suggest that the market has not yet entered a stable recovery phase. The volatility ranking remains “Total 3 > Total 2 > Total,” indicating that while risk appetite still exists in altcoins, price fluctuations and downside risks continue to be more pronounced in this segment.
Bitcoin Dominance
Source: Tradingview
Weekly Change
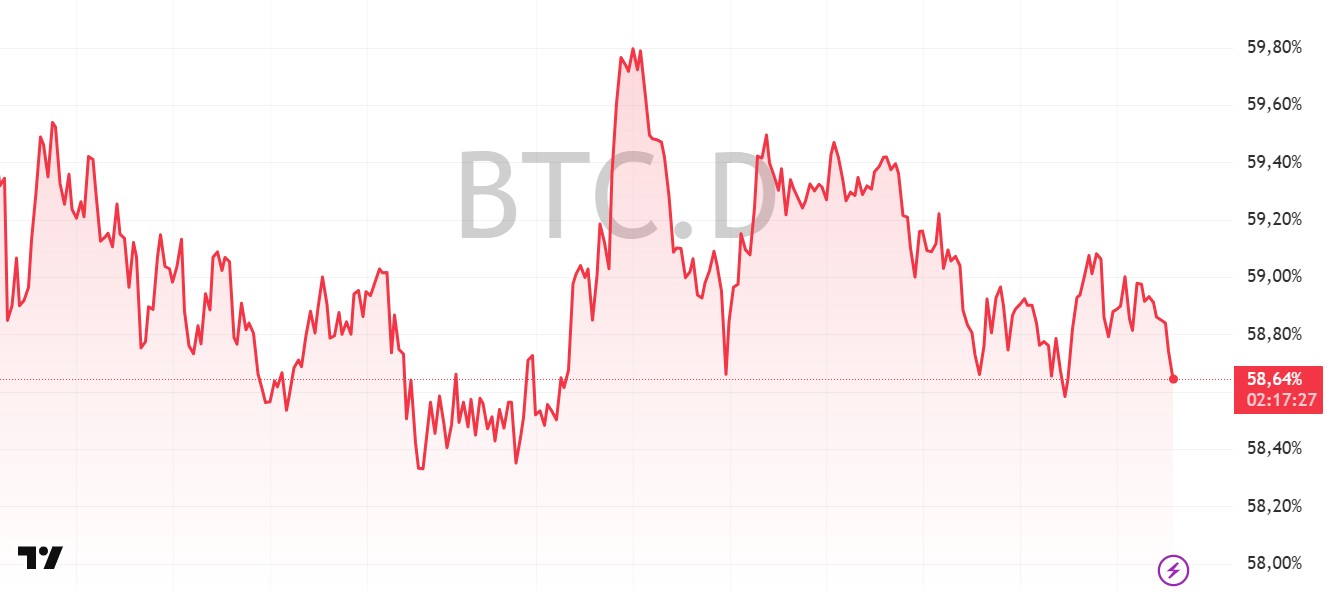
- Last Week’s Level: 58.70%
- This Week’s Level: 58.64%
Bitcoin dominance started the week around the 58.90%–59.00% range and initially showed a mild recovery attempt. With this move, dominance briefly pushed toward the 59.70%–59.80% band, marking the highest levels of the week. However, this upward move did not sustain, and selling pressure quickly followed.
After this peak, dominance entered a gradual downtrend. Throughout the second half of the week, lower highs became more visible, and the ratio declined steadily toward the 58.50% region. Currently, dominance is hovering around 58.60%, indicating a slight overall weekly decrease.
This structure suggests that Bitcoin maintained relative strength in the early part of the week, but altcoins began to gain traction as the week progressed. The failure to hold above the 59.50% region shows that Bitcoin’s market control has weakened slightly in the short term.
From a broader perspective, while there is a partial shift in risk appetite toward altcoins, the move remains limited. A strong and sustained altcoin trend has not yet formed, and Bitcoin still holds a dominant position in the market.
Technically, the 58.40%–58.50% range continues to act as a key short-term support zone. On the upside, the 59.50%–60% band remains a strong resistance area. As long as these levels hold, dominance is likely to continue moving within this range-bound structure in the near term.
Bitcoin Spot ETF
Source: Darkex Research Department
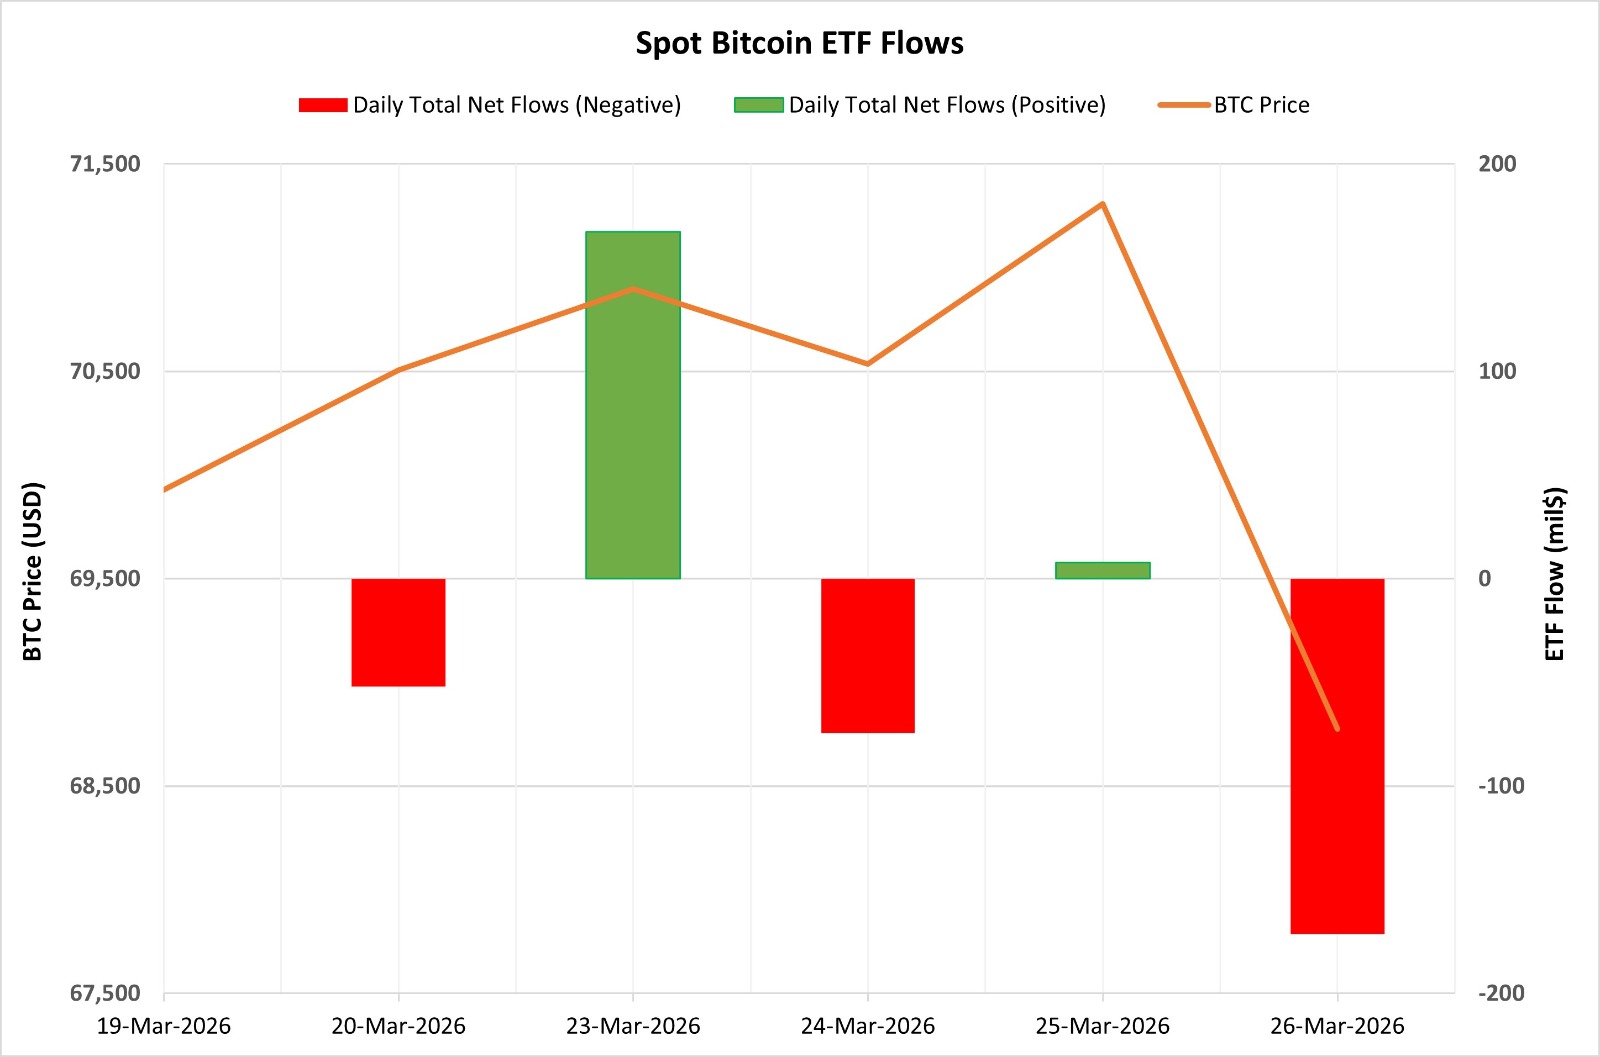
Between March 20 and 26, 2026, there was a total net outflow of $122.8 million from Spot Bitcoin ETFs. While no clear direction of net flows emerged during this period, the overall trend was negative. Although a strong recovery was observed on March 23 with a net inflow of $167.2 million, the outflows in the following days were decisive in resulting in a negative outcome for the period. During this period, institutional investors maintained a cautious stance. With these developments, the cumulative total net inflow of Spot Bitcoin ETFs fell to $56.13 billion by the end of the 551st trading day.
| Date | Coin | Price | ETF Flow (mil$) | ||
|---|---|---|---|---|---|
| Open | Close | Change % | |||
| 20-Mar-2026 | BTC | 69,927 | 70,505 | 0.83% | -52 |
| 23-Mar-2026 | BTC | 67,864 | 70,897 | 4.47% | 167.2 |
| 24-Mar-2026 | BTC | 70,897 | 70,535 | -0.51% | -74.5 |
| 25-Mar-2026 | BTC | 70,535 | 71,307 | 1.09% | 7.8 |
| 26-Mar-2026 | BTC | 71,307 | 68,774 | -3.55% | -171.3 |
| Total (20–26 Mar 2026) | — | — | — | -1.65% | -122.80 |
On the price front, Bitcoin opened at $69,927 on March 20 and closed at $68,774 on March 26. During this period, the BTC price declined by 1.65%. The sharp 3.55% pullback observed particularly on the last trading day coincided with heavy outflows from ETFs. The correlation between price movements and ETF flows has strengthened again. Overall, this period revealed a pattern where inflows into ETFs were unsustainable and outflows began to accelerate once more. In the coming period, a recovery in the Bitcoin price could be seen if strong and stable inflows resume in the ETF sector. However, if the current trend of negative outflows persists, downward pressure and volatility are likely to continue.
Spot Ethereum ETF
Source: Darkex Research Department
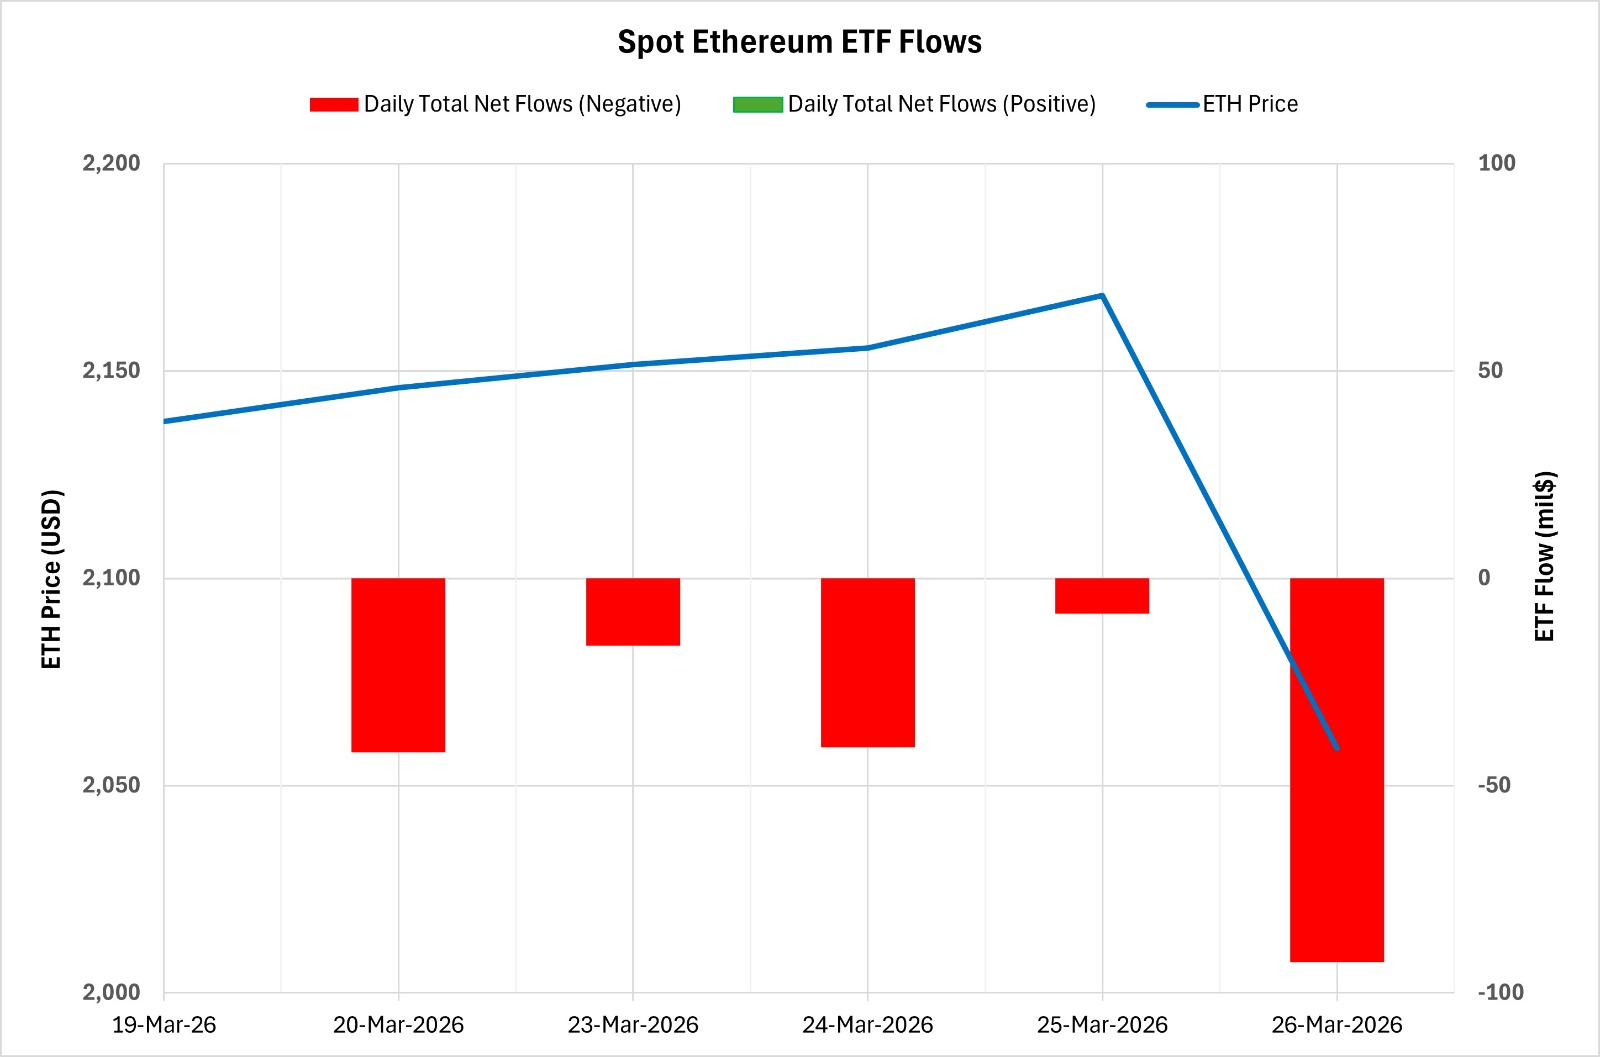
Between March 20 and 26, 2026, there was a total net outflow of $199.9 million from spot Ethereum ETFs. It was notable that negative flows were observed on all trading days during this period, and the streak of negative flows extended to seven days. In particular, the net outflow of $92.5 million on March 26 stood out as the week’s sharpest move and was the decisive factor in the total. Looking at individual funds, BlackRock’s ETHA saw the largest net outflow of $245.8 million. Fidelity’s FETH saw a net inflow of $106.7 million, which was notable, but these inflows were insufficient to turn the overall picture positive. With these developments, the cumulative total net inflow for Spot Ethereum ETFs fell to $11.60 billion by the end of the 421st trading day.
| Date | Coin | Price | ETF Flow (mil$) | ||
|---|---|---|---|---|---|
| Open | Close | Change % | |||
| 20-Mar-2026 | ETH | 2,138 | 2,146 | 0.38% | -42 |
| 23-Mar-2026 | ETH | 2,054 | 2,152 | 4.75% | -16.2 |
| 24-Mar-2026 | ETH | 2,152 | 2,156 | 0.19% | -40.7 |
| 25-Mar-2026 | ETH | 2,156 | 2,168 | 0.59% | -8.5 |
| 26-Mar-2026 | ETH | 2,168 | 2,059 | -5.04% | -92.5 |
| Total (20–26 Mar 2026) | — | — | — | 1.43% | -199.9 |
On the price front, Ethereum opened at $2,138 on March 20 and closed at $2,059 on March 26. During this period, the ETH price rose by 1.43%. Notably, the strong 4.75% surge observed on March 23 occurred despite outflows from ETFs, indicating that the price movement was largely driven by the spot market. Overall, this period presented a picture where price movements and ETF flows diverged significantly. Although the price managed to close the week with a modest gain despite continuous ETF outflows, indicating a short-term resilient structure, the synchronized weakening observed in recent days drew attention. In this environment where institutional investors continue to sell, pressure on the price could increase if ETF outflows persist. Conversely, if strong and steady inflows resume in the ETF sector, a healthier and more sustainable recovery in the Ethereum price could be observed.
Legal Notice
The investment information, comments, and recommendations contained in this document do not constitute investment advisory services. Investment advisory services are provided by authorized institutions on an individual basis, taking into account each person’s risk and return preferences. The comments and recommendations contained in this document are of a general nature. These recommendations may not be suitable for your financial situation or your risk and return preferences. Therefore, making an investment decision based solely on the information contained in this document may not result in outcomes that align with your expectations.
