
Fear & Greed Index
Source: Alternative.me
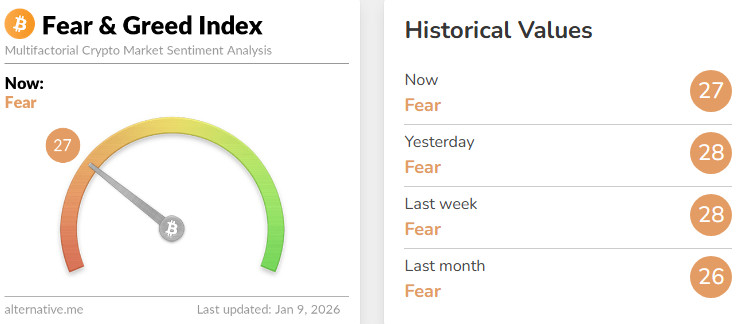
Change in Fear and Greed Value: -1
Last Week’s Level: 28
This Week’s Level: 27
The Fear and Greed Index fell from 28 to 27 this week, indicating that sentiment remains in the fear zone and high sensitivity to major news flows persists. On the crypto side, the clearest impact on the index came from the rapid shift in US spot Bitcoin ETF flows. Strong net inflows seen at the beginning of the week fueled perceptions of recovering institutional demand, improving risk appetite. However, flows then turned sharply negative for two consecutive days, highlighting profit-taking and position reduction behavior in sentiment. On the US macro front, the weak manufacturing outlook weighed on risk sentiment, while stronger-than-expected service activity and the return of employment growth to expansion tempered expectations of rapid easing in the interest rate path, limiting a sustained strengthening of appetite in crypto. Although the ADP private sector employment increase falling below expectations supported the cooling narrative, weekly jobless claims remaining at low levels did not fuel fears of a sharp deterioration and caused the market to focus on the upcoming employment data. Additionally, the split in votes seen in the Fed discount rate minutes emerged as a headline that increased uncertainty about the policy path, limiting the strengthening of sentiment.
Crypto Fund Flows
Source: Coinshares
Overview
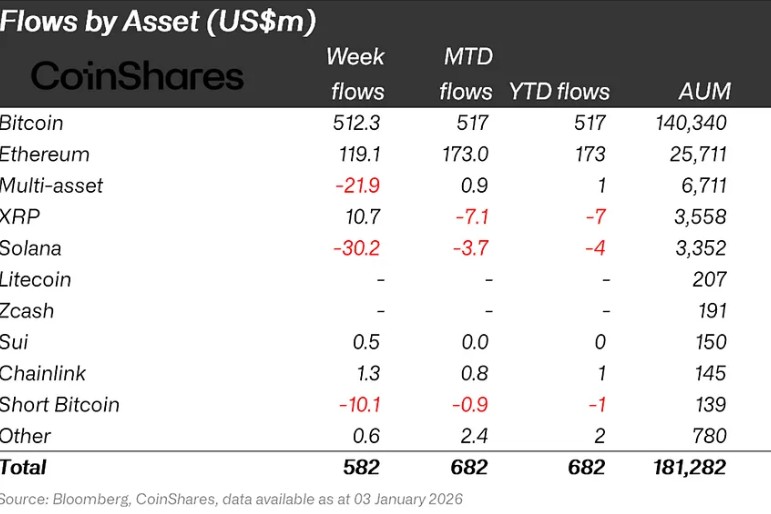
Crypto markets experienced a week marked by the US operation in Venezuela. Bitcoin and altcoins saw limited sideways movement. As a result, Bitcoin gained approximately 1% in value over the week.
- Bitcoin (BTC): Bitcoin saw inflows from investors this week. Bitcoin-focused funds saw inflows of $512.3 million.
- Ethereum (ETH): Along with spot ETH inflows, Ethereum saw $119.1 million in inflows this week.
- Chainlink (LINK): Chainlink saw inflows of $1.3 million.
- Ripple (XRP): XRP saw $70.2 million in fund inflows this week.
- SUI: Sui saw inflows of $0.5 million.
- Other: Sector-specific and project-based declines in altcoins, along with the overall market sentiment, brought about $1.2 million in inflows in the fund flow data.
Fund Outflows:
- Solana (SOL): Solana saw an outflow of 30.2 million dollars.
- Short Bitcoin: Short Bitcoin saw an outflow of $10.1 million.
- Multi-asset: Outflows were observed in the multi-asset group.
Total MarketCap
Source: Tradingview
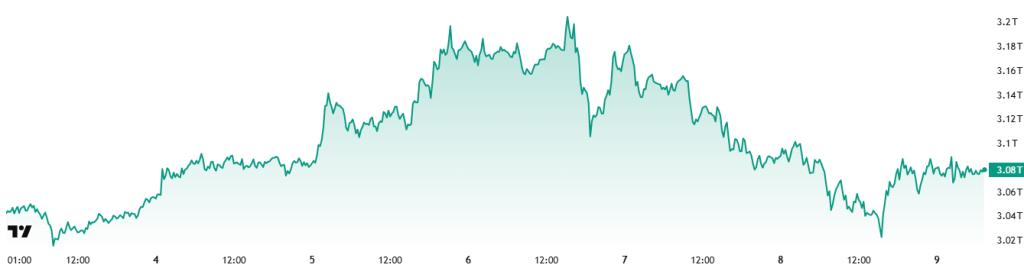
- Last Week’s Market Value: $3.09 Trillion
- This Week’s Market Value: $3.08 Trillion
This week, the cryptocurrency market recorded a decline of approximately $12.75 billion, falling 0.41%, with a total market value of $3.08 trillion. The week’s high was $3.21 trillion, while the low was $3.02 trillion. Thus, the market was seen moving within a $196 billion band, indicating a period-based volatility of 6.12%. The aggressive increase in volatility compared to last week’s 6.4% range is noteworthy. The renewed increase in volatility, which has been below the weekly average candle size scale in the crypto market, may indicate that the stagnation that has lasted for several weeks is coming to an end and that the market may return to its normal, high-volatility flow.
Total 2
Starting the week with a market value of $1.26 trillion, the Total 2 index lost approximately $2.7 billion in value over the week, falling 0.22%, and ended the period at around $1.25 trillion. The weekly high was $1.33 trillion, while the low was $1.23 trillion. The index fluctuating within a $100 billion band corresponds to a volatility of approximately 7.05% for the period. With this outlook, Total 2 continues to trade approximately $508 billion below its all-time high. The required rate of increase to reach its previous peak from current levels is calculated to be approximately 40.32%.
Total 3
Starting the week with a total market value of $883.19 billion, the Total 3 index grew by approximately $0.138 billion during the week, rising by 0.02% and closing the period at $883.33 billion. Volatility between the week’s highest and lowest values was 7.27%. With this outlook, Total 3 demonstrated a relatively high volatility structure, outperforming other indices in terms of both volatility and positive closing during the period in question.
The index-volatility ranking of “Total 3 > Total 2 > Total” shows that volatile price movements were primarily concentrated in altcoins, followed by the average volatility observed in Ethereum and Bitcoin, respectively. In addition, it is noteworthy that Ethereum experienced a limited decline in its total market share during the current period.
Altcoin Season Index
Source: Coinmarketcap
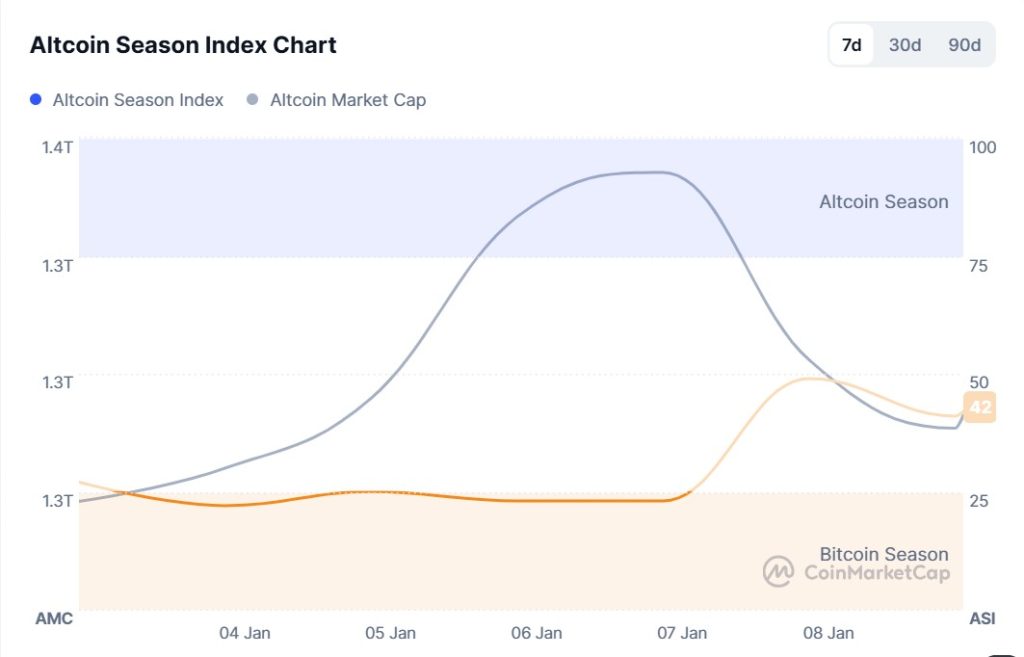
- Last Week’s Index Value: 23/100
- This Week’s Index Value: 42/100
January 2 – January 9, 2026, saw an increase in the correlation between altcoin market dominance (Altcoin Market Cap) and the Altcoin Season Index. The chart shows that this week, on January 7 , the index rose to 49, with Altcoin Market Cap reaching 1.30T. This indicates an upward trend in the market dominance of altcoins. When the index rose this week, the top 5 coins leading the rise were MYX, ZEC, Virtual, XMR, and JST. The Altcoin Season Index shows that the total market value of altcoins experienced a relative increase compared to Bitcoin this week.
Bitcoin Dominance
Source: Tradingview
Weekly Change
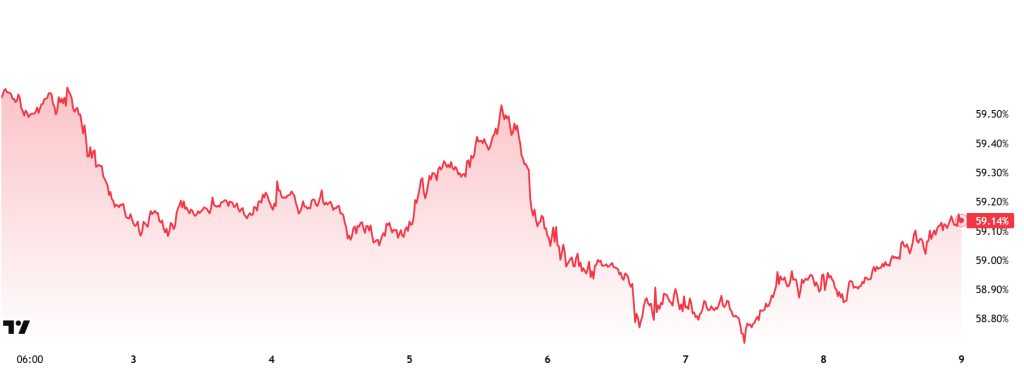
- Last Week’s Level:54%
- This Week’s Level:14%
Bitcoin dominance started the week at 59.14%, fell back to 58.70% during the week, but then rose slightly and is currently at 59.14%. This week, Strategy purchased 1,286 Bitcoin and Strive purchased 101.8 Bitcoin. Additionally, data on Bitcoin spot ETFs shows a net outflow of $431 million to date. Weekly data indicates that Strategy, the world’s largest treasury company, continues to buy Bitcoin, but these purchases are on a more limited scale compared to the previous week. This outlook points to a cautious reduction in positions rather than a complete withdrawal on the institutional side. While the wait-and-see approach that prevailed in previous weeks is partially maintained, it is understood that institutional interest continues in a controlled manner. On the retail investor front, trading through ETFs, net outflows continue to increase. Rising uncertainty ahead of next week’s inflation data release in the US is causing trading volumes to remain weak in the markets. This outlook limits new capital inflows into crypto assets and also reduces the likelihood of strong and directional price movements in the short term. In this context, while demand for Bitcoin appears to be cautious, Ethereum and major altcoins show limited positive divergence compared to Bitcoin in terms of price performance. Although strong pricing is observed in altcoins, considering the current low-volume market structure, a sharp change in Bitcoin dominance is not expected, and it is estimated that it will continue its horizontal course in the 58%–60% range in the coming week.
Ethereum Dominance
Source: Tradingview
Weekly Change:
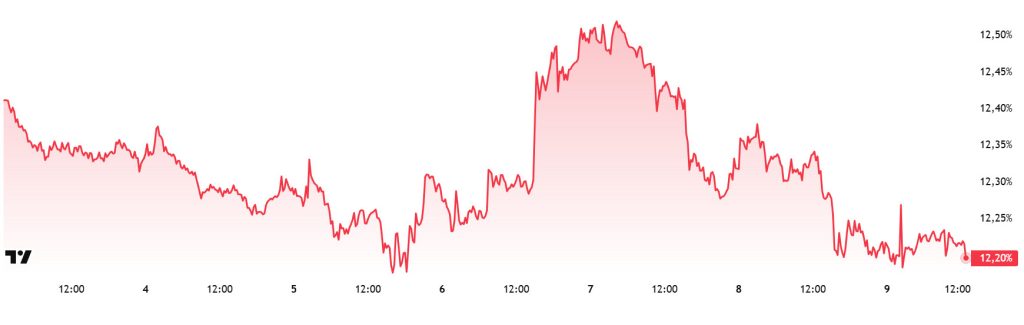
- Last Week’s Level: 12.28%
- This Week’s Level: 1 2.20%
Ethereum dominance, which rose to 15% levels in mid-August, lost momentum in the following period and entered a downward trend. Although this negative outlook was partially offset by a limited positive correction until the first week of December, it has reversed direction again in the last three weeks and recorded a decline.
In this context, Ethereum dominance ended last week at 12.28% and is currently trading at around 12.20%. During the same period, Bitcoin dominance has followed a negative trend, unlike Ethereum dominance.
The key developments affecting Ethereum dominance are as follows:
Ethereum Foundation researcher Alex Stokes announced that the BPO2 upgrade has been activated on the mainnet. With this update, the target number of Blobs per block was increased to 14, and the maximum capacity to 21. Unlike traditional hard forks, the BPO mechanism offers a lightweight upgrade focused solely on Blob parameters. This allows for faster optimizations without disrupting the network’s consensus structure.
SharpLink announced that it earned 438 ETH in rewards from Ethereum staking activities last week. This brings the company’s total staking rewards to 10,657 ETH. The latest weekly rewards are worth approximately $1.4 million at current prices. SharpLink reiterated that it has allocated all its assets to ETH and is continuing its 100% staking strategy.
Bitmine Immersion Technologies announced that it purchased an additional 32,977 ETH last week. The company’s total crypto assets and cash holdings reached $14.2 billion. This amount includes 4,143,500 ETH, 192 BTC, and $915 million in cash. The amount of ETH staked by the company was disclosed as 659,200. This ETH amount corresponds to approximately 3.43% of the total Ethereum supply.
Bitcoin Spot ETF
Source: Darkex Research Department
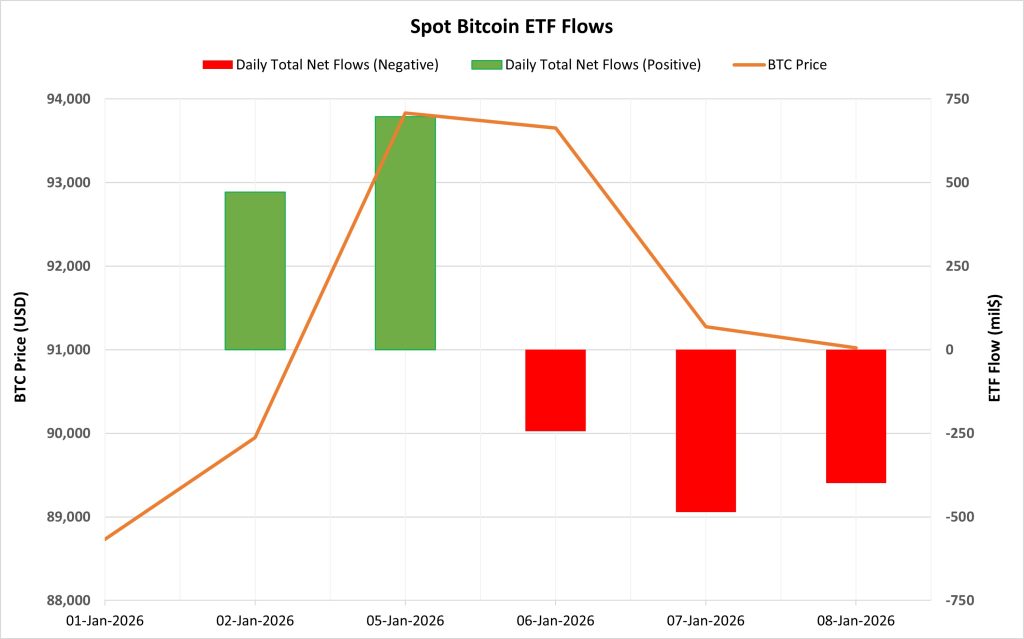
Netflow Status: Between January 2-8, 2026, there was a total net inflow of $40.4 million into Spot Bitcoin ETFs. Strong inflows seen in the first two trading days of this period ensured that the net flow total was positive. Following this strong start, nearly $1.1 billion in net outflows were observed over the last three trading days. This indicates that institutional investors remain cautious. Fund-level inflows were primarily driven by BlackRock IBIT, while outflows were concentrated in Fidelity FBTC and Grayscale.
Bitcoin Price: Bitcoin opened at $88,730 on January 2 and closed at $91,021 on January 8. During this period, the BTC price rose by 2.58%. Overall, the correlation between BTC price movements and ETF net flows was prominent during this period.
Cumulative Net Inflow: By the end of the 498th trading day, the cumulative total net inflow of Spot Bitcoin ETFs rose to $56.635 billion.
| Date | Coin | Open | Close | Change | ETF Flow (mil$) |
|---|---|---|---|---|---|
| 02-Jan-2026 | BTC | 88,730 | 89,947 | 1.37% | 471.3 |
| 05-Jan-2026 | BTC | 91,489 | 93,831 | 2.56% | 697.2 |
| January 6, 2026 | BTC | 93,831 | 93,652 | -0.19% | -243.2 |
| 07-Jan-2026 | BTC | 93,652 | 91,273 | -2.54% | -486.1 |
| January 8, 2026 | BTC | 91,273 | 91,021 | -0.28% | -398.8 |
| Total for Jan 2–8, 2026 | 2.58% | 40.4 |
Spot Bitcoin ETFs showed a directionless and volatile structure during this period. Although strong inflows at the beginning of this period supported market confidence, accelerated outflows in the following days limited the sustainability of this effect. Institutional investors continued to view the rallies as selling opportunities. Despite the positive close in price, the lack of a sustainable series of inflows into ETFs indicated that the rally was fragile ( ). In the coming days, a return to stability in ETF inflows could create a healthier foundation for Bitcoin price appreciation. Otherwise, continued selling pressure from ETFs may continue to limit upward attempts in price.
Ethereum spot ETF
Source: Darkex Research Department
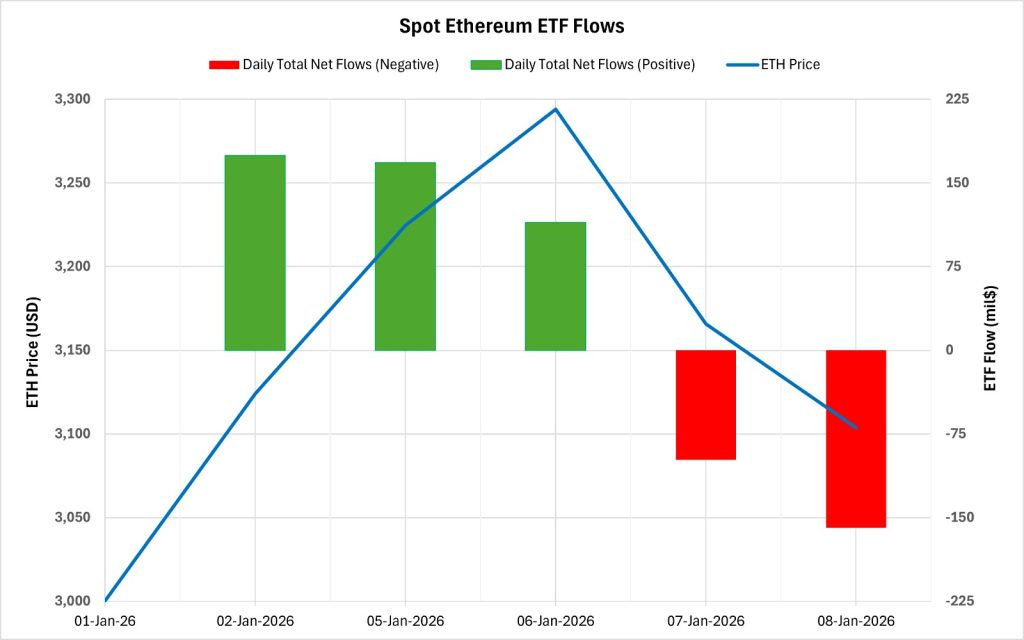
Between January 2-8, 2026, Spot Ethereum ETFs saw a total net inflow of $199.7 million. During this period, positive flows seen consecutively over the first three trading days kept the net flow total on the positive side. Outflows over the last two trading days indicate that short-term caution has returned among institutional investors. BlackRock ETHA-driven inflows are noteworthy on a fund basis. The cumulative total net inflow of Spot Ethereum ETFs rose to $12.547 billion as of the 368th trading day.
|
The ETH price, which was trading at around $3,000 as of January 2, closed at $3,104 on January 8. During this period, the ETH price gained 3.45%. The price moved in line with ETF inflows during the first three days of the week. However, the price decline and ETF outflows over the last two trading days confirmed the fragile nature of the uptrend. Consequently, this period indicates that ETF inflows supported the price at the level, but this support failed to gain traction. In the coming days, the ETH price is expected to move upward as ETF inflows gain strength.
Bitcoin Options Distribution
Source: Laevitas
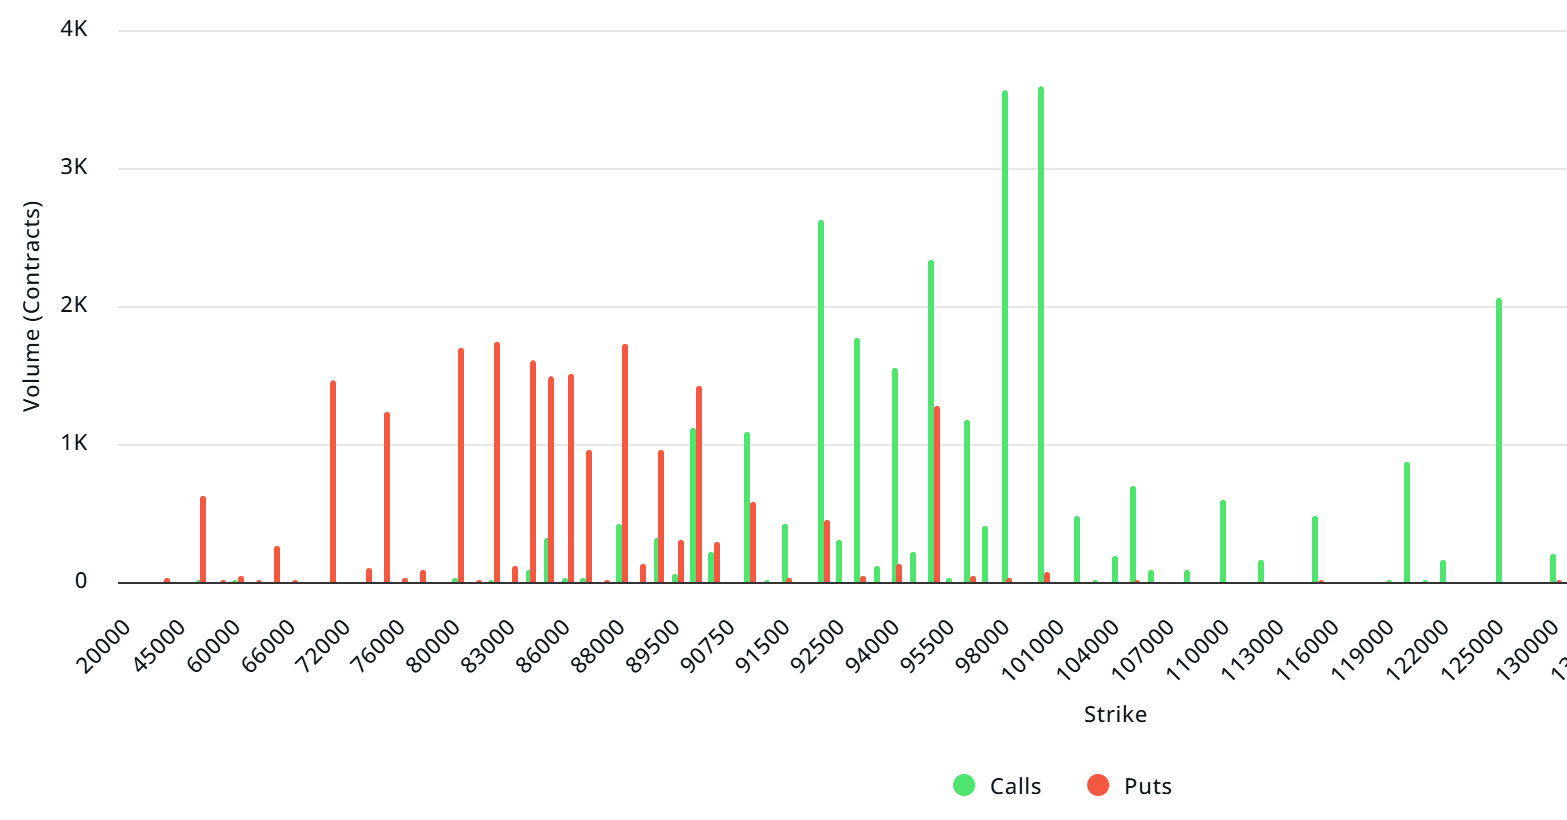
BTC: Notional: $1.84B | Put/Call: 1.05 | Max Pain: $90K
Deribit Data: Deribit data shows that BTC option contracts with a notional value of approximately $1.84 billion expire today. At the same time, looking at the risk transformation over the next week based on the last 24 hours’ data, put options are dominating over call options in terms of risk hedging. However, there is an increase in call options. When examining expected volatility (IV), it is above realized volatility (RV). On the other hand, the positive spread metric indicates increased risk appetite in the market, suggesting that call options are expensive. Skew values are pointing downward today and for the coming week.
Laevitas Data: Examining the chart, we see that put options are concentrated in a wide band between $50,000 and $95,000. Call options, on the other hand, are spread across a wide base between $92,000 and $125,000. At the same time, the $92,000 level appears to be resistance, while the $88,000 level appears to be support. On the other hand, there are 1.72k put options at the $88,000 level, peaking here and showing a decrease in put volume after this level. Furthermore, 3.6K call option contracts peak at the $100,000 level. Looking at the options market, we see that put contracts are slightly dominant on a daily and weekly basis.
Option Maturity:
Call/Put Ratio and Maximum Pain Point: Looking at options in the latest 7-day data from Laevitas, the number of call options increased by approximately 42% compared to last week, reaching 103.09K. In contrast, the number of put options increased by 37% compared to last week, reaching 74.53K. The put/call ratio for options is set at 1.05. This indicates that there is less demand for call options than put options among investors. Bitcoin’s maximum pain point is seen at $90,000. BTC is currently priced at $91,000, and if it does not break below the pain point of $90,000, further increases can be expected.
Ethereum Options Distribution
Source: Laevitas
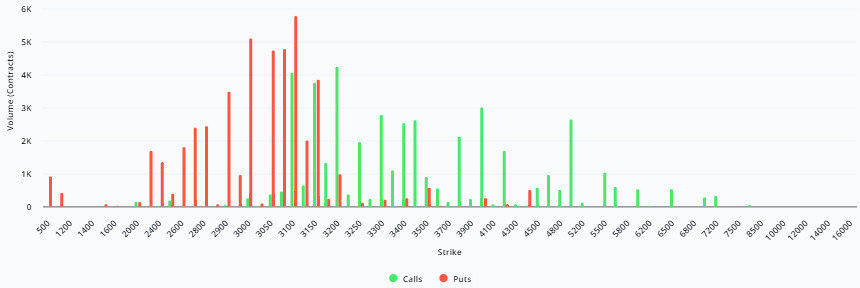
ETH: $0.39 B notional | Put/Call: 0.89 | Max Pain: $3,100
Laevitas Data: Looking at the data in the chart, we see that put options are concentrated in a fairly wide band, particularly between the $3,000 and $3,150 price levels. The highest put volume is at the $3,100 level, with approximately 6K contracts. On the other hand, in call options, there is a noticeable concentration between the $3,000 and $3,200 levels. The highest call volume appears to be approximately 5K at the $3,200 level.
Deribit Data: First of all, ATM volatility is still above 50, meaning the potential for sharp price movements remains quite high. Looking at risk reversal and skew, the fact that put options are more expensive than call options indicates that there is no dominant downward stress. The negative RR, which measures downward panic sentiment, has not yet formed here. Therefore, we see that the market’s upward expectations are significantly higher than its downward expectations. To summarize, while there is no definitive bullish signal, we can say that option players have strong upward price expectations.
Option Maturity:
Ethereum options with a nominal value of $0.39 billion expired on January 9. The Max Pain level was calculated at $2,100, while the put/call ratio stood at 0.89.
Legal Notice
The investment information, comments, and recommendations contained in this document do not constitute investment advisory services. Investment advisory services are provided by authorized institutions on a personal basis, taking into account the risk and return preferences of individuals. The comments and recommendations contained in this document are of a general nature. These recommendations may not be suitable for your financial situation and risk and return preferences. Therefore, making an investment decision based solely on the information contained in this document may not result in outcomes that align with your expectations.
