
Fear & Greed Index
Source: Alternative.me
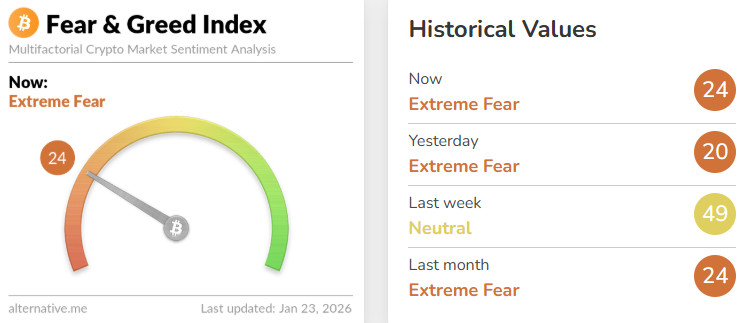
- Change in Fear and Greed Value: -25
- Last Week’s Level: 49
- This Week’s Level: 24
The Fear and Greed Index fell from 49 to 24 this week, indicating that sentiment has shifted sharply from neutral to fear. The main driver of this decline was the re-emergence of net outflows in spot Bitcoin ETFs, which dragged down price momentum. During the week, net outflows of approximately $483.38 million from Bitcoin spot ETFs and approximately $708.71 million in a separate session, along with net outflows of approximately $229.95 million and approximately $297.51 million from Ethereum spot ETFs, weakened the perception of institutional demand and reduced risk appetite. This outflow pressure, combined with Bitcoin’s fragile price structure hovering around the $90,000 threshold, made the selling wave more visible and pushed the index’s volatility component higher. Data released on the macro front also failed to support expectations of rapid easing. Weekly jobless claims remaining at 200,000 and GDP growth being revised to an annualized 4.4% kept expectations alive that the Fed would maintain its cautious stance. In contrast, pending home sales falling 9.3% and recording a 3.0% decline on an annual basis highlighted cooling in interest rate-sensitive areas, weighing on risk sentiment. At Davos, Trump’s rhetoric targeting Europe’s energy policy, his emphasis on a 139% increase in electricity prices in the UK, and his criticism of renewable investments fueled uncertainty premiums, while his reiteration of the call for urgent negotiations on Greenland and his statement that he would not use force kept the geopolitical agenda on the table throughout the week.
Crypto Fund Flows
 Source: Coinshares
Overview
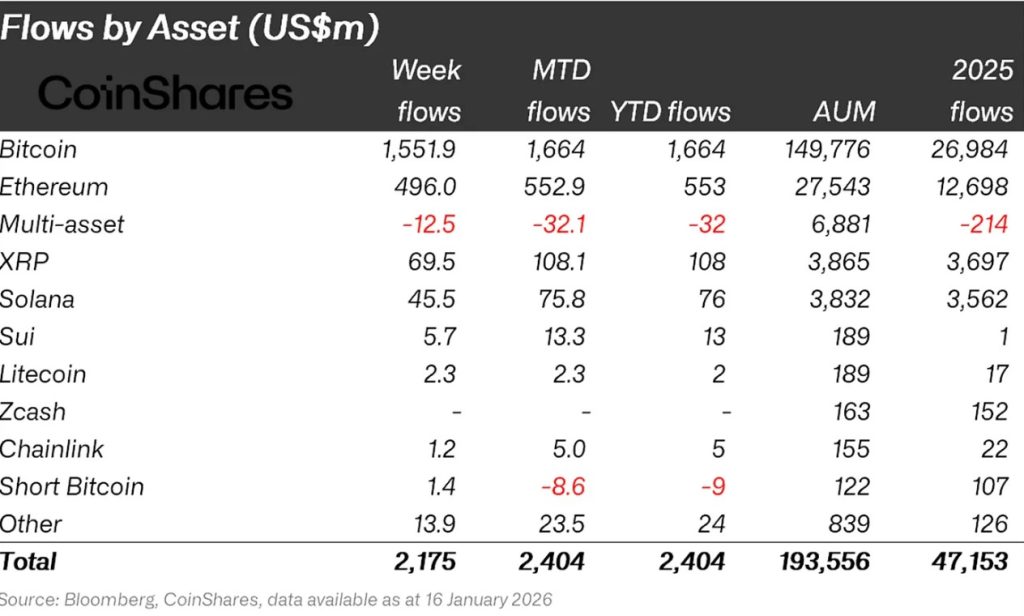
Crypto markets spent the week discussing the US’s planned operations in Greenland and Iran and their details. Bitcoin and altcoins saw limited sideways movement. As a result, Bitcoin lost about 1% of its value over the week.
- Bitcoin (BTC): Bitcoin saw outflows from investors this week. Bitcoin-focused funds saw inflows of $1,551.9 million.
- Ethereum (ETH): Along with spot ETH inflows, Ethereum saw $496.0 million in inflows this week.
- Chainlink (LINK): Chainlink saw inflows of $1.2 million.
- Solana (SOL): Solana saw inflows of $45.5 million.
- Ripple (XRP): This week, XRP saw $69.5 million in fund inflows.
- SUI: Sui saw inflows of $5.7 million.
- Other: Sector-specific and project-based declines in altcoins, along with the overall market sentiment, resulted in a $13.9 million inflow in fund flow data.
Fund Outflows:
- Bitcoin (BTC): Bitcoin experienced outflows from investors this week. Bitcoin-focused funds saw outflows of $404.7 million.
- Short Bitcoin: Short Bitcoin saw an outflow of $10.1 million.
- Multi-asset: Outflows were observed in the multi-asset group.
Total MarketCap
Source: TradingView
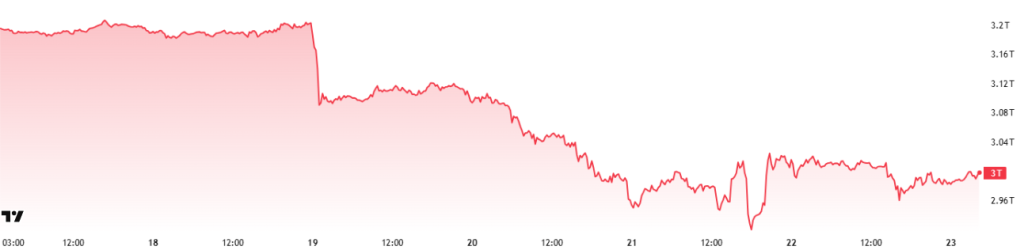
- Last Week’s Market Capitalization:14 Trillion USD
- This Week’s Market Capitalization: 3.00 Trillion USD
This week, the cryptocurrency market declined by approximately 143 billion USD, recording a 4.55% decrease, and the total market capitalization is currently hovering around 3 trillion USD. The weekly high was 3.14 trillion USD, while the weekly low stood at 2.91 trillion USD. Accordingly, the market moved within a 232 billion USD range, indicating a 7.97% period-based volatility. It can be said that the average weekly candlestick size in the crypto market continues within its usual volatility range, and that this level of volatility should be considered normal.
Total 2
The Total 2 index, which began the week with a market capitalization of 1.27 trillion USD, declined by 5.18% over the course of the week, losing approximately 65 billion USD, and continues to trade near the 1.2 trillion USD level. The weekly high was recorded at 1.28 trillion USD, while the weekly low stood at 1.17 trillion USD. The index fluctuating within a 103 billion USD range corresponds to approximately 8.8% volatility for the period. With this outlook, Total 2 remains positioned approximately 564 billion USD below its all-time high. The required upside move from current levels to reach its previous peak is calculated at approximately 46.85%.
Total 3
The Total 3 index, which started the week with a total market capitalization of 873.47 billion USD, contracted by approximately 27 billion USD over the week, recording a 3.1% decline, and is currently holding the period around the 846.36 billion USD level. The volatility between the weekly high and low was measured at 6.36%. Given this outlook, Total 3 experienced a relatively more stable period compared to the other market indices.
The proportional ranking of the indices by volatility “Total2 > Total > Total3” indicates that volatile price action has primarily been concentrated on the Ethereum side, followed respectively by Bitcoin , and the average of other altcoins. In addition, the significant contraction in Ethereum’s total market share during the current period also stands out.
Altcoin Season Index
Source: Coinmarketcap
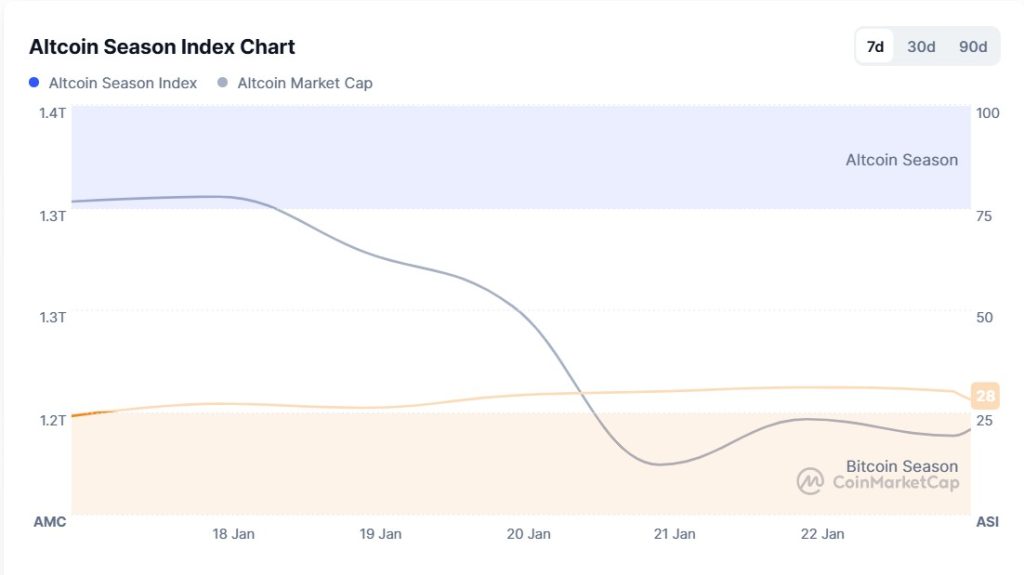
- Last Week’s Index Value: 25/100
- This Week’s Index Value: 28/100
Between January 18 and January 23, 2026, a decline was observed in the correlation between altcoin market dominance (Altcoin Market Cap) and the Altcoin Season Index. The graph shows that Altcoin Market Cap reached its highest point this week on January 18 , at 1.32T. As the week drew to a close, selling pressure increased, leading to a decline in market dominance. The top 5 coins leading the index’s rise this week were MYX, AXS, XMR, CHZ, and DASH. US President Trump’s statements this week regarding Greenland and the Davos agenda with Iran caused a decline in the Altcoin Season Index, showing that the total market value of altcoins experienced a relative decline compared to Bitcoin.
Bitcoin Dominance
Source: Tradingview
Weekly Change
- Last Week’s Level:70%
- This Week’s Level:86%
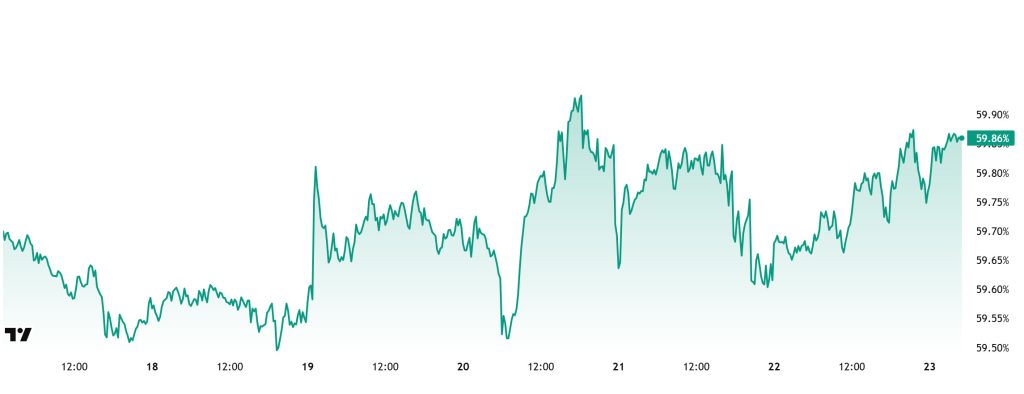
Bitcoin dominance, which started the week at 59.57%, rose to 60.08% during the week but then retreated slightly and is currently at 59.86%.
This week, Strategy purchased 22,305 Bitcoin, DDC Enterprise purchased 200 Bitcoin, and The Smarter Web purchased 10 Bitcoin. Additionally, data on Bitcoin spot ETFs shows a net outflow of $1.22 billion to date.
Strategy made its largest purchase since November 24, 2024. While Strategy continues to buy aggressively, other companies appear cautious and limited in their purchases. This suggests that there is not yet widespread risk appetite among institutional investors. The net outflows observed in ETFs this week signal a reversal of the strong inflow trend seen the previous week. Uncertainty persists in the markets ahead of the Fed’s interest rate decision to be announced this week. This situation makes it difficult to clarify the short-term direction, limiting investors’ willingness to take positions and leading to low trading volumes. In contrast, Bitcoin continues to maintain its strong stance. Although Ethereum and major altcoins occasionally show limited positive divergence, no significant break in Bitcoin dominance is expected given the current market structure. In light of all this data, Bitcoin dominance is expected to remain in the 58%–61% range next week.
Ethereum Dominance
Source: Tradingview
Weekly Change:
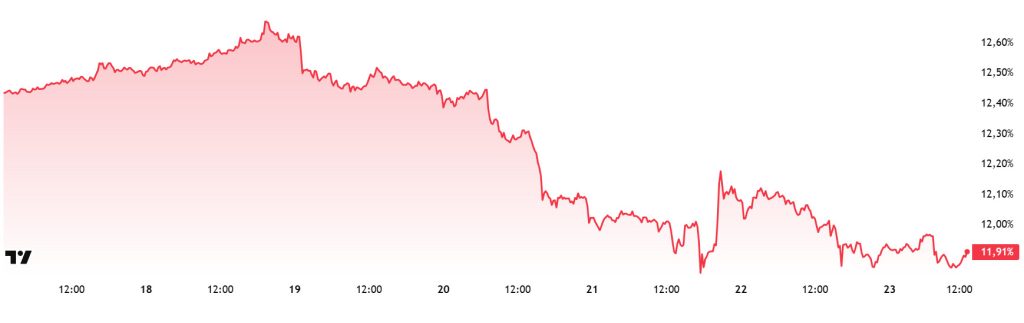
- Last Week’s Level: 12.62%
- This Week’s Level: 1 1.91%
Ethereum dominance, which rose to 15% levels in mid-August, lost momentum in the following period and entered a downward trend. This negative outlook progressed to 13% levels with a positive correction until the last week of November. However, it faced strong resistance at this level and reversed direction downward again.
In this context, Ethereum dominance ended last week at 12.62% and is currently trading at around 11.91%. During the same period, Bitcoin dominance has followed a positive trend, unlike Ethereum dominance.
The key developments affecting Ethereum dominance are as follows:
BitMine Immersion Technologies announced that its current crypto portfolio contains 4,203,036 ETH. The company also added 35,268 ETH to its portfolio last week.
Activity on the Ethereum network has increased significantly over the past month. This increase is attributed to new addresses interacting with the chain for the first time, rather than existing users conducting more frequent transactions. Monthly user tracking data indicated a strong increase in the number of wallets making their first contact with the blockchain. Unlike previous periods, this increase revealed a broadening interest in DeFi, stablecoin transfers, NFTs, and new applications.
Bitcoin Spot ETF
Source: Darkex Research Department
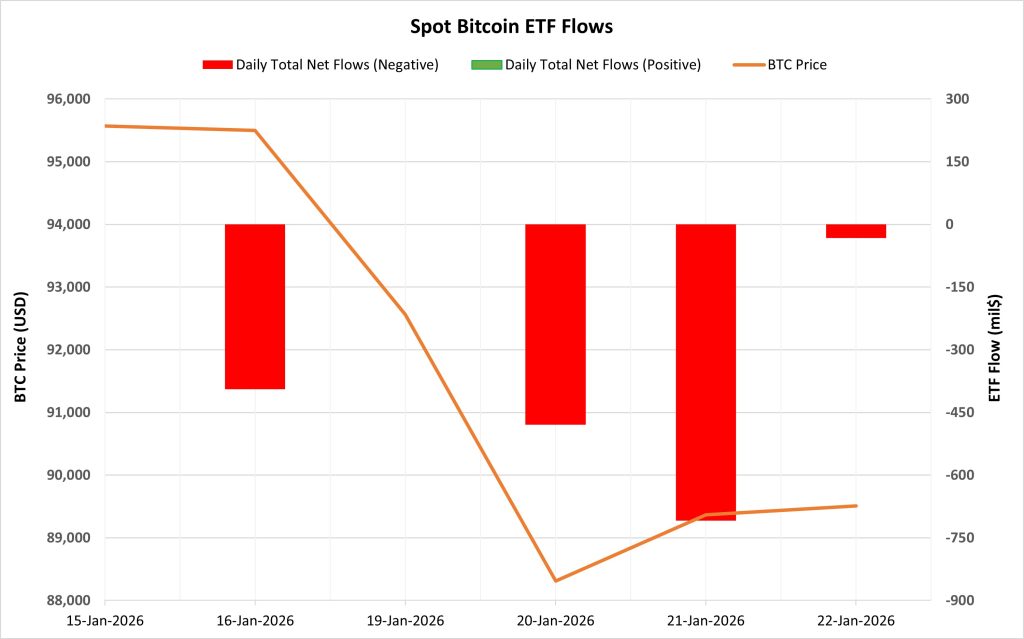
Netflow Status: Between January 16-22, 2026, a total of $1.615 billion in net outflows occurred from Spot Bitcoin ETFs. After a 4-day positive net flow series ended in the previous period, negative flows were observed in the last 4 trading days. During this process, sharp outflows were recorded while selling pressure increased significantly. In terms of funds, outflows were mainly from BlackRock IBIT and Fidelity FBTC.
Bitcoin Price: Bitcoin opened at $95,570 on January 16 and closed at $89,507 on January 22. During this period, the BTC price lost 6.34% of its value. The decline in the Bitcoin price coincided with high outflows from ETFs.
Cumulative Net Inflow: At the end of the 507th trading day, the cumulative total net inflow of Spot Bitcoin ETFs fell to $56.58 billion.jj
| Time | News | Expectation | Previous |
|---|---|---|---|
| All Day | Conflux (CFX) Founders Spaces AMA | – | – |
| All Day | Kamino (KMNO) 229.17MM Token Unlock | – | – |
| 13:30 | US Core PPI m/m | 0.3% | 0.0% |
| 13:30 | US PPI m/m | 0.3% | 0.2% |
| 16:00 | US Bitcoin Futures Expiration | – | – |
During this period, institutional demand for Spot Bitcoin ETFs weakened significantly. With the end of the positive flow series, successive high outflows put direct pressure on the Bitcoin price. If the negative flow trend continues in the coming period, downward pressure and volatility on the BTC side are likely to continue.
Ethereum spot ETF
Source: Darkex Research Department
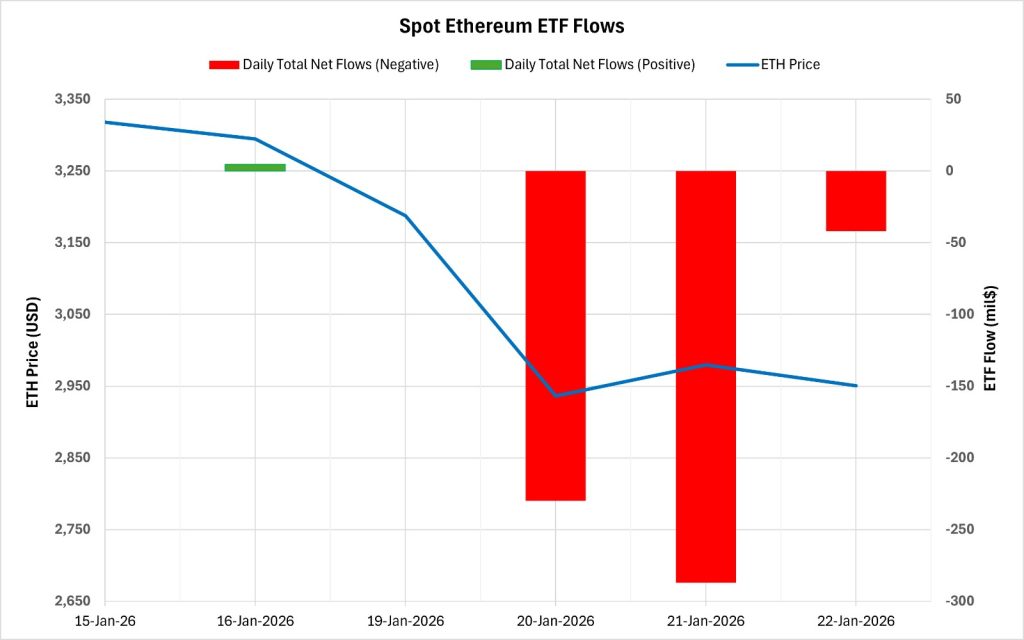
Between January 16-22, 2026, a total of $554.3 million in net outflows occurred from Spot Ethereum ETFs. The positive net flow series, which lasted for 5 trading days, came to an end. A negative flow series formed over the last 3 trading days. The outflows observed on January 20 and 21 determined the overall negative outlook during this period. Looking at the funds, the outflows were mainly from BlackRock ETHA and Fidelity FETH. As of the 377th trading day, the cumulative total net inflow of Spot Ethereum ETFs fell to $12.373 billion.
| Date | Coin | Open | Close | Change | ETF Flow (mil$) |
|---|---|---|---|---|---|
| Jan 16, 2026 | ETH | 3,318 | 3,295 | -0.69% | 4.7 |
| January 19, 2026 | ETH | 3,283 | 3,188 | -2.90% | 0 |
| January 20, 2026 | ETH | 3,188 | 2,936 | -7.88% | -230 |
| January 21, 2026 | ETH | 2,936 | 2,980 | 1.47% | -287 |
| January 22, 2026 | ETH | 2,980 | 2,951 | -0.97% | -42 |
| Total for January 16–22, 2026 | -11.06% | -554.3 |
Ethereum opened at $3,318 on January 16 and closed at $2,951 on January 22. During this period, the ETH price lost 11.06% of its value. The sharp 7.88% decline seen on January 20 coincided with strong outflows from ETFs. The simultaneous negative trend in price and ETF flows indicated increased selling pressure. Overall, this period highlighted a significant weakening of risk appetite among institutional investors. In the coming days, a short-term stabilization in the ETH price could be seen if outflows from ETFs slow down or inflows resume.
Bitcoin Options Distribution
Source: Laevitas
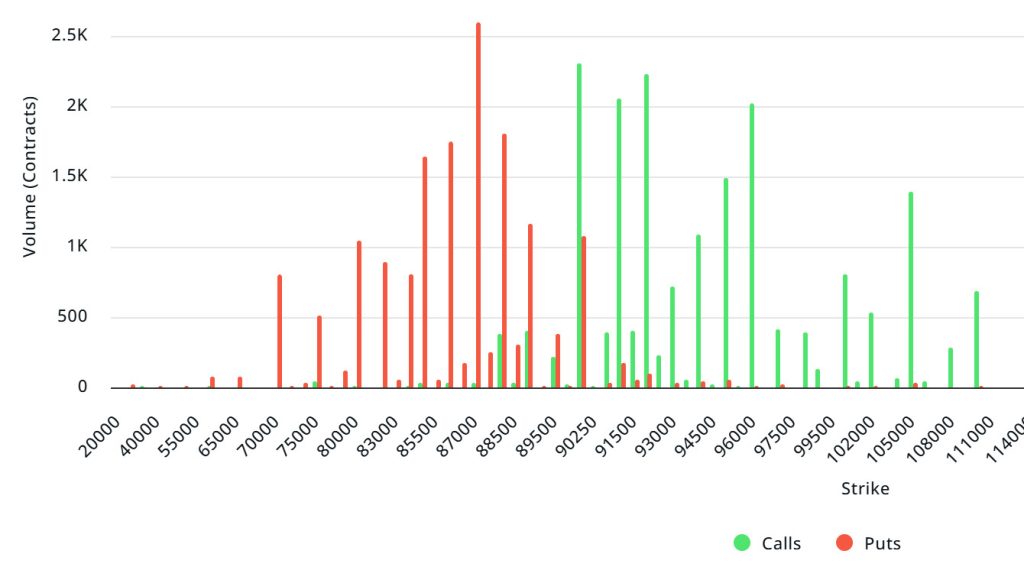
BTC: $1.81B Notional | Put/Call: 0.74 | Max Pain: $92K
Deribit Data: Deribit data shows that BTC option contracts with a notional value of approximately $1.81 billion expired today. At the same time, looking at the risk transformation over the next week based on the last 24 hours’ data, put options are dominating over call options in terms of risk hedging. When examining expected volatility (IV), it is trading below realized volatility (RV). On the other hand, the negative spread metric indicates a decline in market risk appetite and suggests that put options are expensive. Skew values are pointing downward today and for the coming week.
Laevitas Data: Examining the chart, we see that put options are concentrated in a wide band between $70,000 and $90,000. Call options, on the other hand, are spread across a broad base between $90,000 and $110,000. At the same time, the $90,000 level appears to be resistance, while the $87,000 level appears to be support. On the other hand, there are 2.59k put options at the $87,000 level, where they peak, and a decrease in put volume is observed after this level. Meanwhile, 2.31K call option contracts peak at the $90,000 level. Looking at the options market, we see that call contracts dominate on a daily and weekly basis.
Option Maturity:
Call/Put Ratio and Maximum Pain Point: Looking at the options in the latest 7-day data from Laevitas, the number of call options decreased by approximately 23% compared to last week, reaching 81.05K. In contrast, the number of put options increased by 19% compared to last week, reaching 79.52K. The put/call ratio for options is set at 0.74. This indicates that there is more demand for call options than put options among investors . Bitcoin’s maximum pain point is seen at $92,000. BTC is currently priced at $89,470, and if it fails to break above the pain point of $92,000, further declines can be anticipated.
Ethereum Options Distribution
Source: Laevitas
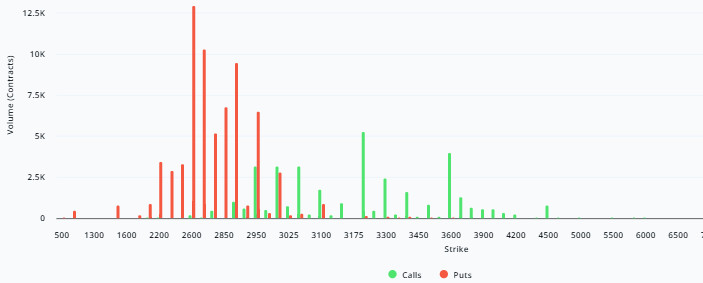
ETH: $0.34 B notional | Put/Call: 0.88 | Max Pain: $3,250
Laevitas Data: Looking at the data in the chart, we see that put options are concentrated in a fairly wide band, particularly between the $2,200 and $2,950 price levels. The highest put volume is at the $3,600 level, with approximately 13K contracts. On the other hand, in call options, there is a noticeable concentration between the $2,950 and $3,600 levels. The highest call volume appears to be approximately 6K at the $3,200 level.
Deribit Data: First, looking at recent daily movements in the short term, the 58% increase in open interest is noteworthy. Such an increase in such a short time is not a typical day; there has been significant capital inflow into the market. People are either trying to hedge against a decline or betting on that decline. In both cases, they have taken a strong position. The volume of put options has increased by 151%, meaning investors are taking positions against a decline, but this is not a “panic sell.” It looks more like conscious risk management or strategic positioning. The fact that volatility has not changed much supports this view. ATM volatility has only increased by +0.04 points. On the other hand, volume in call options has fallen by 64%. This indicates that expectations of upward momentum have been put on hold for now. In short, no one is expecting an upward rally at this point. The risk reversal (RR) value is -10.58. The premium difference between call and put options has widened significantly, with puts being clearly more expensive. In other words, the market believes a downward move is more likely.
Option Maturity:
Ethereum options with a nominal value of $0.34 billion expired on January 23. The Max Pain level was calculated at $3,250, while the put/call ratio stood at 0.88.
Legal Notice
The investment information, comments, and recommendations contained in this document do not constitute investment advisory services. Investment advisory services are provided by authorized institutions on a personal basis, taking into account the risk and return preferences of individuals. The comments and recommendations contained in this document are of a general type. These recommendations may not be suitable for your financial situation and risk and return preferences. Therefore, making an investment decision based solely on the information contained in this document may not result in results that are in line with your expectations.
