
Fear & Greed Index
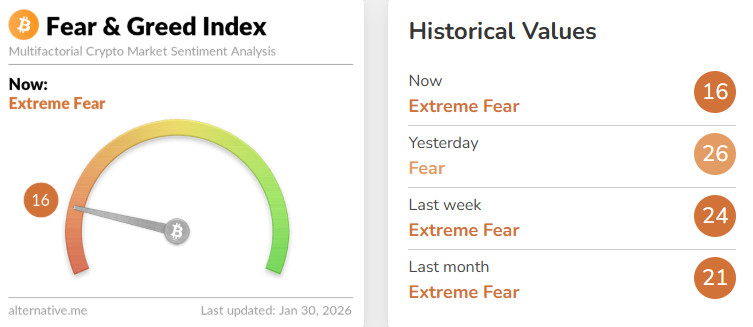
Source: Alternative.me
- Change in Fear and Greed Value: -8
- Last Week’s Level: 24
- This Week’s Level: 16
The Fear and Greed Index fell from 24 to 16 this week, indicating that sentiment has deepened into the extreme fear zone. Although there was a brief recovery towards 26 during the week, it was not sustained, and risk aversion regained strength. The main triggers for this weakening were the deterioration of institutional flows and the sharp price decline amplifying volatility. In spot Bitcoin ETFs, a net outflow of $147.4 million during the week was followed by a net outflow of $19.6 million, and total net outflows expanded to approximately $500 million by the end of the week, dampening risk appetite. The renewed emergence of net outflows in Ethereum spot ETFs also weakened the perception of institutional demand. This flow pressure, combined with price action, pushed Bitcoin below $85,000, with 24-hour liquidations exceeding $800 million, dampening sentiment and pushing the index’s volatility component higher. On the macro side, the Fed’s decision to keep interest rates steady at 3.50%–3.75% and its message that inflation remains high fueled the perception that financial conditions will not ease quickly, while news flow regarding the Fed chair selection process also increased uncertainty premiums regarding independence and the policy path. In geopolitics and trade, the hardening rhetoric around Iran tensions and the noise rising over tariffs also supported the safe-haven trend, limiting recovery attempts in crypto.
Crypto Fund Flows
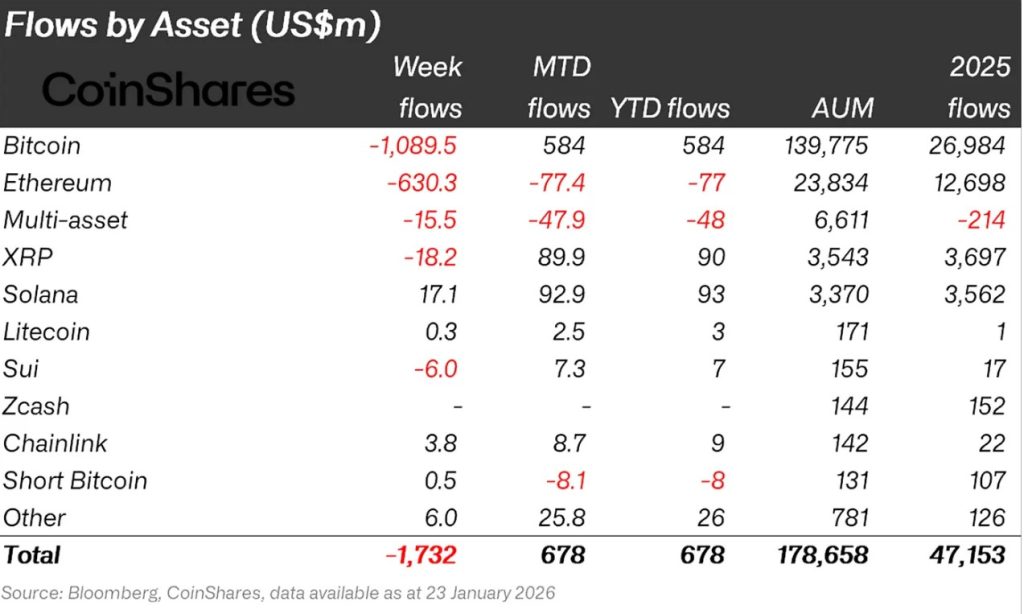
Source: Coinshares
Overview
Crypto markets spent a week awaiting details of the US operation against Iran. Bitcoin and altcoins saw outflows. As a result, Bitcoin lost approximately 3% of its value over the week.
- Chainlink (LINK): Chainlink saw an inflow of $3.8 million.
- Solana (SOL): Solana saw an inflow of $17.1 million.
- SUI: Sui saw an inflow of $5.7 million.
- Other: Sector-specific and project-based declines in altcoins, along with the general market sentiment, brought about $13.9 million in inflows in fund flow data.
Fund Outflows:
- Bitcoin (BTC): Bitcoin experienced outflows from investors this week. Bitcoin-focused funds saw outflows of $1,089.5 million.
- Ethereum (ETH): Along with spot ETH outflows, there was a $630.3 million outflow from Ethereum this week.
- Ripple (XRP): XRP saw $18.2 million in fund outflows this week.
- Short Bitcoin: Short Bitcoin saw outflows of $0.5 million.
- Multi-asset: Outflows were observed in the multi-asset group.
Crypto Total Market Cap

Source: TradingView
- Last Week’s Market Value:89 Trillion Dollars
- This Week’s Market Value: $2.76 Trillion
This week, the cryptocurrency market experienced a decline of approximately 120 billion USD, falling by 4.14%, with the total market value currently hovering around 2.76 trillion USD. The weekly high was recorded at 3.03 trillion USD, while the low was 2.75 trillion USD. Accordingly, the market moved within a band of 284 billion USD, indicating a volatility of 10.35% during the period.
In this context, it can be said that the weekly average candle sizes in the crypto market continue to remain within the normal volatility range and that the current volatility level should be considered normal given the nature of the market.
Total 2
Starting the week with a market value of $1.16 trillion, the Total 2 index declined by 2.37% during the week, losing approximately $27.5 billion, and continues to hover around $1.13 trillion. The weekly high was recorded at USD 1.22 trillion, while the low was USD 1.12 trillion. The index fluctuated within a band of USD 100.5 billion, corresponding to a volatility of approximately 8.95% for the period.
With this outlook, Total 2 continues to trade below its all-time high of approximately 630.55 billion USD. The upward movement required to reach its previous peak from current levels is estimated to be approximately 55.45%.
Total 3
The Total 3 index, which started the week with a total market value of $820.57 billion, declined by approximately $14.1 billion during the week, falling by 1.72%, and is currently maintaining the period around the $806.65 billion level. Volatility between the weekly high and low levels was measured at 7.34%.
The fact that the indices are ranked in terms of volatility as “Total > Total 2 > Total 3” indicates that volatile price movements are concentrated primarily on the Bitcoin side, followed by the average of Ethereum and other altcoins. Additionally, the fact that Ethereum’s increased dominance in the total market share during the current period stems from market share taken from Bitcoin rather than altcoins is also a significant factor.
Altcoin Season Index
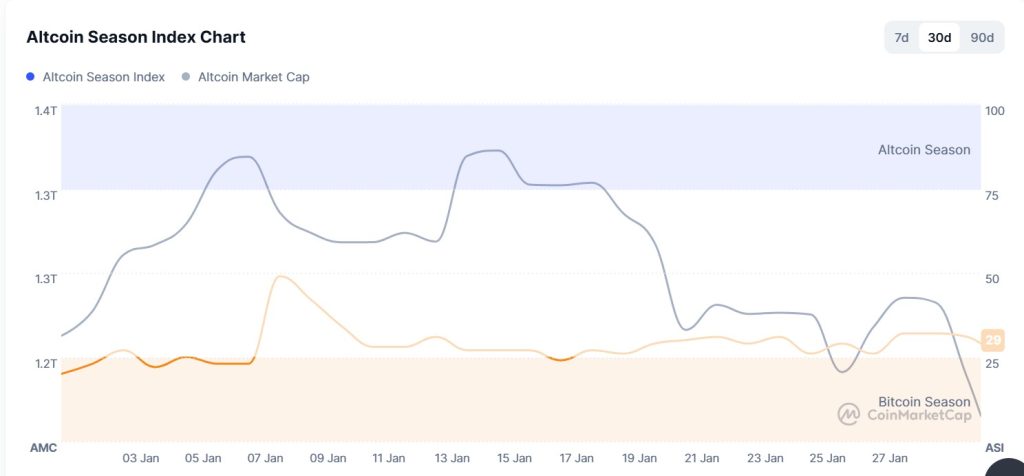
Source: Coinmarketcap
- Last Week’s Index Value: 28/100
- This Week’s Index Value: 29/100
Between January 24 and January 29, 2026, a decline was observed in the correlation between altcoin market dominance (Altcoin Market Cap) and the Altcoin Season Index. The graph shows that Altcoin Market Cap reached its highest point this week on January 28 at 1.24T. As the week came to a close, selling pressure increased, leading to a decline in market dominance. The top 5 coins leading the index’s rise this week were RIVER, MYX, CHZ, AXS, and PAXUSDT. US President Trump’s statements this week regarding the Fed Chair and the FOMC meeting agenda caused a decline in the Altcoin Season Index, showing that the total market value of altcoins experienced a relative decline compared to Bitcoin.
Bitcoin Dominance
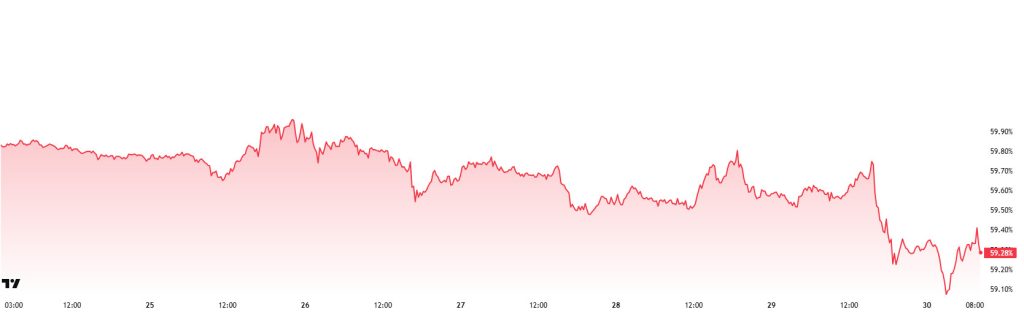
Source: Tradingview
Weekly Change
- Last Week’s Level:86%
- This Week’s Level:28%
Bitcoin dominance started the week at 59.85%, fell back to 59.14% during the week, but then rose slightly and is currently at 59.28%.
This week, Strategy purchased 2,932 Bitcoin, ANAP purchased 70 Bitcoin, DDC Enterprise purchased 200 Bitcoin, and Strive purchased 334 Bitcoin. Additionally, data on Bitcoin spot ETFs shows a net outflow of $978 million to date.
Weekly data reveals that Strategy continues to purchase Bitcoin, while Strive and DDC Enterprise have also recently begun taking regular long positions. This pattern indicates that the long-term accumulation trend among institutional investors is gradually strengthening. Conversely, continued net outflows among ETF investors suggest that the short-term trend is leaning toward selling. Global geopolitical tensions are causing caution in the markets to remain intact. This situation is relatively suppressing trading volumes while maintaining the potential for sharp price movements due to geopolitical risks. Bitcoin continues to lead recent market movements, while Ethereum and major altcoins appear to be less affected by these movements. Nevertheless, current market dynamics do not point to a strong break in Bitcoin dominance. In this context, Bitcoin dominance is expected to remain in the 58%–61% range next week.
Ethereum Dominance
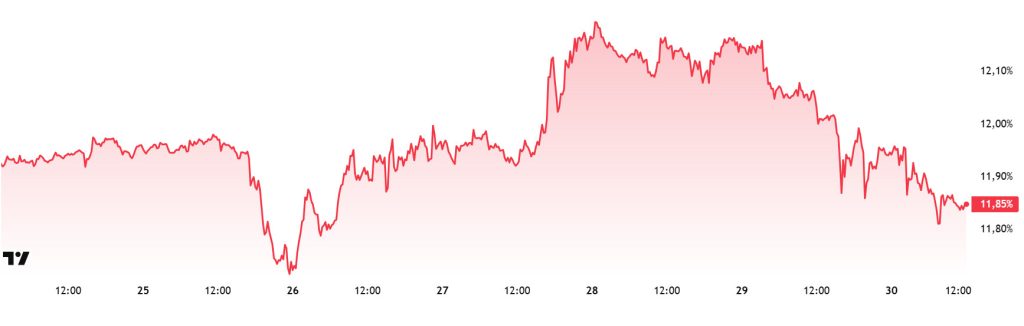
Source: Tradingview
Weekly Change:
- Last Week’s Level: 12.62%
- This Week’s Level: 1 1.85%
Ethereum dominance, which rose to 15% levels in mid-August, lost momentum in the following period and entered a downward trend. This negative outlook progressed to 13% levels with a positive correction until the last week of November. However, it faced strong resistance at this level and reversed direction downward again.
In this context, Ethereum dominance ended last week at 12.62% and is currently trading at around 11.85%. During the same period, Bitcoin dominance followed a similar negative trend to Ethereum dominance.
The key developments affecting Ethereum dominance are as follows:
The Ethereum Foundation Ecosystem Support Program announced the projects to be funded in the fourth quarter of 2025. Approximately $7,386,000 in funding was allocated during this period. The funds were directed towards community events, zero-knowledge technologies, developer tools, and protocol security. The program aims to support ecosystem growth.
The amount of ETH waiting to join the Ethereum PoS network has reached 3,330,385. This level represents a new record worth approximately $9.67 billion. The estimated activation delay was calculated as 57 days and 20 hours. The amount of ETH in the exit queue was reported to be only 832.
BitMine Immersion Technologies announced last week that it purchased 40,302 ETH. With this purchase, the company’s total Ethereum position rose to approximately 4.243 million ETH. The company’s portfolio also includes 192 BTC, $19 million worth of Eightco shares, and $200 million worth of Beast Industries shares. Its cash position was disclosed as $682 million. BitMine stands out with its Ethereum-focused treasury model.
Bitcoin Spot ETF
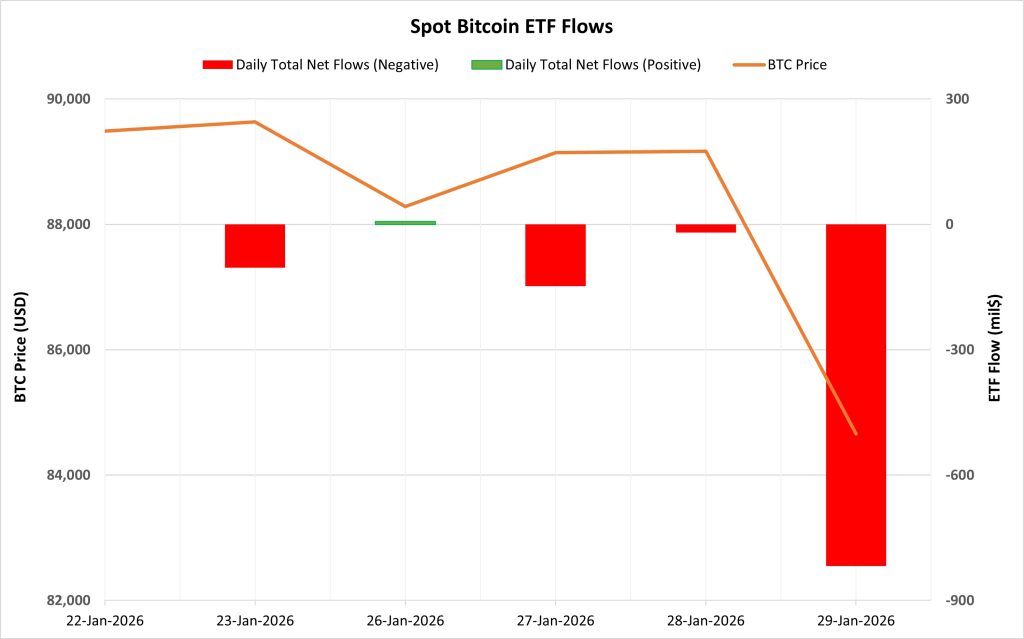
Source: Darkex Research Department
Netflow Status: Between January 23-29, 2026, a total of $1.081 billion in net outflows occurred from Spot Bitcoin ETFs. Following a 5-day negative flow series that ended during this period, the $6.8 million net inflow seen only on January 26 was not enough to change the overall outlook, and a negative flow series re-emerged over the last three trading days. Looking at the funds, BlackRock IBIT and Fidelity FBTC stood out in net outflows.
Bitcoin Price: Bitcoin opened at $89,487 on January 23 and closed at $84,659 on January 29. During this period, the BTC price lost 5.40% of its value. The sharp 5.05% decline seen on January 29, in particular, coincided with strong outflows from ETFs.
Cumulative Net Inflow: At the end of the 507th trading day, the cumulative total net inflow into Spot Bitcoin ETFs fell to $55.49 billion.
| Time | News | Expectation | Previous |
|---|---|---|---|
| All Day | Hyperliquid (HYPE) 9.92MM Token Unlock | — | — |
| All Day | Berachain (BERA) 63.75MM Token Unlock | — | — |
| 13:30 | US Average Hourly Earnings m/m | 0.3% | 0.3% |
| 13:30 | US Non-Farm Employment Change | 78K | 50K |
| 13:30 | US Unemployment Rate | 4.4% | 4.4% |
| 15:00 | US Prelim UoM Consumer Sentiment | 55.5 | 56.4 |
During this period, institutional demand for Spot Bitcoin ETFs weakened again. The predominantly negative flows suppressed attempts at price recovery. The strong correlation between ETF outflows and price declines reinforced the downward momentum. In the coming days, if ETF outflows slow down or inflows resume, we may see a short-term stabilization in the Bitcoin price. However, if the current negative flow trend persists, downward pressure and volatility on the BTC side are likely to continue.
Ethereum spot ETF
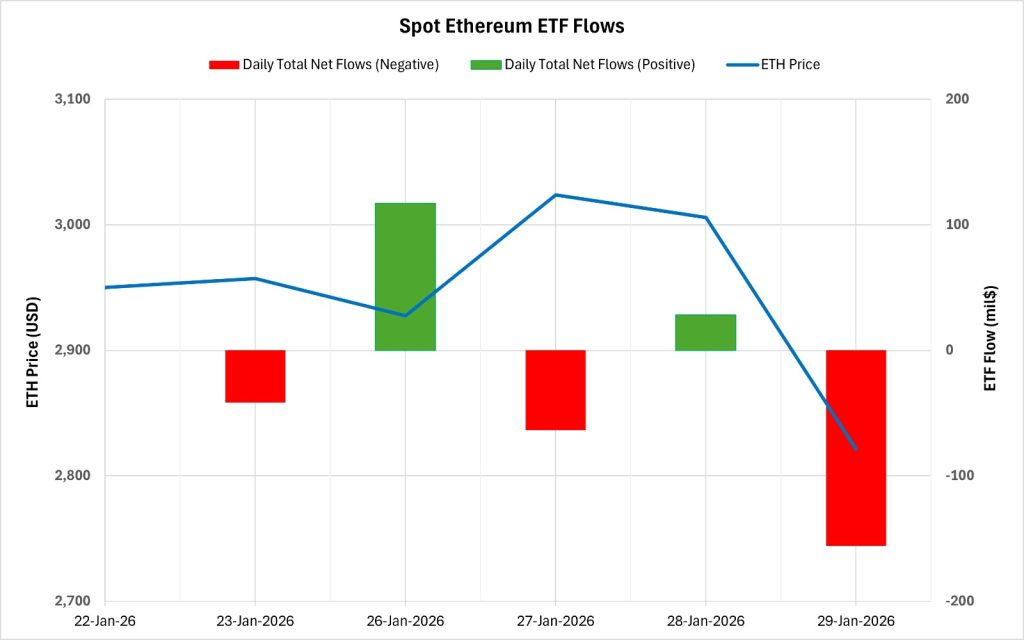
Source: Darkex Research Department
Between January 23-29, 2026, a total of $115.9 million in net outflows occurred from Spot Ethereum ETFs. Following the end of the four-day negative net flow series in the previous week, the net flow direction did not form a clear trend during this period and exhibited a volatile pattern. Fund-based outflows were primarily driven by BlackRock ETHA and Grayscale ETHE. As of the 382nd trading day, the cumulative total net inflow into Spot Ethereum ETFs declined to $12.258 billion.
| Date | Coin | Open | Close | Change | ETF Flow (mil$) |
|---|---|---|---|---|---|
| Jan 23, 2026 | ETH | 2,950 | 2,957 | 0.24% | -41.7 |
| January 26, 2026 | ETH | 2,814 | 2,927 | 4.03% | 117 |
| January 27, 2026 | ETH | 2,927 | 3,024 | 3.29% | -63.6 |
| January 28, 2026 | ETH | 3,024 | 3,006 | -0.59% | 28.1 |
| January 29, 2026 | ETH | 3,006 | 2,821 | -6.15% | -155.7 |
| Total for Jan 23–29, 2026 | -4.37% | -115.9 |
Ethereum opened at $2,950 on January 23 and closed at $2,821 on January 29. During this period, the ETH price lost 4.37% of its value. Despite strong gains during this period, the sharp 6.15% decline on January 29 turned the outlook negative. The directionless and volatile flow of ETF funds made it difficult for the price increases to gain traction. Overall, this period presented a picture where there was no clear direction in ETF flows and institutional investors maintained their cautious stance . If stable inflows resume in the ETF market in the coming days, a healthier equilibrium process could be seen in the ETH price.
Bitcoin Options Distribution
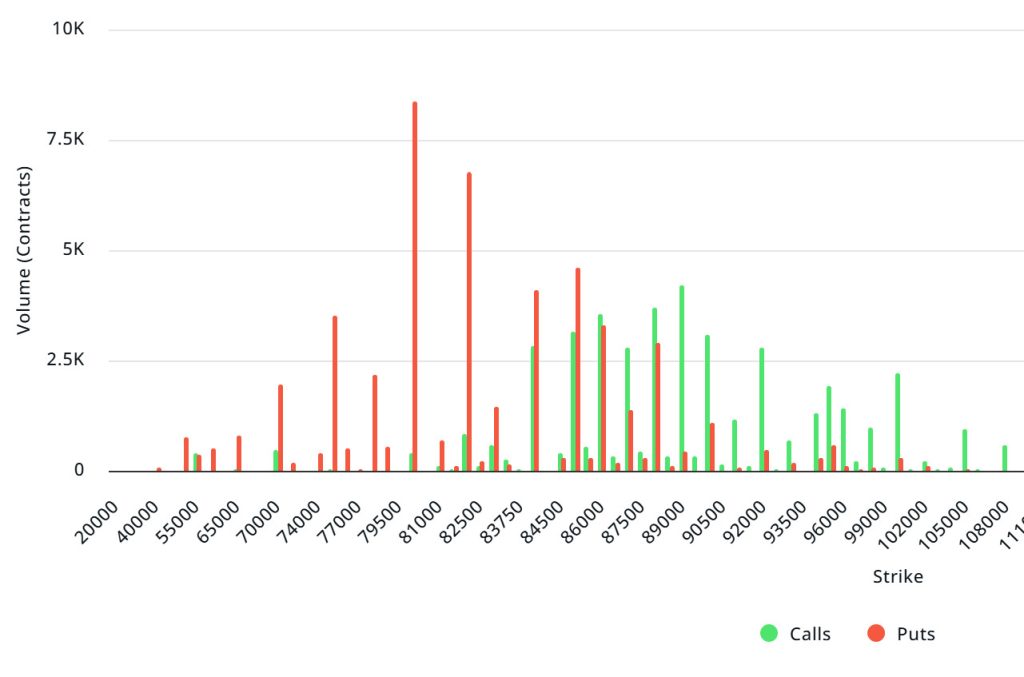
Source: Laevitas
BTC: Notional: $8.27B | Put/Call: 0.54 | Max Pain: $90K
Deribit Data: Deribit data shows that BTC option contracts with a notional value of approximately $8.27 billion expired today. At the same time, looking at the risk transformation over the next week based on the last 24 hours’ data, put options are dominating over call options in terms of risk hedging. When examining expected volatility (IV), it is trading above realized volatility (RV). On the other hand, the positive spread metric indicates increased risk appetite in the market and suggests that put options are cheap.
Laevitas Data: Examining the chart, we see that put options are concentrated in a wide band between $70,000 and $88,000. Call options, on the other hand, are spread across a broad base between the $84,000 and $100,000 levels. At the same time, the $85,000 level appears to be resistance, while the $80,000 level appears to be support. On the other hand, there are 5.18k put options at the $80,000 level, peaking here and showing a decline in put volume after this level. Meanwhile, 2.99K call option contracts peak at the $89,000 level. Looking at the options market, we see that put contracts dominate on a daily and weekly basis.
Option Maturity:
Put/Call Ratio and Maximum Pain Point: Looking at the options in the latest 7-day data from Laevitas, the number of call options increased by approximately 9% compared to last week, reaching 88.21K. In contrast, the number of put options increased by 1% compared to last week, reaching 80.39K ( ). The put/call ratio for options is set at 0.54. This indicates that there is more demand for call options than put options among investors. Bitcoin’s maximum pain point is seen at $90,000. BTC is currently priced at $82,800, and if it fails to break above the pain point of $90,000, further declines can be anticipated.
Ethereum Options Distribution
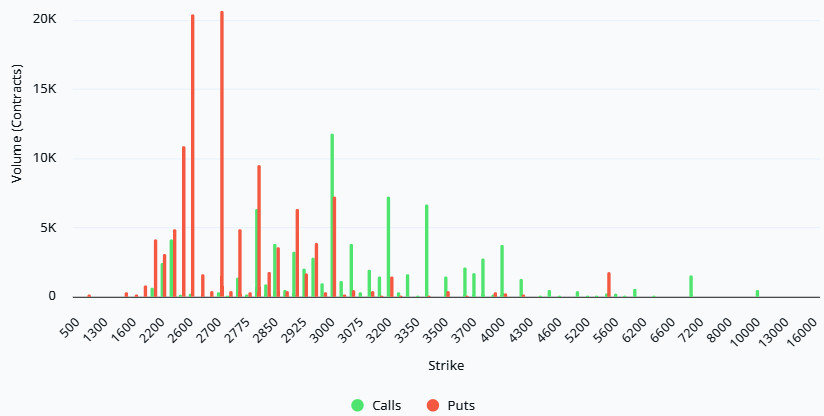
Source: Laevitas
ETH: $1.19 B notional | Put/Call: 0.71 | Max Pain: $3,000
Laevitas Data: Looking at the data in the chart, we see that put options are concentrated in a fairly wide band, particularly between the $2,700 and $3,000 price levels. The highest put volume is at the $2,700 level, with approximately 21K contracts. On the other hand, call options show a notable concentration between the $3,000 and $3,200 levels. The highest call volume appears to be approximately 12K at the $3,000 level.
Deribit Data: First, we see that there has been a significant influx of money into the market, as ATM volatility increased by 18 points on a daily basis in the short term and total volume increased by over 50%. Call option volume showed a sharp increase of 122%, while put volume also increased by 26%. However, what is truly interesting is the reflection of this two-way volume increase in the option distribution graph: puts are particularly concentrated in the $2600–$2800 range, indicating a significant positioning against the expectation of a decline. In contrast, calls are spread across the $3000–$3600 range. The risk reversal is still in negative territory, meaning puts are still more expensive. Therefore, we can say that downward price movements are much more likely than upward movements.
Option Maturity:
Ethereum options with a nominal value of $1.19 billion expired on January 30. The Max Pain level was calculated at $3,000, while the put/call ratio stood at 0.71.
Legal Notice
The investment information, comments, and recommendations contained in this document do not constitute investment advisory services. Investment advisory services are provided by authorized institutions on a personal basis, taking into account the risk and return preferences of individuals. The comments and recommendations contained in this document are of a general nature. These recommendations may not be suitable for your financial situation and risk and return preferences. Therefore, making an investment decision based solely on the information contained in this document may not result in outcomes that align with your expectations.
