
Fear & Greed Index
Source: Alternative.me
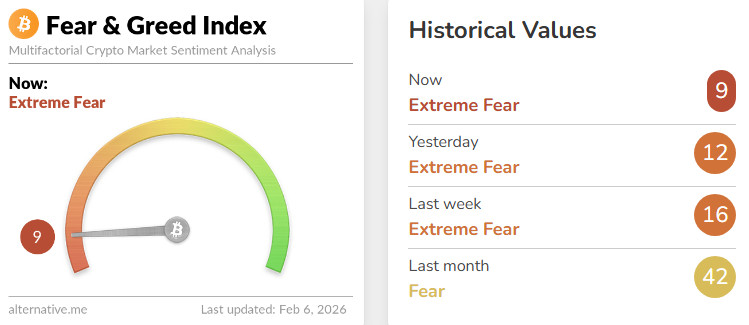
- Change in Fear and Greed Value: -7
- Last Week’s Level: 16
- This Week’s Level: 9
The Fear and Greed Index fell from 16 to 9 this week, indicating that sentiment has deepened further into the extreme fear zone. Although there were brief attempts at a rebound during the week, they were not sustained, and risk aversion regained strength. The main trigger for this weakening was the acceleration of sales as of January 31, causing price movements to settle on a tighter and more fragile ground, accompanied by increased volatility and a chain reaction of risk reduction behavior. On the institutional perception side, Strategy’s announcement of a $12.6 billion loss in the fourth quarter highlighted leverage and capital structure risks during a week of repricing balance sheet sensitivity, weakening the appetite for crypto-correlated risk and reigniting the debate on the risk-bearing capacity of major players. In geopolitics and security, China’s ban on all new investments in Israel, citing security concerns following the Epstein files, pushed up the global risk premium while supporting the safe-haven trend and limiting attempts at recovery in risky assets, including crypto. On the market microstructure side, the resignation of Bitcoin developer Gloria Zhao, while not a factor that directly determines the price on its own, reinforced the cautious stance regarding ecosystem stability and governance perception in an already fragile sentiment environment. On the macro side, US Initial Jobless Claims coming in above expectations at 231k and Fed’s Barkin emphasizing his concerns about both inflation and employment reinforced the perception that financial conditions would not ease rapidly, narrowing demand for interest rate-sensitive risky assets. Against this backdrop, renewed selling momentum towards the end of the week made stop-losses and leverage unwinding below broken levels more visible, increasing panic behavior and paving the way for the index to slide more rapidly into the extreme fear zone.
Crypto Fund Flows
Source: Coinshares
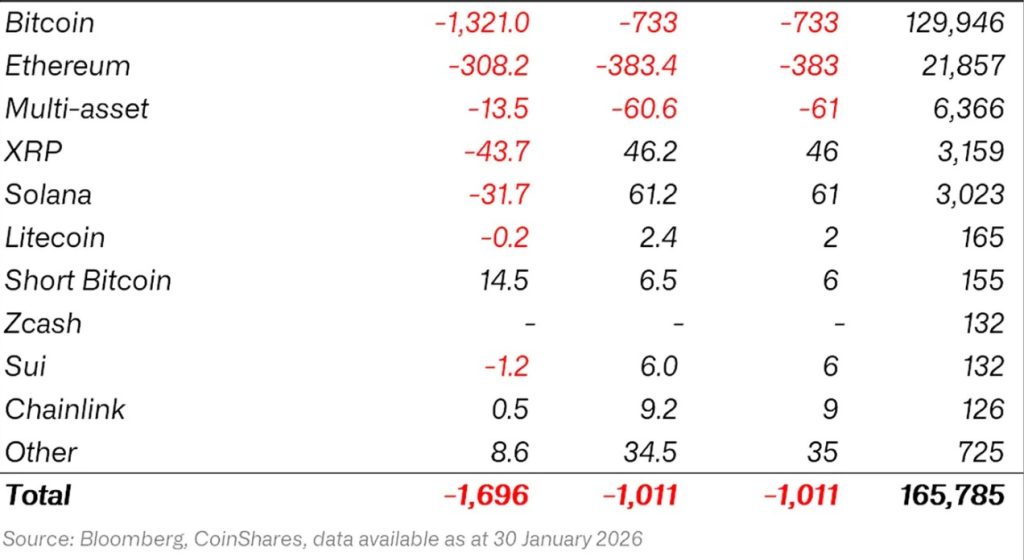
Overview: Crypto markets spent the week focused on the US’s planned operation against Iran and details of the Epstein case. Bitcoin and altcoins also saw significant outflows. As a result, Bitcoin lost more than 15% of its value over the week.
- Short Bitcoin: Short Bitcoin saw an inflow of $14.5 million.
- Chainlink (LINK): Chainlink saw an inflow of $0.5 million.
- Other: Sector-specific and project-based declines in altcoins, along with the overall market sentiment, brought in $8.6 million in fund inflows.
Fund Outflows:
- Bitcoin (BTC): Bitcoin is experiencing significant outflows from investors this week. Bitcoin-focused funds saw an outflow of $1,321.0 million.
- Ethereum (ETH): Along with spot ETH outflows, there was a $308.2 million outflow from Ethereum this week.
- Ripple (XRP): XRP saw $43.7 million in fund outflows this week.
- SUI: There was an outflow of $1.2 million from Sui.
- Solana (SOL): Solana saw inflows of $31.7 million.
- Short Bitcoin: Short Bitcoin saw inflows of $14.5 million.
- Multi-asset: Outflows were observed in the multi-asset group.
Total MarketCap
Source: TradingView
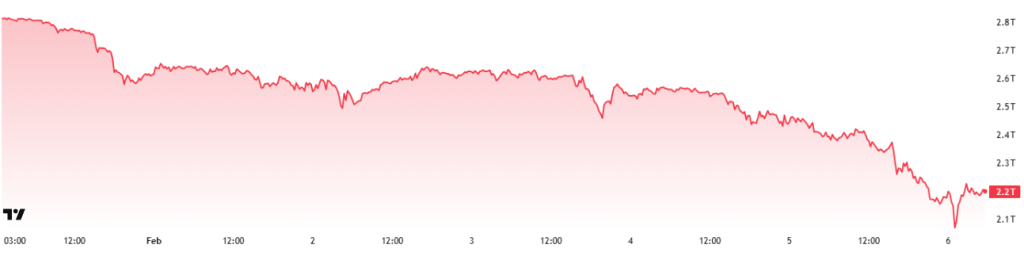
- Last Week’s Market Value:56 Trillion Dollars
- This Week’s Market Value: $2.2 Trillion
This week, the cryptocurrency market experienced a decline of approximately 356 billion USD, falling by 13.9%, with the total market value currently hovering around 2.2 trillion USD. The weekly high was recorded at 2.65 trillion USD, while the low was 2.05 trillion USD. Accordingly, the market moved within a band of ~600 billion USD, indicating 29% volatility during the period. In this context, weekly average candle sizes in the cryptocurrency market rose to above-average levels.
Total 2
The Total 2 index, which started the week with a market value of $1.03 trillion, declined by 11.61% during the week, losing approximately $120 billion, and is currently at $0.907 trillion. The weekly high was recorded at 1.06 trillion USD, while the low was 0.851 trillion USD. The index fluctuated within a band of 213 billion USD, corresponding to volatility of approximately 25.06% for the period.
With this outlook, Total 2 continues to trade below its all-time high of approximately $859 billion. It is estimated that an upward movement of approximately 94.46% is required for it to reach its previous peak from current levels.
Total 3
The Total 3 index, which started the week with a total market value of $753 billion, declined by approximately $75 billion during the week, falling 10% to currently stand at $678 billion. Volatility between the weekly high and low was measured at 21.14%.
The fact that the indices’ proportional ranking based on volatility is “Total > Total 2 > Total 3” indicates that the volatile decline is clearly concentrated on the Bitcoin side, followed by Ethereum and other altcoins’ average . Additionally, it is noteworthy that Ethereum’s increased dominance in the total market share during the current period stems from market share taken from Bitcoin rather than altcoins.
Altcoin Season Index
Source: Coinmarketcap
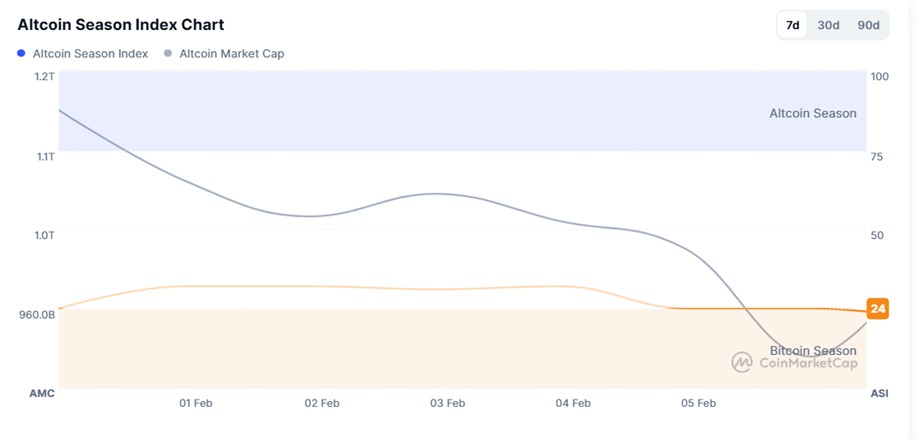
- Last Week’s Index Value: 29/100
- This Week’s Index Value: 24/100
Between January 30 and February 6, 2026, there was a decline in the correlation between altcoin market dominance (Altcoin Market Cap) and the Altcoin Season Index. The chart shows that Altcoin Market Cap reached its highest point this week on February 3 , at 1.08T. Towards the end of the week, selling pressure increased, leading to a decline in market dominance. The top 5 coins leading the index when it rose this week were SKY, MYX, PAXG, XAUt, and CHZ. In summary, the Altcoin Season Index declined this week, indicating a relative decrease in the total market value of altcoins compared to Bitcoin.
Bitcoin Dominance
Source: Tradingview
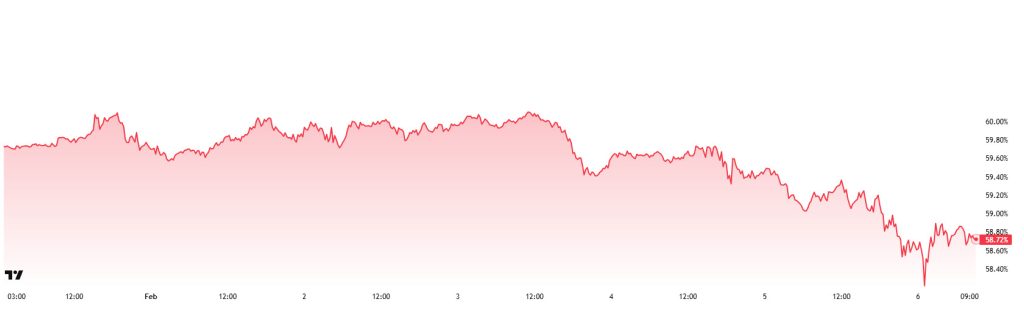
Weekly Change
- Last Week’s Level:28%
- This Week’s Level:72%
Bitcoin dominance, which started the week at 59.93%, retreated to 58.48% levels during the week but subsequently rose slightly and is currently at 58.72%.
This week, Strategy purchased 855 Bitcoin, Vanadi Treasury purchased 10 Bitcoin, and DDC Enterprise purchased 105 Bitcoin. Additionally, data on Bitcoin spot ETFs shows a net outflow of $689.2 million to date.
Weekly data reveals that Strategy continues to buy Bitcoin, while DDC Enterprise has also started taking regular long positions recently. This picture shows that the long-term accumulation trend on the institutional side has seen a limited increase. On the other hand, continued net outflows among ETF investors indicate that the short-term selling trend is prevailing. While Bitcoin has maintained its decisive role in recent market movements, Ethereum and major altcoins have been affected by these movements to a limited extent at times, but mostly significantly. However, the current market structure does not indicate a strong break in Bitcoin dominance. In this context, Bitcoin dominance is likely to continue within the 58%–61% range in the coming week.
Ethereum Dominance
Source: Tradingview
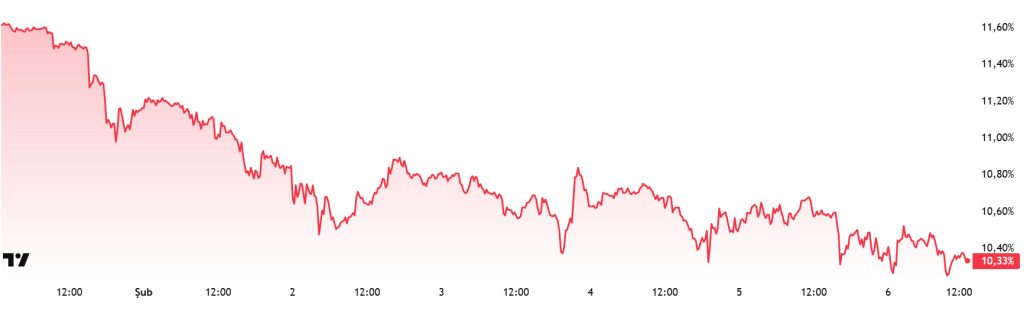
Weekly Change:
- Last Week’s Level: 10.68%
- This Week’s Level: 1 0.33%
Ethereum dominance, which rose to 15% levels in mid-August, lost momentum in the following period and entered a downward trend. This negative outlook progressed to 13% levels with a positive correction until the last week of November. However, it faced strong resistance at this level and reversed direction downward again.
In this context, Ethereum dominance ended last week at 10.68% and is currently trading at around 10.33%. During the same period, Bitcoin dominance followed a similar negative trend to Ethereum dominance.
The key developments affecting Ethereum dominance are as follows:
ETHZilla (ETHZ), an Ethereum-focused digital asset treasury company, is delving deeper into tokenization by purchasing a $4.7 million portfolio of prefabricated and modular housing loans. The company plans to tokenize the portfolio of 95 loans on the Ethereum layer-2 network and aims to convert these loans into cash flow-generating digital tokens accessible through Liquidity.io, a regulated broker-dealer and trading system.
Optimism Governance announced today that 6,400 ETH will be transferred between wallets. The transaction will be carried out as part of the Optimism Collective treasury’s liquid staking process. Forty percent of the total 21,500 ETH treasury will be allocated to liquid staking protocols. The remaining assets will be staked on the Ethereum mainnet.
Bitmine Ethereum Accumulation: Bitmine purchased an additional 41,788 Ethereum last week. The company’s total Ethereum holdings rose to 4,285,125 ETH. With this purchase, Bitmine maintained its status as one of the largest institutional Ethereum treasuries. The detailed cost of the purchases was not disclosed.
Bitcoin Spot ETF
Source: Darkex Research Department
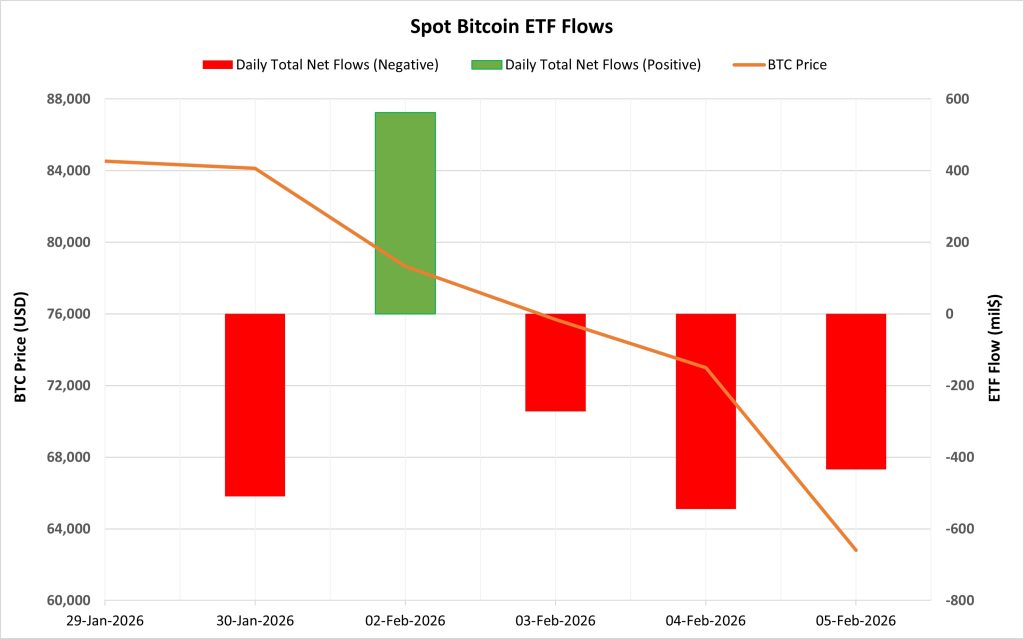
Netflow Status: Between January 30 and February 5, 2026, there was a total net outflow of $1.198 billion from Spot Bitcoin ETFs. The series of negative flows seen over the last three trading days contributed to the overall negative result. There were particularly sharp net outflows on February 4 and February 5. Outflows were primarily concentrated in BlackRock IBIT and Fidelity FBTC.
Bitcoin Price: Bitcoin opened at $84,524 on January 30 and closed at $62,809 on February 5. During this period, the BTC price lost 25.69% of its value. The fact that prices and ETF flows moved negatively in the same direction indicated that selling pressure also strengthened on the institutional side.
Cumulative Net Inflow: By the end of the 517th trading day, the cumulative total net inflow into Spot Bitcoin ETFs had declined to $54.3 billion.
| Date | Coin | Open | Close | Change % | ETF Flow (mil$) |
|---|---|---|---|---|---|
| January 30, 2026 | BTC | 84,524 | 84,122 | -0.48% | -509.7 |
| 02-Feb-2026 | BTC | 76,920 | 78,668 | 2.27% | 561.8 |
| 03-Feb-2026 | BTC | 78,668 | 75,683 | -3.79% | -272.0 |
| February 4, 2026 | BTC | 75,683 | 73,007 | -3.54% | -544.9 |
| February 5, 2026 | BTC | 73,007 | 62,809 | -13.97% | -434.1 |
| Total for January 30–February 5, 2026 | -25.69% | -1,198.9 |
Spot Bitcoin ETFs showed a predominantly negative picture during this period. Although the strong inflows seen on February 2 created hopes for a short-term recovery, the lack of follow-through indicated that institutional investors continued to reduce risk. Outflows accelerated in the last two days of the week, supporting the sharp decline in prices. The strong correlation between ETF flows and price declines revealed that the selling momentum was institutionally supported. In the coming period, if outflows from ETFs slow down or strong inflows resume, a short-term stabilization in the Bitcoin price may be seen. However, if the current flow structure persists, downward pressure and high volatility may continue.
Ethereum spot ETF
Source: Darkex Research Department
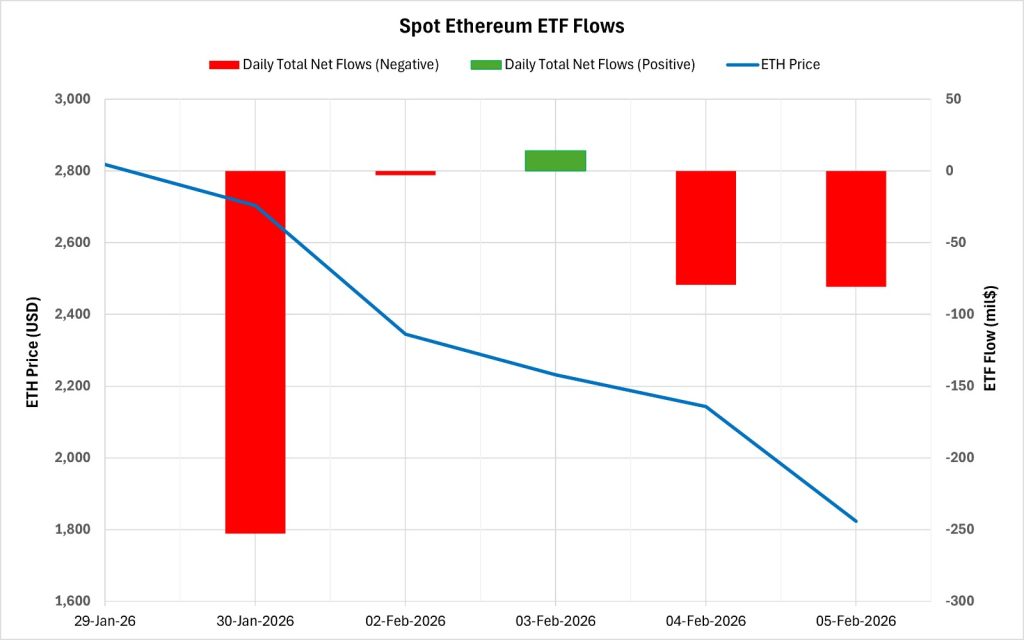
Between January 30 and February 5, 2026, a total of $402 million in net outflows occurred from Spot Ethereum ETFs. During this period, ETF flows were predominantly negative, with only $14 million in net inflows observed on February 3, 2026. Looking at the funds, the majority of outflows originated from BlackRock ETHA and Fidelity FETH. By the end of the 387th trading day, the cumulative total net inflow for Spot Ethereum ETFs had declined to 11.856 billion dollars.
| Date | Coin | Open | Close | Change % | ETF Flow (mil$) |
|---|---|---|---|---|---|
| Jan 30, 2026 | ETH | 2,818 | 2,703 | -4.06% | -252.9 |
| 02-Feb-2026 | ETH | 2,269 | 2,345 | 3.34% | -2.9 |
| 03-Feb-2026 | ETH | 2,345 | 2,231 | -4.85% | 14.0 |
| 04-Feb-2026 | ETH | 2,231 | 2,143 | -3.94% | -79.4 |
| February 5, 2026 | ETH | 2,143 | 1,823 | -14.93% | -80.8 |
| Total for January 30–February 5, 2026 | -35.29% | -402.0 |
Ethereum opened at $2,818 on January 30 and closed at $1,823 on February 5. During this period, the ETH price lost 35.29% of its value. This period saw a synchronized weakening in both price and ETF flows. On the institutional side, risk appetite clearly decreased, and outflows increased pressure on the price. In the coming days, if outflows from ETFs slow down or meaningful inflows resume, a short-term stabilization in the ETH price may be seen. However, if the negative flow trend continues, downward pressure and volatility are likely to persist.
Bitcoin Options Distribution
Source: Laevitas
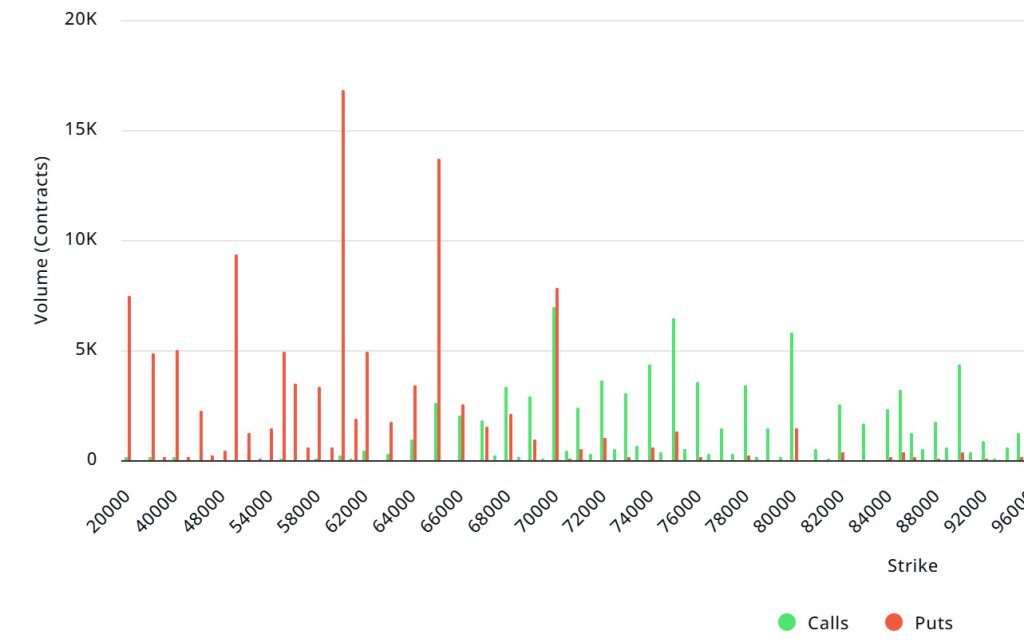
BTC: Notional: $2.15B | Put/Call: 1.42 | Max Pain: $82K
Deribit Data: Deribit data shows that BTC option contracts with a nominal value of approximately $2.15 billion expire today. At the same time, looking at the risk transformation over the next week based on data from the last 24 hours, put options are dominating over call options in terms of risk hedging. When examining expected volatility (IV), it is trading below realized volatility (RV). On the other hand, the negative spread metric indicates a decline in market risk appetite and suggests that put options are expensive.
Laevitas Data: Examining the chart, we see that put options are concentrated in a wide band between $60,000 and $90,000. Call options, on the other hand, are spread across a wide base between $80,000 and $100,000. At the same time, the $70,000 level appears to be resistance, while the $60,000 level appears to be support. On the other hand, there are 14.62k put options at the $60,000 level, peaking here and showing a decline in put volume after this level. Furthermore, 10.60K call option contracts peak at the $100,000 level. Looking at the options market, we see that put contracts dominate on a daily and weekly basis.
Option Maturity:
Put/Call Ratio and Maximum Pain Point: Looking at the options in the latest 7-day data from Laevitas, the number of call options increased by approximately 102% compared to last week, reaching 168.96K. In contrast, the number of put options increased by 260% compared to last week, reaching 215.78K. The put/call ratio for options is set at 1.42. This indicates that there is less demand for call options than put options among investors. Bitcoin’s maximum pain point is seen at $82,000. BTC is currently priced at $65,000 on , and if it fails to break above the pain point of $82,000, further declines can be anticipated.
Ethereum Options Distribution
Source: Laevitas
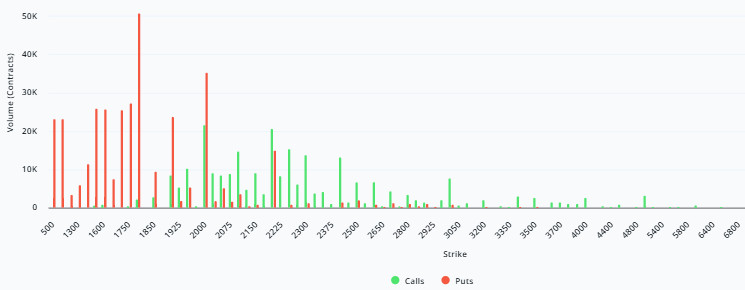
ETH: $421.9 M notional | Put/Call: 0.91 | Max Pain: $2,400
Laevitas Data: Looking at the data in the chart, we see that put options are concentrated in a fairly narrow band, particularly at price levels between $1,700 and $1,800. The highest put volume is at the $1,800 level, with approximately 51K contracts. On the other hand, in call options, there is a noticeable concentration at the $2,000 to $2,100 levels. The highest call volume appears to be approximately 35K at the $2,000 level.
Deribit Data: First, in the short term, ATM volatility rose to 120 on a daily basis, showing a strong increase on a daily basis. In addition, total volume increased by 88% to approximately $200 million. Call volume rose by 168% to $101 million, while put volume increased by 43% to $98 million. This indicates that there is no clear consensus on the direction on a daily basis, and therefore hedge positions have strengthened. The 25D Risk Reversal remains in negative territory, indicating that put options are relatively more expensive and that downside risks are being priced in more heavily.
Option Maturity:
Ethereum options with a nominal value of $421.9 million expired on February 6. The Max Pain level was calculated at $2,400, while the put/call ratio stood at 0.91.
Legal Notice
The investment information, comments, and recommendations contained in this document do not constitute investment advisory services. Investment advisory services are provided by authorized institutions on a personal basis, taking into account the risk and return preferences of individuals. The comments and recommendations contained in this document are of a general nature. These recommendations may not be suitable for your financial situation and risk and return preferences. Therefore, making an investment decision based solely on the information contained in this document may not result in outcomes that align with your expectations.
