
Fear & Greed Index
Source: Alternative.me
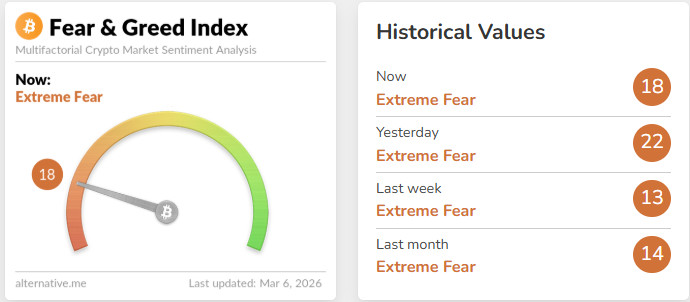
- Change in Fear and Greed Value: +5
- Last Week’s Level: 13
- This Week’s Level: 18
Although the Fear and Greed Index rose from 13 last week to 18 this week, signaling an increase in investor sentiment, it did not change the state of extreme fear. Looking at historical data, investor sentiment has remained at extreme fear levels since last month. The Santiment analysis highlights that the Bitcoin price moves in parallel with the fear and greed index. Although there are institutional flows, it shows that Bitcoin is a market that still needs to develop in the long term, undermining its safe haven perception.
This week, the index’s transition to 20, approaching the end of the extreme fear phase, shifts sentiment to the fear level. This may signal a continuation of the partial recovery in the Bitcoin price. On the other hand, while tensions continue on the geopolitical front, the price not showing the expected negative impact stands out as a promising development for the market.
Fund Flows
Source: Coinshares
Overview:
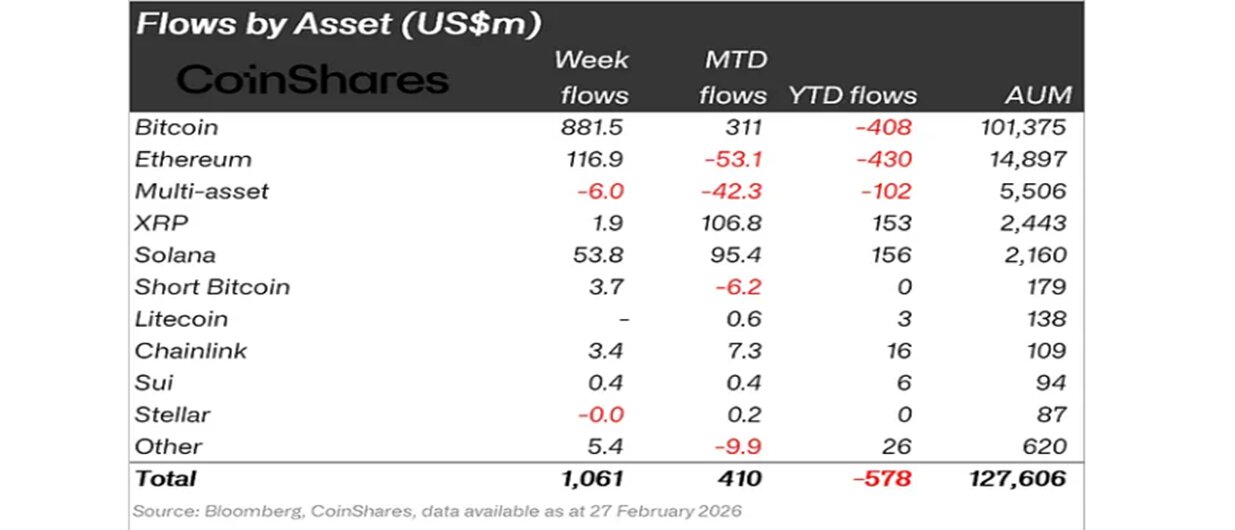
The partial recovery seen in cryptocurrencies this week appears to be reflected in fund flow data. Although the geopolitical environment has affected market sentiment, there have been significant inflows into Bitcoin, Ethereum, and Solana funds.
Overall Outlook
- Weekly total inflows: $1.061 billion
- MTD (Month-to-date): +$410 million
- YTD (Year-to-date): -578 million $
Approximately 83% of weekly fund inflows went to Bitcoin.
- Bitcoin weekly inflows: $881.5M – Institutional investors continue to favor BTC during risk-averse periods.
- Ethereum weekly inflows: $116.9 million – Weekly inflows have started, but: there are still institutional outflows for the month and year overall.
- Solana Weekly inflow: $53.8M – Solana has the strongest institutional demand among altcoins. Both monthly and YTD are positive.
Total MarketCap
“
Source: TradingView
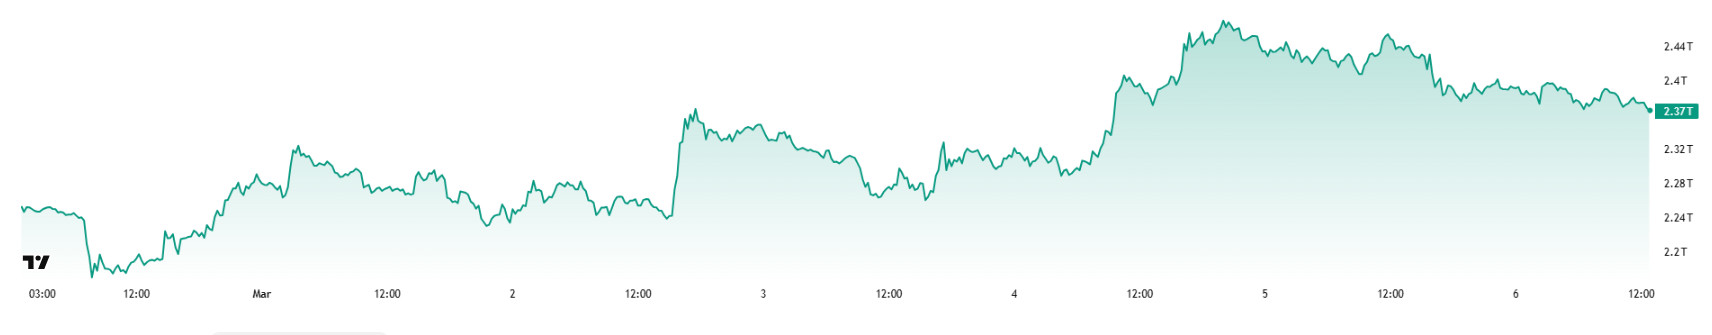
- Last Week’s Market Value: $2.25 Trillion
- This Week’s Market Value: $2.36 Trillion
This week, the cryptocurrency market rose by approximately 10 billion USD, increasing by 2.62%, and the total market cap is currently hovering around 2.36 trillion USD. The weekly high was recorded at 2.46 trillion USD, while the low was 2.19 trillion USD.
Total 2
The Total 2 index, which started the week with a market value of $959.22 billion, rose 0.41% during the week. The weekly high was $994 billion, while the low was $905 billion. The index fluctuated within a band of $89 billion, corresponding to approximately 7% volatility for the period.
Total 3
The Total 3 index, which started the week with a total market value of USD 698.72 billion, rose by approximately USD 0.05% during the week and is currently at USD 705.87 billion.
The fact that the indices are ranked proportionally according to volatility as “Total > Total 2 > Total 3” indicates that fluctuations occurred on the Bitcoin side, followed by Ethereum and the average of other altcoins.
Bitcoin Dominance
Source: Tradingview
“BTC.D Visual to be Added”
Weekly Change
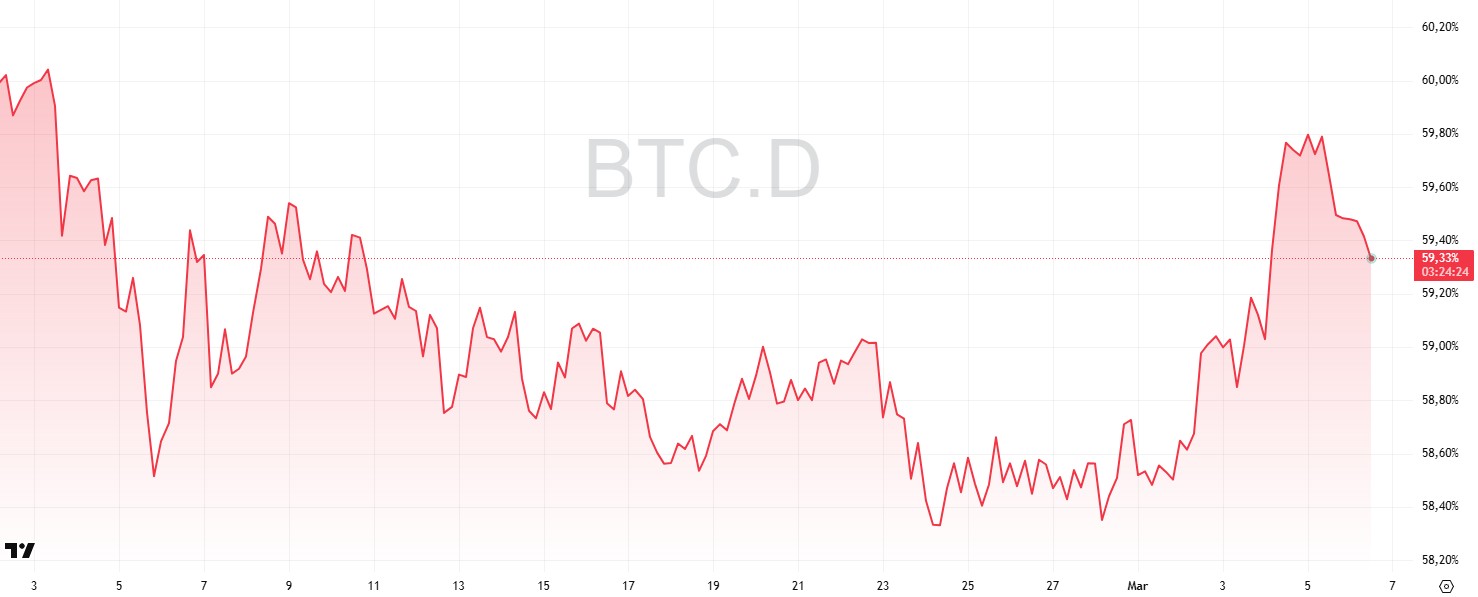
- Last Week’s Level:56%
- This Week’s Level:36%
Bitcoin dominance started the week in the 58.40% – 58.50% range and remained flat with limited fluctuations until the middle of the week. During this period, dominance occasionally retreated to the 58.30% level, but it failed to remain below this level. However, starting in the second half of the week, dominance experienced a rapid rise, particularly with the strengthening of Bitcoin’s price, and tested the week’s highest level at 59.80%. Although a limited pullback occurred afterward, dominance is currently hovering around 59.33%.
On the corporate buying side, institutional players such as Strategy, which stood out in previous weeks, appear to be continuing their regular Bitcoin accumulation strategies. However, it is noteworthy that large-scale new treasury purchases have not yet gained momentum in the market as a whole, and companies are acting more cautiously at current price levels.
Looking at the overall picture, Bitcoin dominance showed a strong recovery in the second half of the week, along with net inflows on the ETF side, indicating that a significant portion of market liquidity has shifted back to Bitcoin. The weakening observed in the altcoin market, particularly on the Ethereum side, during the same period is also emerging as one of the factors supporting this rise. Technically, the dominance settling back above the 59% level indicates that Bitcoin continues to maintain its weight in the market in the short term. In the coming period, the 58% level can continue to be monitored as an important support, while the 60% – 61% band can be monitored as a strong resistance zone. If the current structure persists, Bitcoin dominance is expected to continue fluctuating within the 58%–61% range in the short term.
Bitcoin Spot ETF
Source: Darkex Research Department
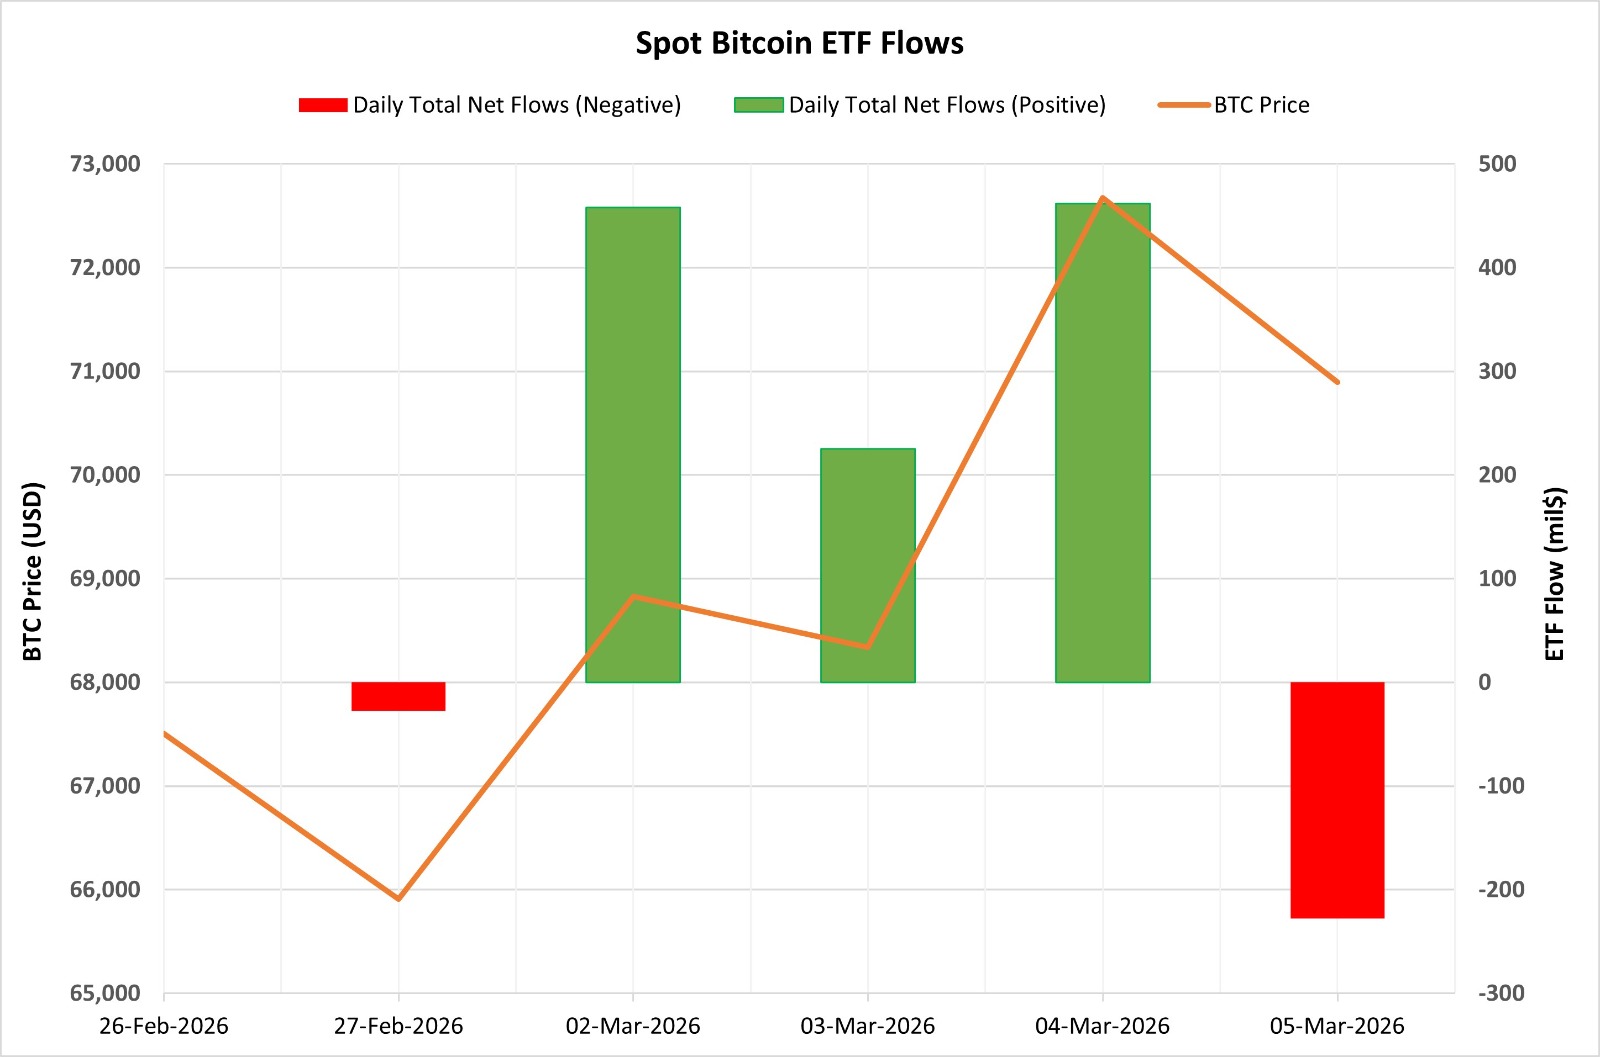
Netflow Status: Between February 27 and March 5, 2026, a total of $889.7 million in net outflows occurred from Spot Bitcoin ETFs. The recovery in inflows into Bitcoin ETFs, despite weak performance in February, indicates that institutional interest is regaining momentum. The highest net inflow by fund was $771 million on the BlackRock IBIT side.
Cumulative Net Inflow: The cumulative total net inflow of Spot Bitcoin ETFs rose to $55.7 billion at the end of the 536th trading day.
| Date | Coin | Open | Close | Change % | ETF Flow (mil$) |
|---|---|---|---|---|---|
| February 27, 2026 | BTC | 67,485 | 65,872 | -2.39% | -27.55 |
| 02-Mar-2026 | 65,776 | 68,830 | 4.49% | 458.19 | |
| March 3, 2026 | 68,830 | 68,338 | -0.71% | 225.15 | |
| 04-Mar-2026 | 68,338 | 72,666 | 6.33% | 461.77 | |
| March 5, 2026 | 72,666 | 70,890 | -2.44% | -227.83 | |
| Total for February 27 – March 5, 2026 | 5.05% | 889.73 |
During this period, institutional demand for Spot Bitcoin ETFs strengthened. The recovery seen in the Bitcoin price was also supported by ETF inflows. The accelerated inflows over the last three trading days indicate a rise in short-term risk appetite. If steady inflows into ETFs continue, the rise in the BTC price is also expected to continue. However, if a negative inflow trend begins, downward pressure and increased volatility may continue.
Spot Ethereum ETF
Source: Darkex Research Department
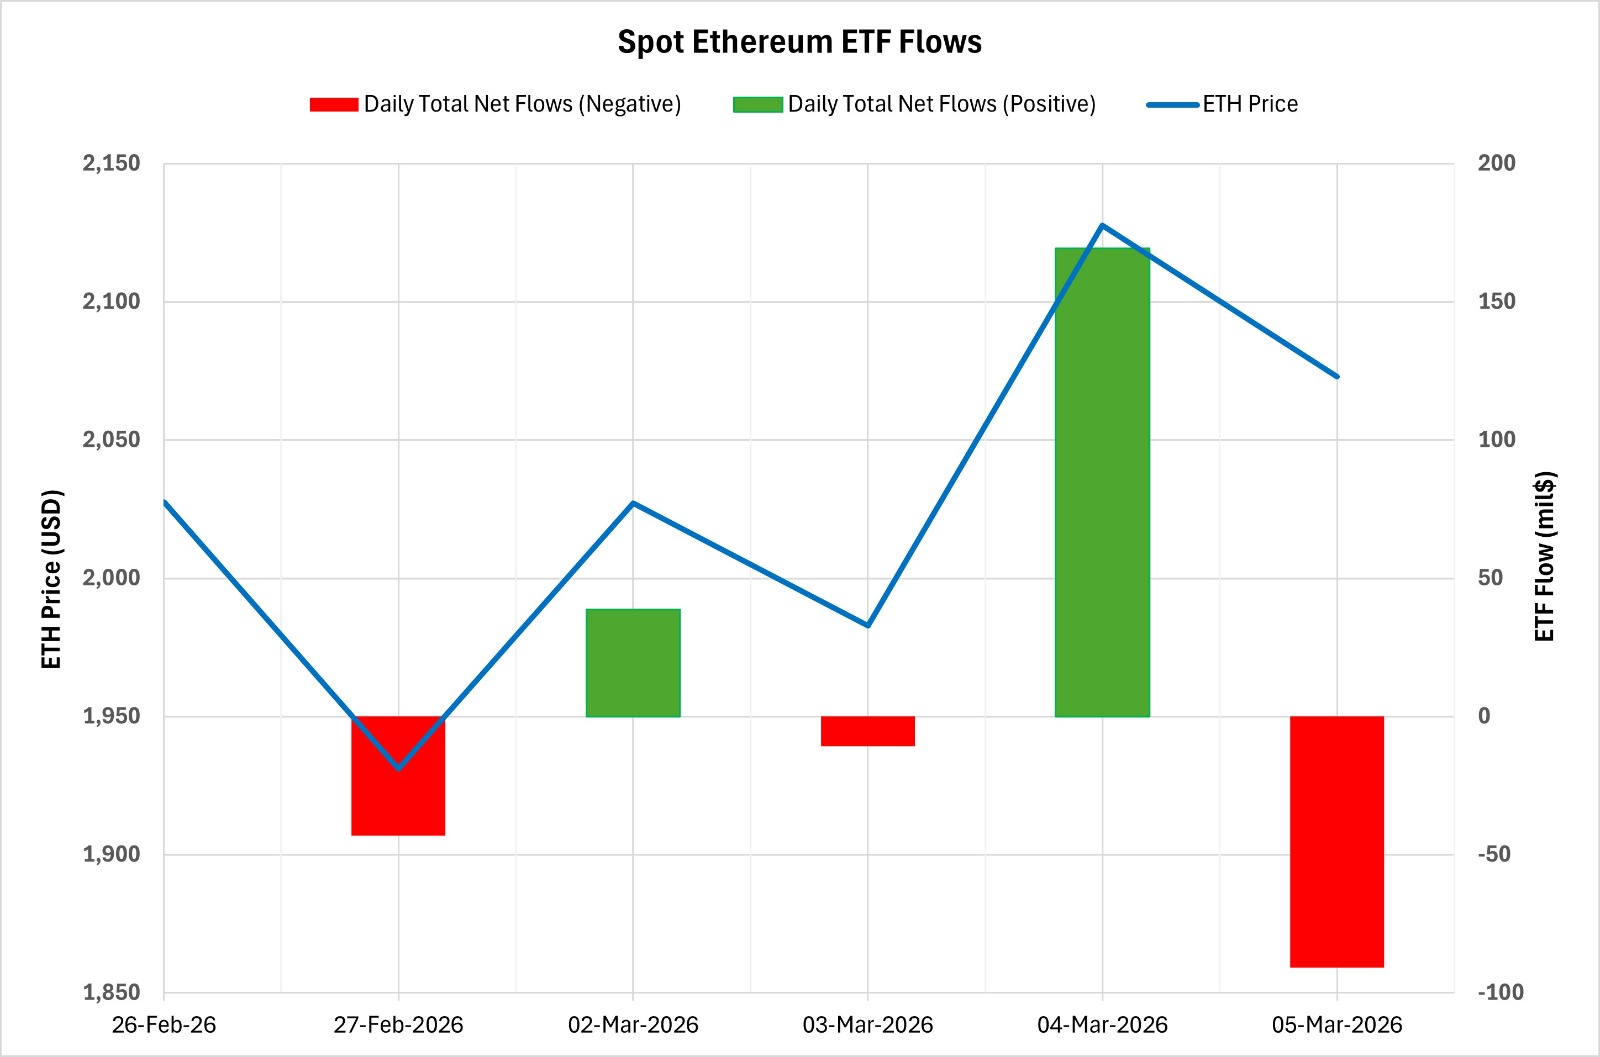
Between February 27 and March 5, 2026, Spot Ethereum ETFs saw a total net inflow of $63.4 million. During this period, ETF flows did not show a clear direction and appeared volatile. Looking at the funds, BlackRock ETHA stood out with a net inflow of $95 million. With these developments, the cumulative total net inflow of Spot Ethereum ETFs rose to $11.74 billion at the end of the 406th trading day.
| Date | Coin | Open | Close | Change | ETF Flow (mil$) |
|---|---|---|---|---|---|
| February 27, 2026, | ETH | 2,028 | 1,931 | -4.76% | -43 |
| 02-Mar-2026 | 1,940 | 2,027 | 4.48% | 38.7 | |
| March 3, 2026 | 2,027 | 1,983 | -2.19% | -10.8 | |
| 04-Mar-2026 | 1,983 | 2,128 | 7.31% | 169.4 | |
| March 5, 2026 | 2,128 | 2,073 | -2.58% | -90.9 | |
| Total for February 27 – March 5, 2026 | 2.24% | 63.4 |
On the price side, Ethereum opened at $2,028 on February 27 and closed at $2,073 on March 5. During this period, the ETH price gained 2.24%. In particular, the strong 7.31% rise seen on March 4 coincided with high inflows on the ETF side on the same day. Overall, this period revealed a picture where no clear direction emerged in ETF flows and institutional investors maintained their cautious stance. In the coming days, more stable inflows on the ETF side could provide a more solid foundation for Ethereum’s price recovery. However, if flows remain directionless and volatile, the price is likely to continue fluctuating.
Legal Notice
The investment information, comments, and recommendations contained in this document do not constitute investment advisory services. Investment advisory services are provided by authorized institutions on a personal basis, taking into account the risk and return preferences of individuals. The comments and recommendations contained in this document are of a general nature. These recommendations may not be suitable for your financial situation and risk and return preferences. Therefore, making an investment decision based solely on the information contained in this document may not result in outcomes that align with your expectations.
