
MARKET SUMMARY
Latest Situation in Crypto Assets
| Assets | Last Price | 24h Change | Dominance | Market Cap. |
|---|---|---|---|---|
| BTC | 99,039.75 | -1.32% | 54.47% | 1,96 T |
| ETH | 3,885.93 | -2.64% | 13.01% | 467,98 B |
| XRP | 2.439 | -4.72% | 3.87% | 139,12 B |
| SOLANA | 229.43 | -3.35% | 3.03% | 109,04 B |
| DOGE | 0.4416 | -4.92% | 1.80% | 64,89 B |
| CARDANO | 1.136 | -6.36% | 1.11% | 39,85 B |
| TRX | 0.3022 | -4.30% | 0.72% | 26,08 B |
| AVAX | 50.80 | -2.25% | 0.58% | 20,75 B |
| SHIB | 0.00003037 | -6.06% | 0.50% | 17,90 B |
| LINK | 25.30 | -6.91% | 0.44% | 15,85 B |
| DOT | 9.721 | -7.79% | 0.41% | 14,84 B |
*Prepared on 12.9.2024 at 14:00 (UTC)
WHAT’S LEFT BEHIND
New Bitcoin purchase from MicroStrategy: Officially announced
MicroStrategy bought Bitcoin again. The company, which announced that it bought Bitcoin every Lunedì for the last 4 weeks, announced that it bought 21,550 BTC between Dicembre 2-8. 2.1 billion dollars was paid for Bitcoins.
El Salvador Backtracks on Bitcoin Policies
In line with a $1.3 billion loan agreement with the IMF, El Salvador is moving to change Bitcoin and some of its related laws. This step is considered a significant change to the country’s 2021 policy of recognizing Bitcoin as a legal currency.
Stablecoin Regulation Step from Hong Kong
Hong Kong has unveiled a comprehensive draft law on stablecoin regulation. The new regulation aims to address the financial risks of stablecoins with an innovative approach in line with global standards. This initiative is considered an important step in Hong Kong’s goal of becoming a digital asset center.
Riot Platforms’ $500 Million Bond Plan
Riot Platforms announced plans to issue $500 million of convertible senior notes due 2030. There is an option for an additional $75 million in additional bonds. The bond proceeds will be used for the purchase of Bitcoin and general corporate purposes. The notes are arranged to be convertible into cash, equities, or both.
HIGHLIGHTS OF THE DAY
Importanti dati del calendario economico
*There is no important calendar data for the rest of the day.
INFORMATION:
*Il calendario si basa sul fuso orario UTC (Coordinated Universal Time).
Il contenuto del calendario economico sulla pagina corrispondente è ottenuto da fornitori di notizie e dati affidabili. Le notizie contenute nel calendario economico, la data e l'ora dell'annuncio delle notizie, le possibili variazioni delle cifre precedenti, delle aspettative e delle cifre annunciate sono state realizzate dalle istituzioni fornitrici di dati. Darkex non può essere ritenuta responsabile di eventuali cambiamenti che potrebbero derivare da situazioni simili.
MARKET COMPASS
Global markets started the week with an agenda dominated by political developments and followed the latest news from South Korea and Syria. China is said to be close to taking new steps to support its economy. Moreover, France remained on the agenda in Europe. On the first day of the week with weak macro data flow, digital assets made a retreating start. However, there is new news that institutional investor interest may increase and companies may buy Bitcoin. After Microsoft, Amazon seems to be the next giant company to consider buying BTC. In addition, MicroStrategy announced that it bought another 21,550 BTC.
While the US stock markets are expected to make a horizontal start to the day, the dollar index gave back the rises it recorded in the first hours of the day. Digital assets, on the other hand, are trying to react to their losses in the last hours. Although there are news flows that support digital assets to continue the rise, we can consider the limited gains as a sign for a new retreat. We think that the market interest should have been more pronounced in order for the effect of the statements that institutional purchases were and would continue. In this parallel, if the recent reaction rises remain limited, retracements may become more pronounced. Nevertheless, it is useful to underline that our basic direction is up.
From the short term to the big picture….
The victory of former President Trump on Novembre 5, which was one of the main pillars of our bullish expectation for the long-term outlook in digital assets, produced a result in line with our predictions. Afterwards, the appointments made by the president-elect and the expectations of increased regulation of the crypto ecosystem in the US continued to take place in our equation as a positive variable. Although Powell gave cautious messages in his last speech, the continuation of the FED’s interest rate cut cycle and the volume in BTC ETFs indicating an increase in institutional investor interest (in addition to MicroStrategy’s BTC purchases, Microsoft’s start to evaluate the purchase issue, BlackRock’s BTC ETF options started trading…) support our upward forecast for the big picture for now.
In the short term, given the nature of the market and pricing behavior, we think it would not be surprising to see occasional pauses or pullbacks in digital assets. However, at this point, it is worth emphasizing again that the fundamental dynamics continue to be bullish. We evaluate the recent declines in major crypto assets within this framework.
TECHNICAL ANALYSIS
BTC/USDT
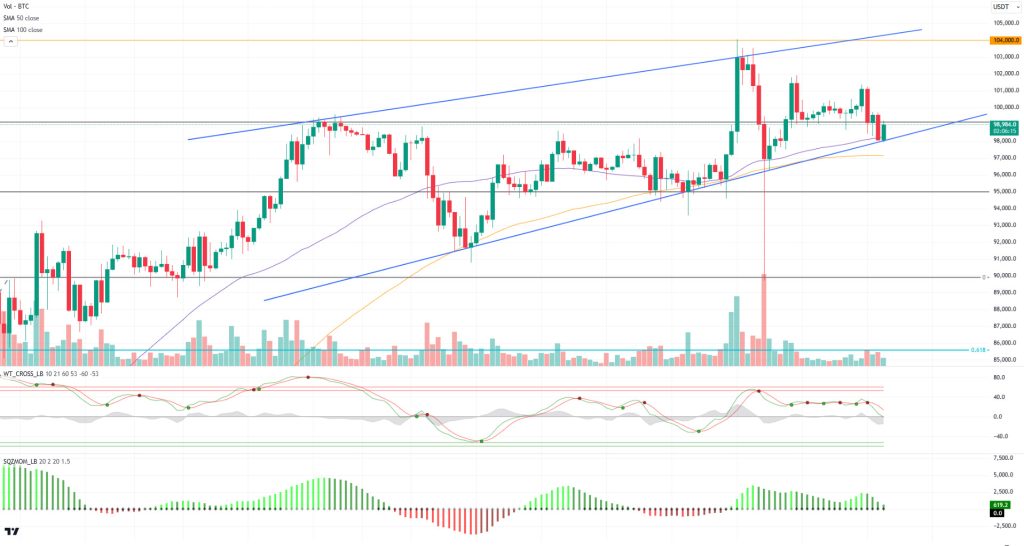
Microstrategy continues to buy Bitcoin at full speed. According to MicroStrategy’s official announcement, the company reported that from Dicembre 2 to Dicembre 8, the company purchased 21,550 Bitcoins in cash for about $2.1 billion, with an average price per Bitcoin of about $98,783. As of Dicembre 9, MicroStrategy and its subsidiaries own a total of 423,650 BTC, with a total purchase cost of about $25.6 billion and an average purchase price per Bitcoin of about $60,324.
When we look at the technical outlook with the latest development, the price, which touched the bottom line of the trend during the day, reacted and turned its direction upwards. In BTC, which is currently trading at 99,000, technical oscillators continue to maintain the sell signal, while we see that the momentum indicator is getting weaker. Fundamental developments continue to limit corrections in Bitcoin price. While stock market indices in global markets follow a positive course, eyes will be on the US stock markets ahead of inflation data. While the minor resistance level of 90,140 levels awaits us in the continuation of the rise, it may test over 100,000 again if it is exceeded. In a possible pullback, we will follow the trend bottom line and SMA levels of 97,900, 97,200.
Supports 99,140 – 97,200 – 95,000
Resistances 100,000 – 101,100 – 104,000
ETH/USDT
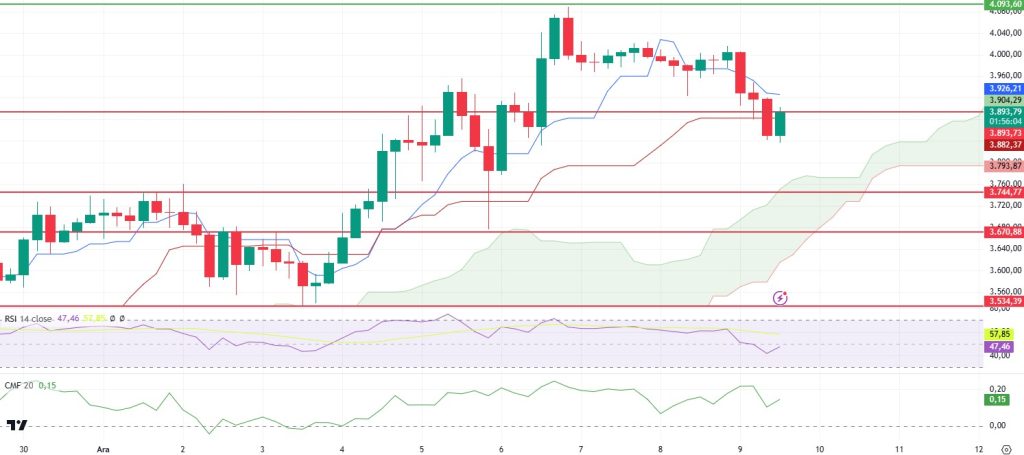
ETH started the week with a decline and fell below the 3,893 support. However, in this process, it was observed that funding fee rates reached healthy levels. After the decline, technical indicators present a positive picture for ETH, which reacted from the 3.840 level during the day and rose above the 3.893 region again.
Relative Strength Index (RSI) data indicates that the correction is on a very positive ground, while Chaikin Money Flow (CMF) and momentum indicators are on the rise, indicating that the market’s appetite for buying has increased. In addition, the increase in Cumulative Volume Delta (CVD) data supports that the spot market is gaining strength and the upside may continue if the price holds at 3,893.
In this scenario, the 4,093 level stands out as the main resistance. In case this resistance zone is broken, the price can be expected to turn to sharper rises. On the other hand, closes below the 3,893 level may pull the price back to 3,744 levels.
Supports 3,893 – 3,744 – 3,670
Resistances 4,093 – 4,299 – 4,474
XRP/USDT
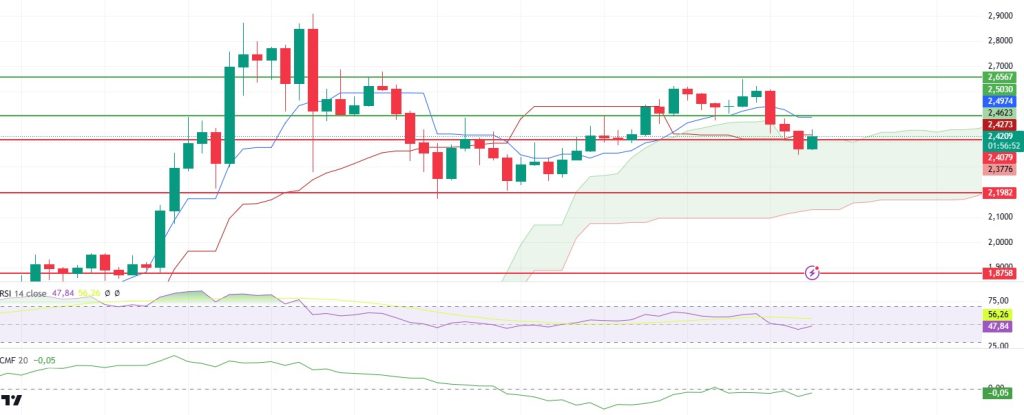
Despite the decline in Bitcoin, XRP is maintaining its bullish trend, regaining the Kumo Cloud support at 2.41, which it lost during the day. The upward movement of the Chaikin Money Flow (CMF) and Relative Strength Index (RSI) indicators, combined with the buy signal on the Ichimoku indicator, supports the potential for the price to rise to 2.65. Price movements above this level may accelerate the uptrend. On the other hand, closes below 2.41 may weaken the momentum and cause the price to retreat to 2.19 levels.
Supports 2.4110 – 1.1982- 1.8758
Resistances 2.6567 – 2.7330 – 3.105
SOL/USDT
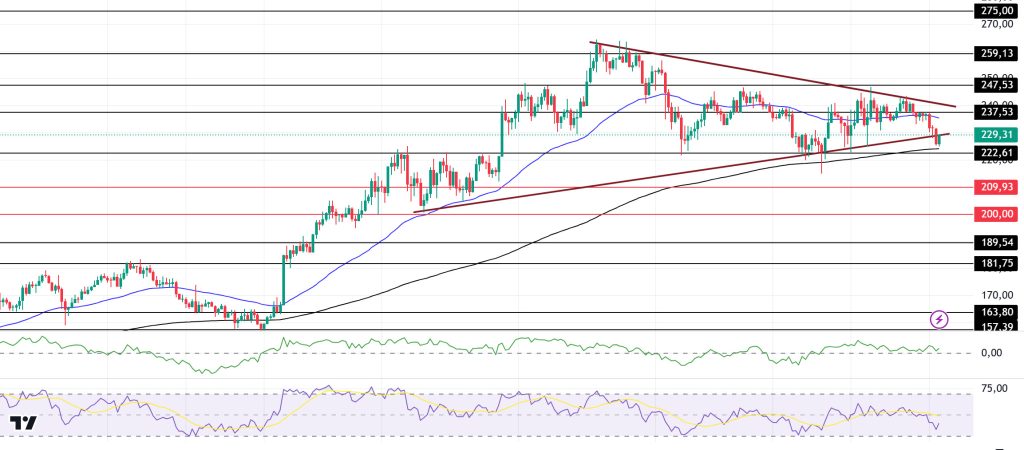
On the 4-hour timeframe, the 50 EMA (Blue Line) is above the 200 EMA (Black Line). Since Novembre 22, SOL has been in a downtrend and although it broke the downtrend, we can say that this was a rise due to the general market. As a matter of fact, although the price started to rise with support from the 200 EMA, momentum and price started to fall again. When we examine the Chaikin Money Flow (CMF)20 indicator, we see that there is also a decline in money inflows. This can be shown as a downward signal. However, Relative Strength Index (RSI)14 accelerated from the mid-level to the overbought zone. On the other hand, the symmetrical triangle pattern has broken to the downside and received support from the 200 EMA. This could push the asset’s value lower. The 247.53 level is a very strong resistance point in the uptrend driven by both macroeconomic conditions and innovations in the Solana ecosystem. If it breaks here, the rise may continue. In case of retracements due to possible macroeconomic reasons or profit sales, support levels 222.61 and 189.54 may be triggered again. If the price reaches these support levels, a potential bullish opportunity may arise if momentum increases.
Supports 222.61 – 209.93 – 200.00
Resistances 237.53 – 247.53 – 259.13
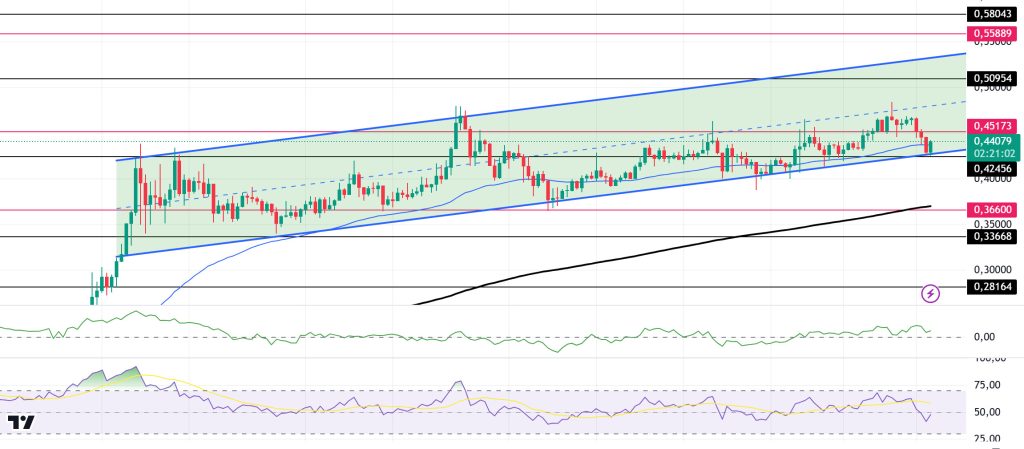
DOGE/USDT
According to Santiment data, Dogecoin’s active addresses reached a new all-time high of 9.52 million. More than 9,400 transactions were recorded on-chain in the last 24 hours. In actual token terms, this equates to 60.9 billion DOGE, with a dollar value of about $26 billion.
When we look at the chart, the asset, which has been in an uptrend since Novembre 11, has managed to stay in the trend by getting support from the base level of the trend, but it has started to accelerate downwards. If this movement is strong, the 0.36600 level may be triggered. On the 4-hour timeframe, the 50 EMA (Blue Line) is above the 200 EMA (Black Line). But the gap between the two averages is still too wide. This may cause pullbacks. On the other hand, when we look at the RSI 14 indicator, we see that it is moving towards its neutral level. However, when we examine the Chaikin Money Flow (CMF)20 indicator, we see that there is a small amount of money inflows. The 0.50954 level appears to be a very strong resistance level in the rises driven by both macroeconomic conditions and innovations in Doge coin. If DOGE maintains its momentum and rises above this level, the rise may continue strongly. In case of retracements due to possible macroeconomic reasons or profit sales, the 0.36600 support level can be triggered again. If the price reaches these support levels, a potential bullish opportunity may arise if momentum increases.
Supports 0.42456 – 0.36600 – 0.33668
Resistances 0.45173 – 0.50954 – 0.55889
AVVISO LEGALE
Le informazioni sugli investimenti, i commenti e le raccomandazioni contenute nel presente documento non costituiscono una consulenza sugli investimenti. I servizi di consulenza sugli investimenti sono forniti individualmente da istituzioni autorizzate che tengono conto delle preferenze di rischio e di rendimento dei singoli individui. I commenti e le raccomandazioni contenuti nel presente documento sono di natura generale. Tali raccomandazioni potrebbero non essere adatte alla vostra situazione finanziaria e alle vostre preferenze di rischio e rendimento. Pertanto, prendere una decisione di investimento basandosi esclusivamente sulle informazioni contenute nel presente documento potrebbe non produrre risultati in linea con le vostre aspettative.
