
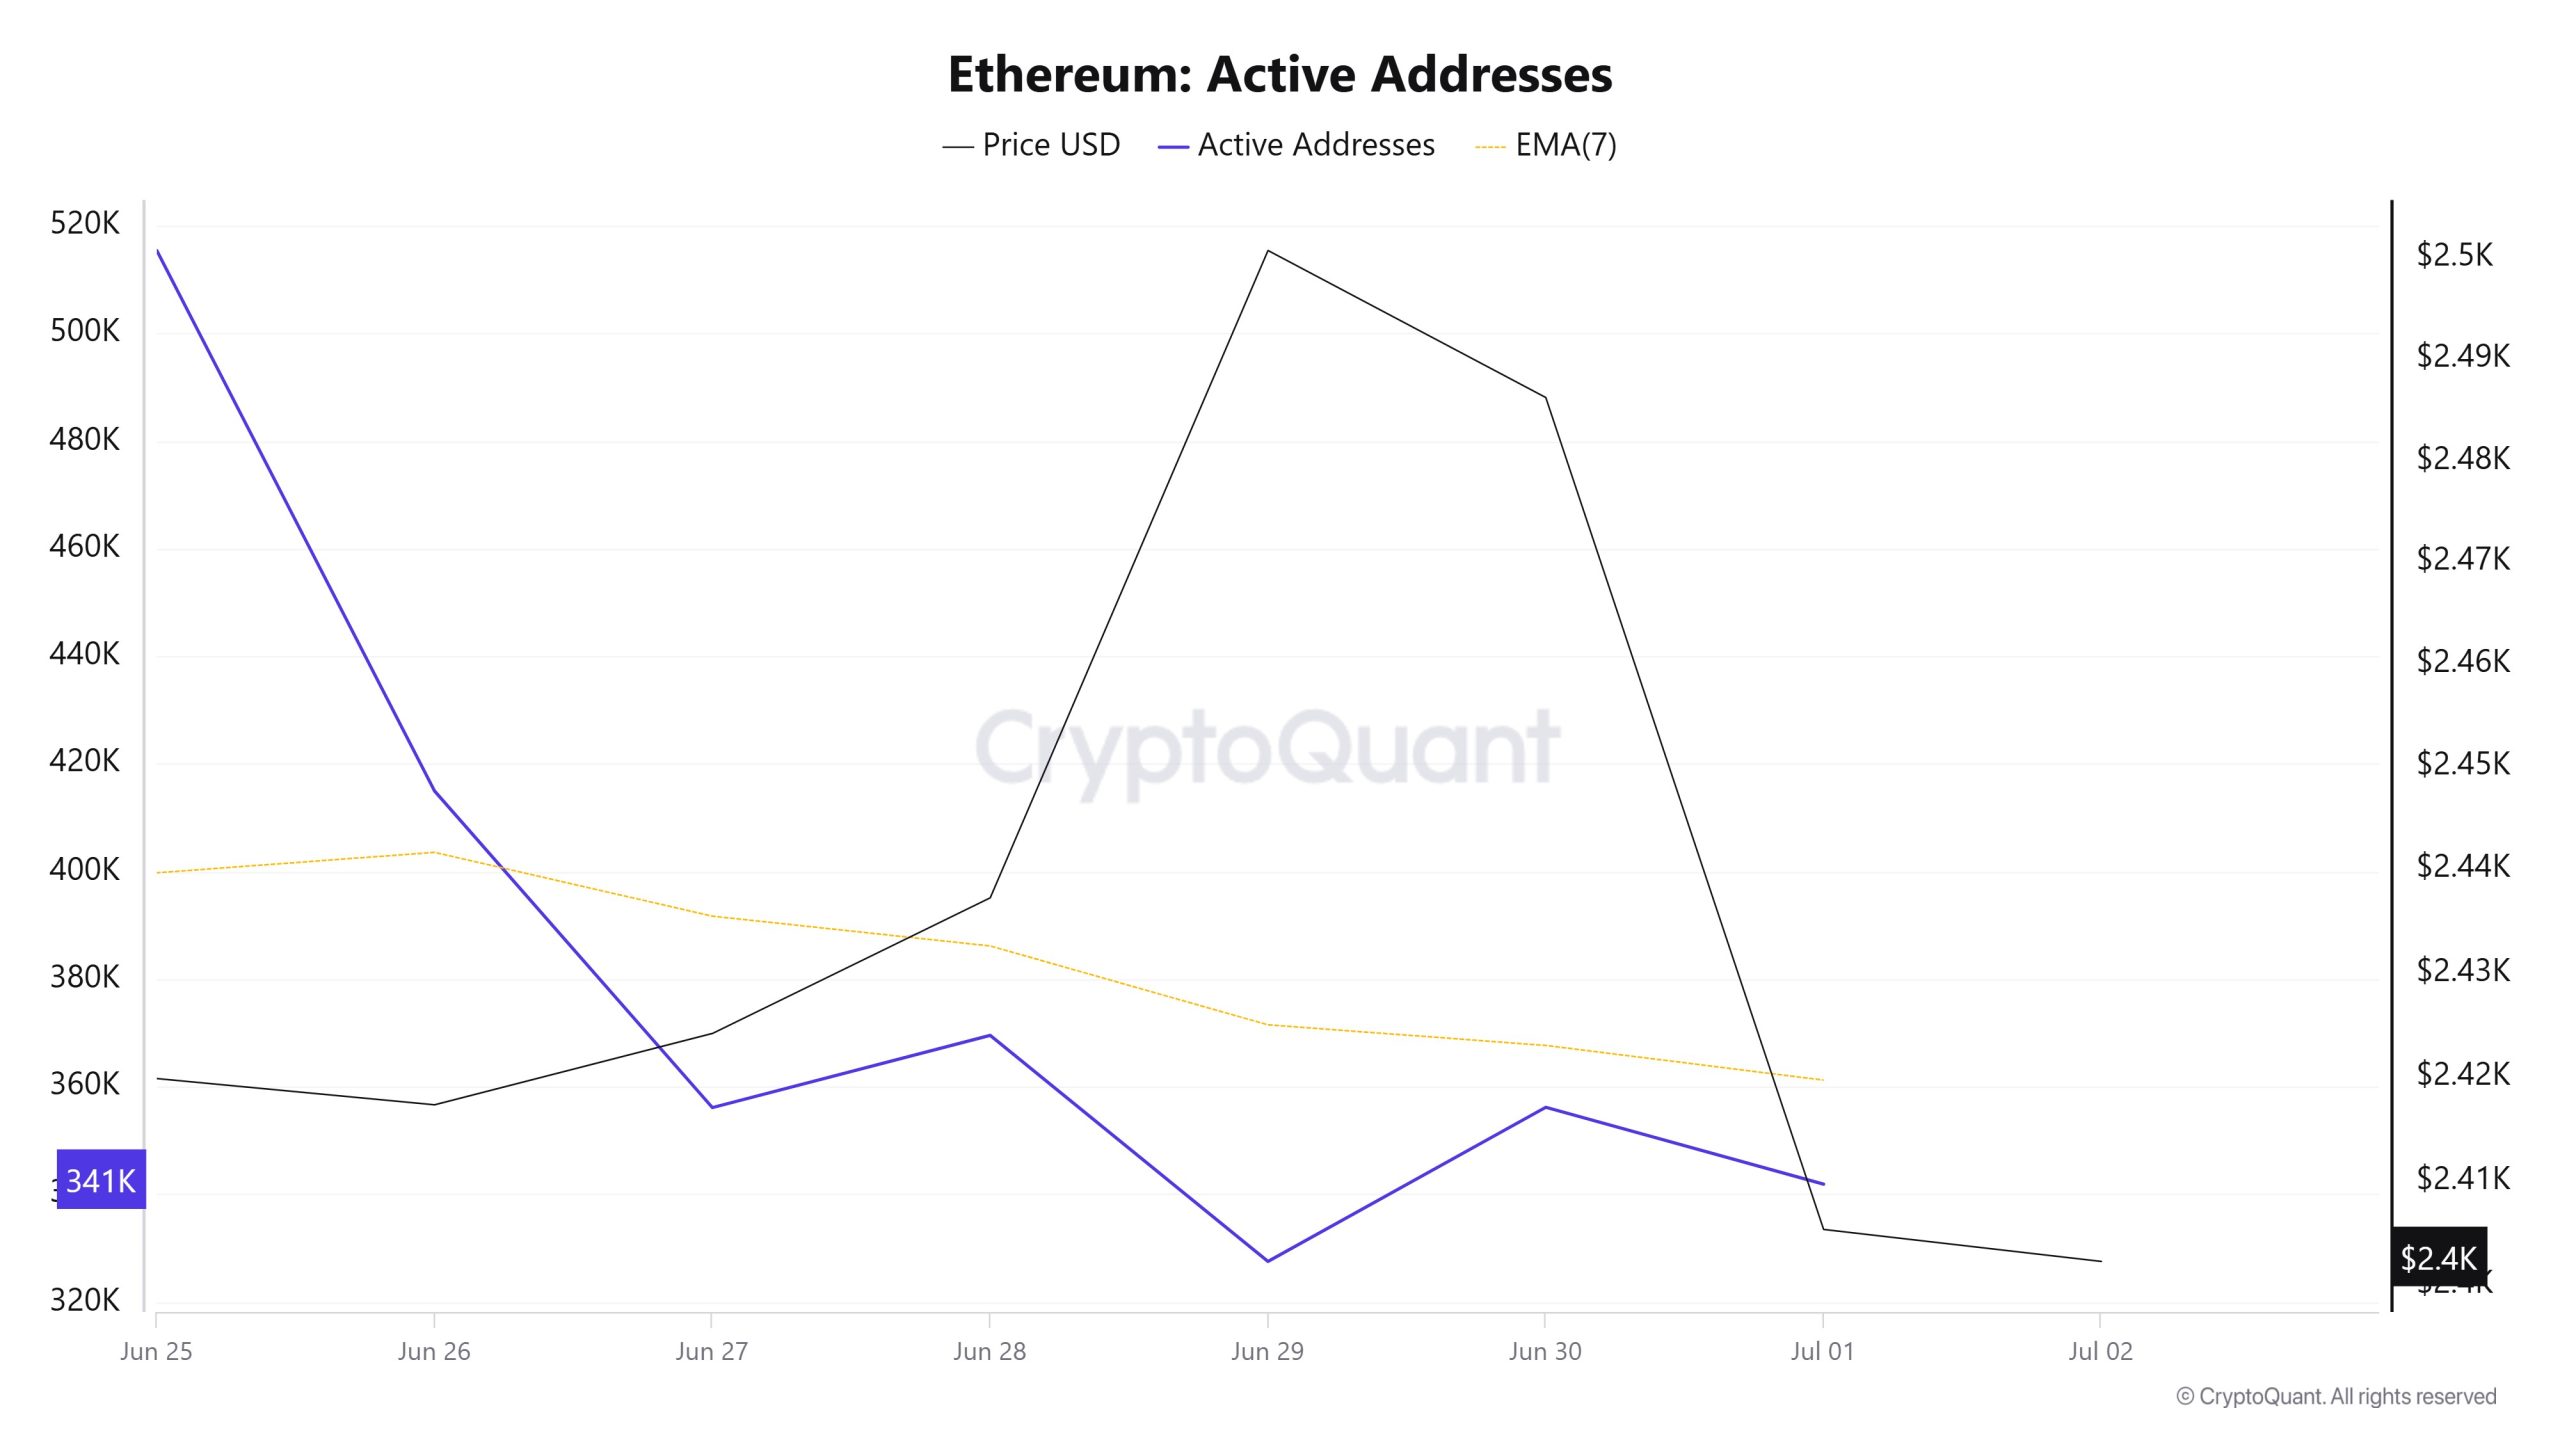
Indirizzi attivi
Between Giugno 25 and Luglio 2, there were a total of 327,501 active logins to the Ethereum network. During this time, the price of Ethereum rose from $2,419 to $2,500. On Giugno 27, at the intersection of the price and the number of active addresses, a drop in the number of active addresses was observed despite the buying. When the 7-day simple moving average (SMA) is analyzed, a downward trend is observed in the Ethereum price.
Indirizzi di invio attivi
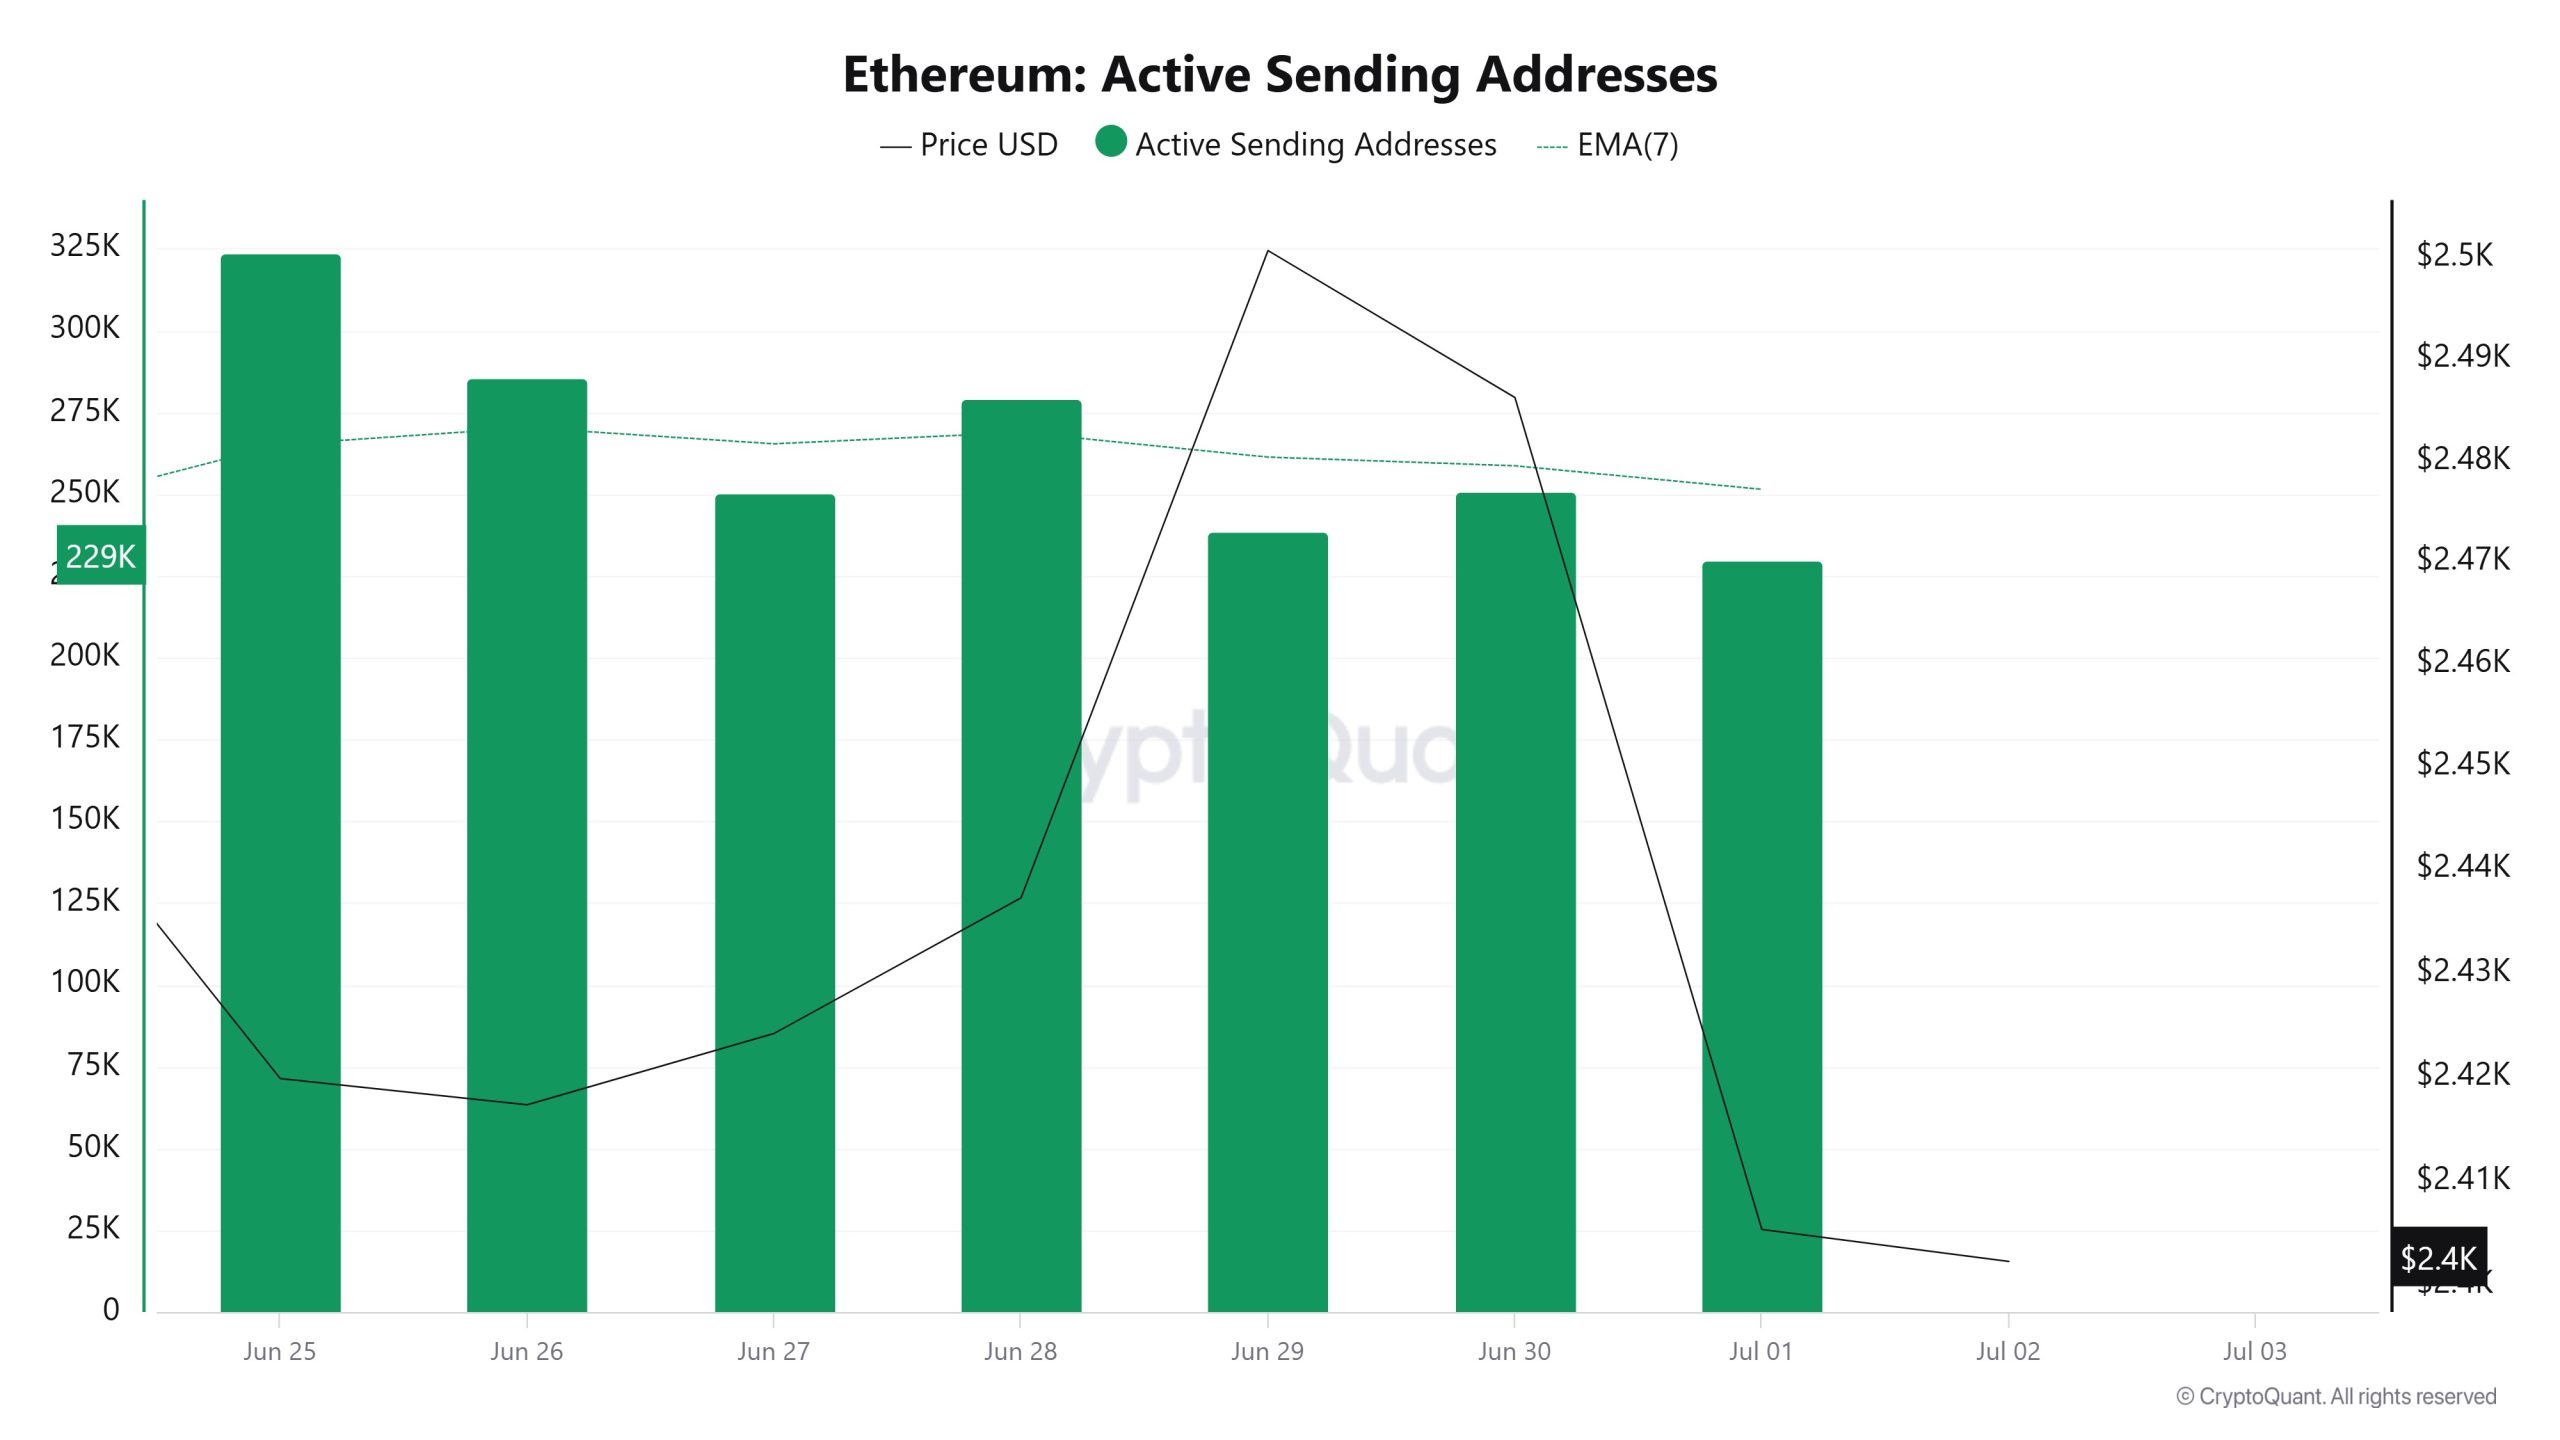
Between Giugno 25 and Luglio 2, there was a bearish movement in active shipping addresses with the Black Line (price line). On the day when the price reached its weekly high, active shipping addresses were 238,730, while on Luglio 1, the day Ethereum hit its weekly low, this number dropped to 229,897. This caused the Ethereum price to fall to $ 2,407.
Indirizzi di ricezione attivi
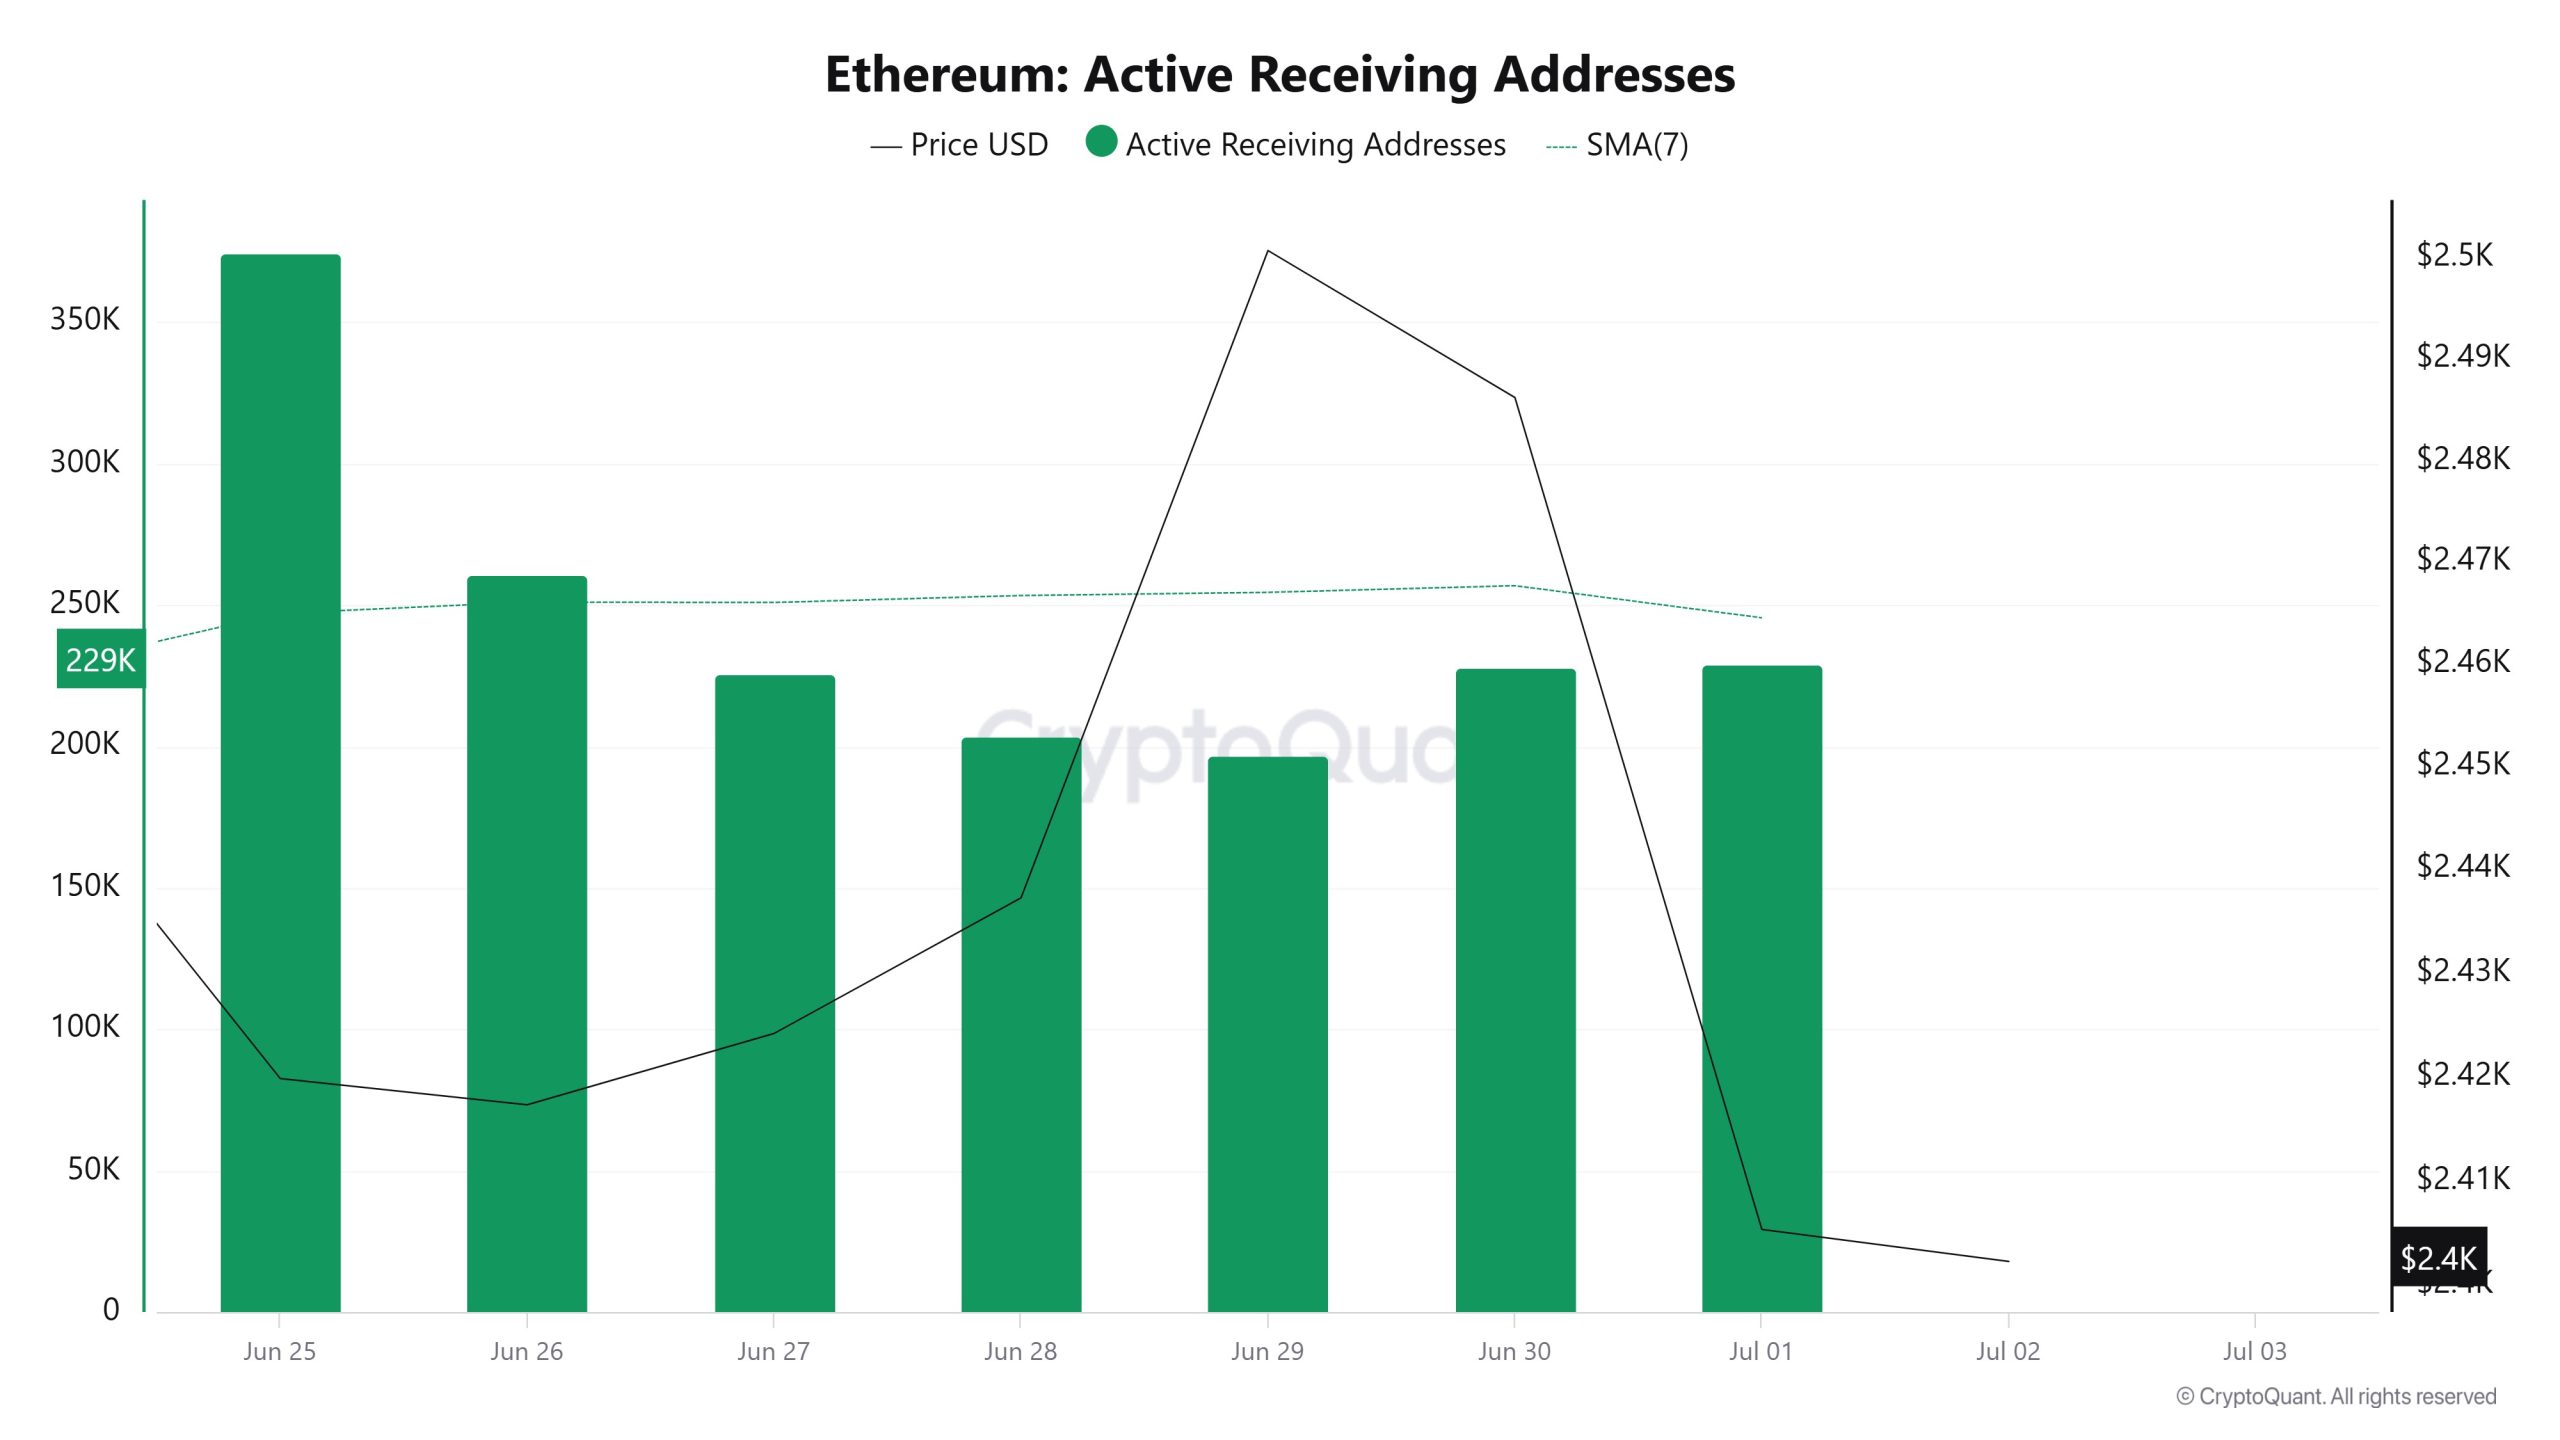
Between Giugno 25 and Luglio 2, there was a significant decline in the number of active buy addresses and a parallel decline in the price. On the day of the price high, active receiving addresses fell to 196,817, indicating that buying has slowed down.
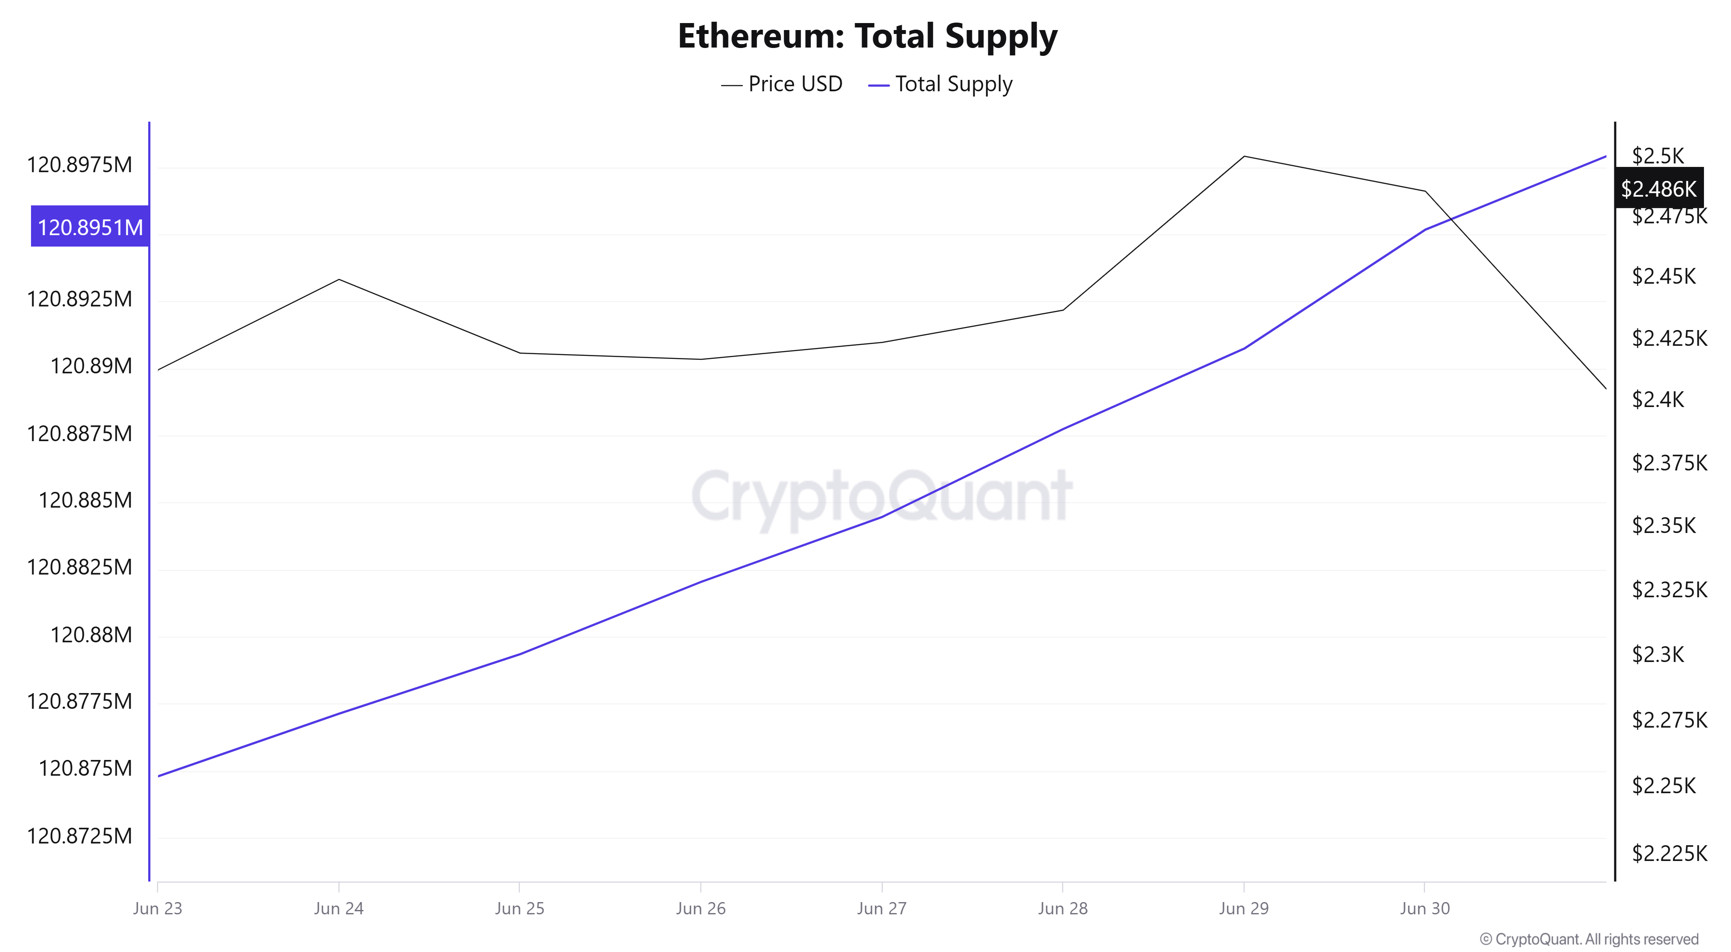
Valore totale puntato
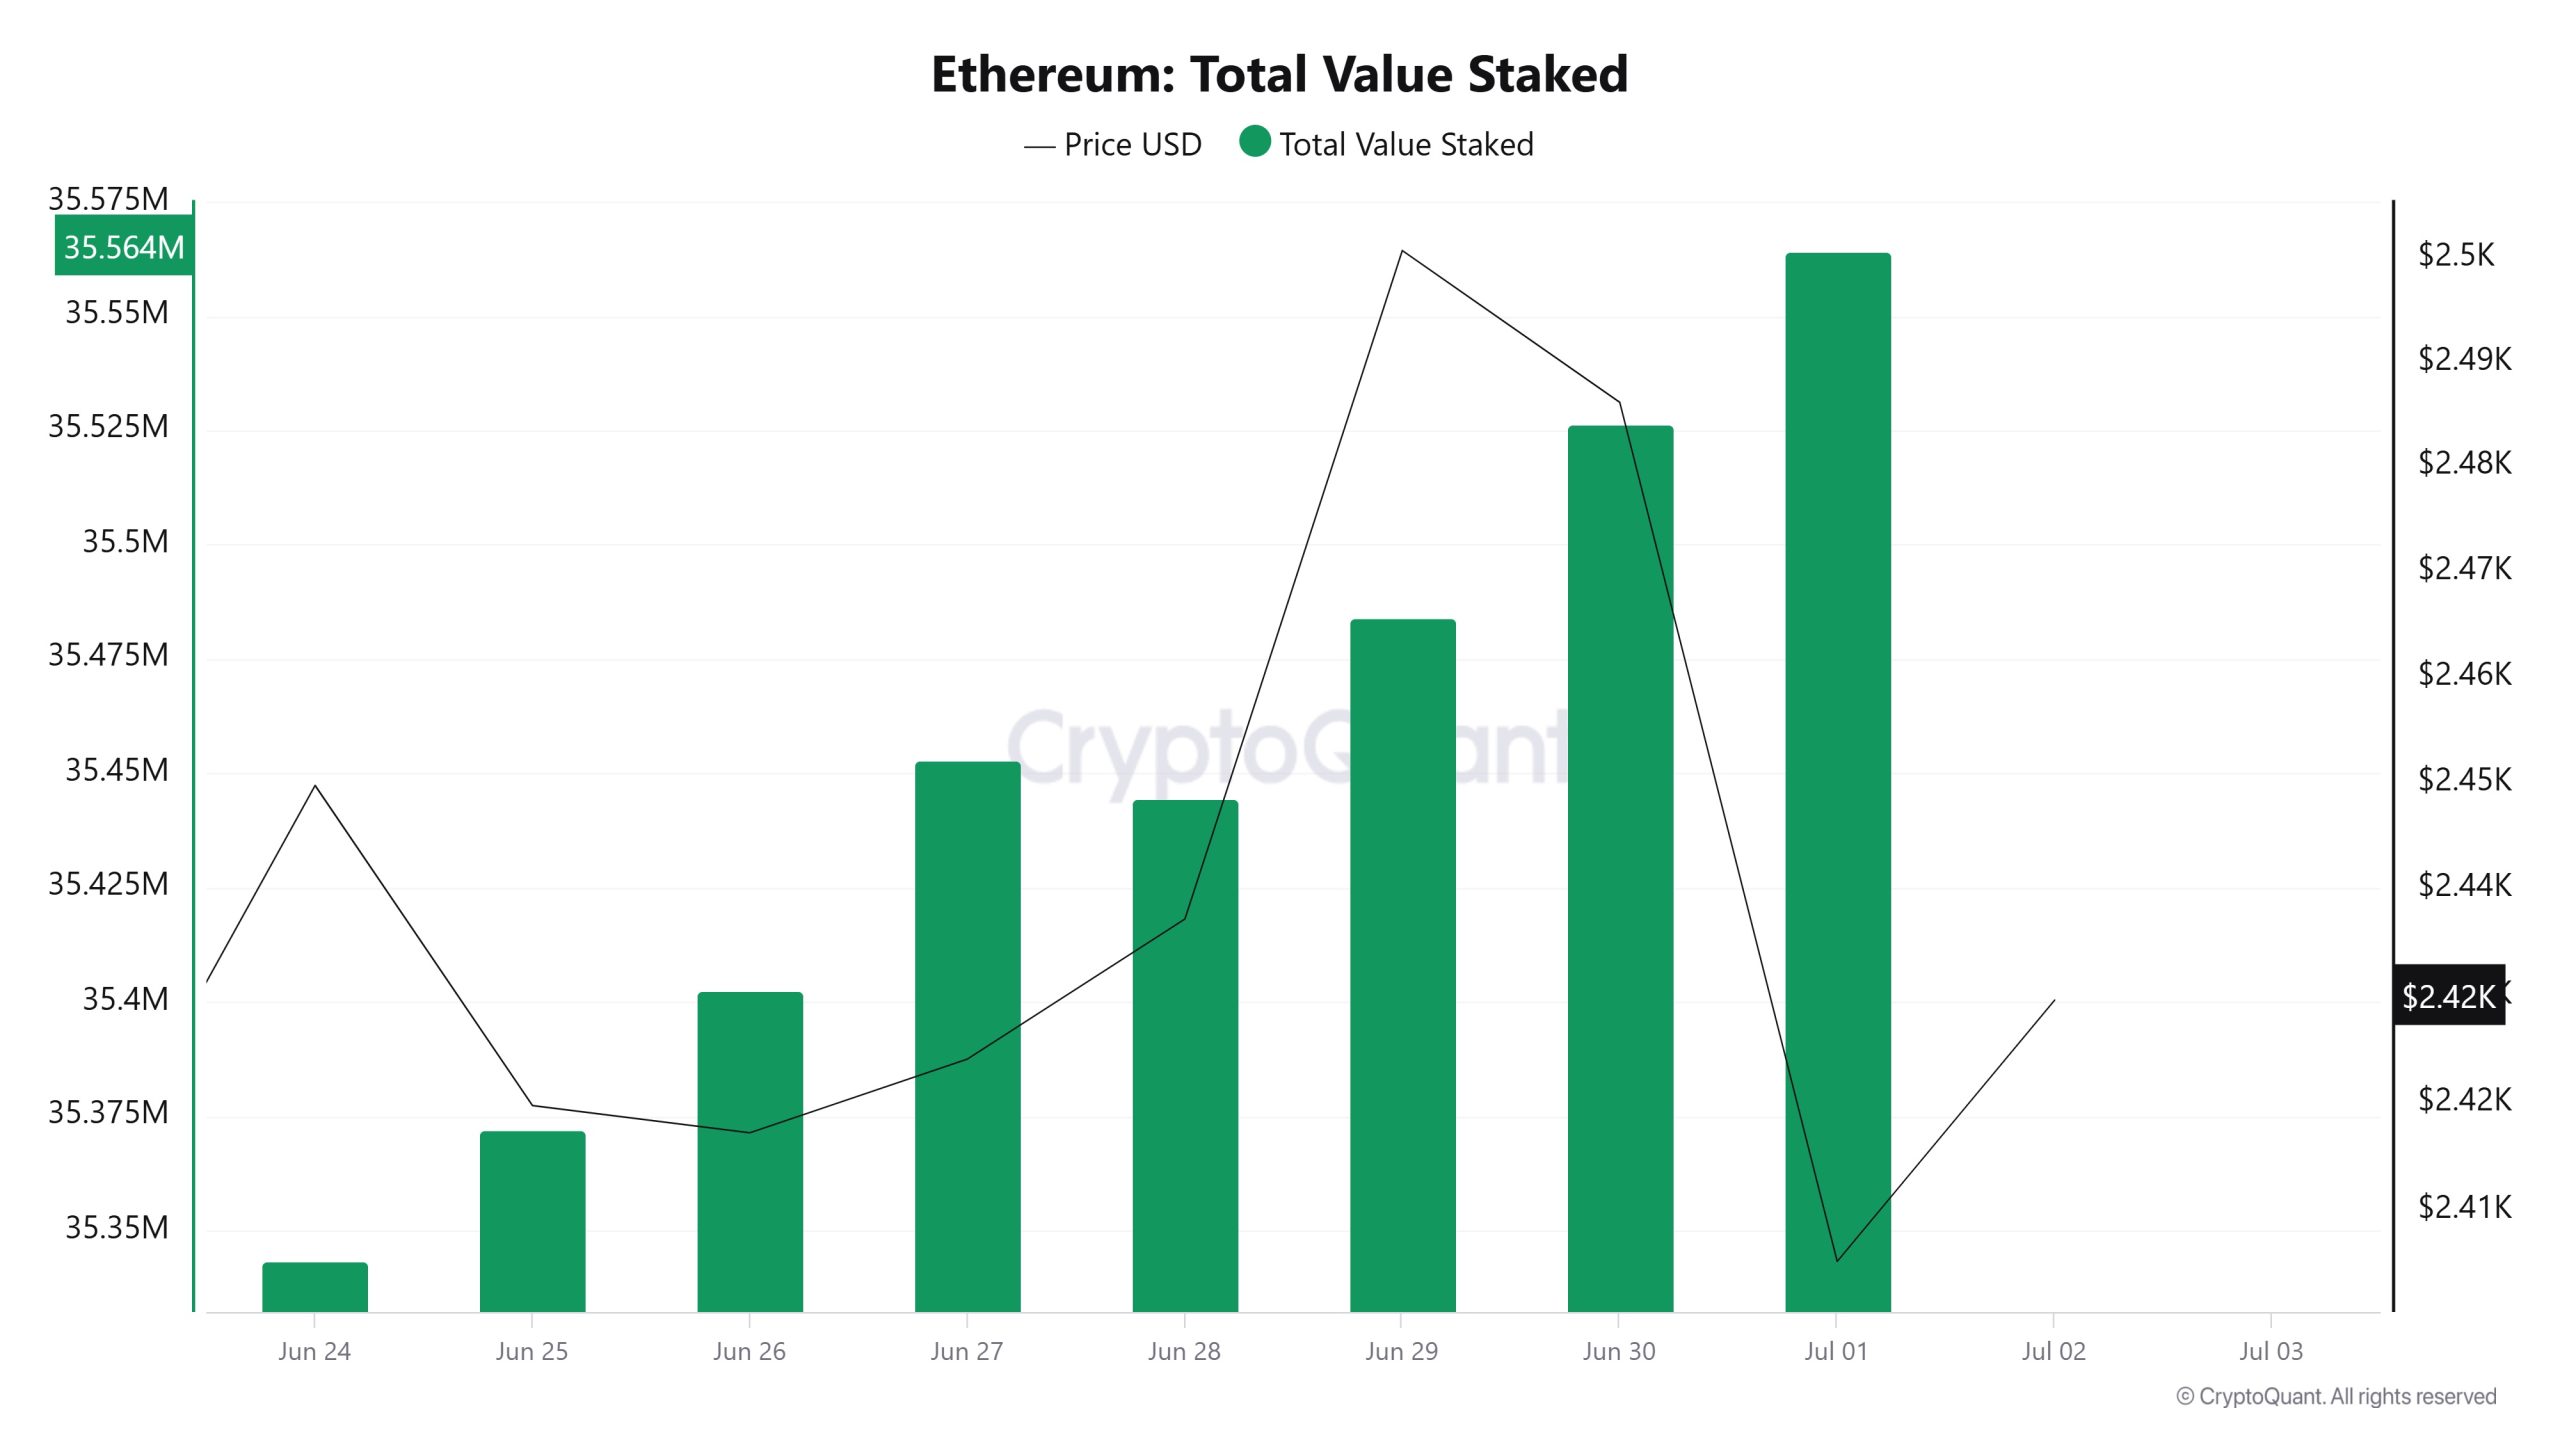
On Giugno 25th, ETH price was 2,419 while Total Value Staked was 35,372,117. As of Luglio 1, ETH price fell 0.58% to 2,405, while Total Value Staked increased 0.54% to 35,564,352.
Afflussi di palificazione
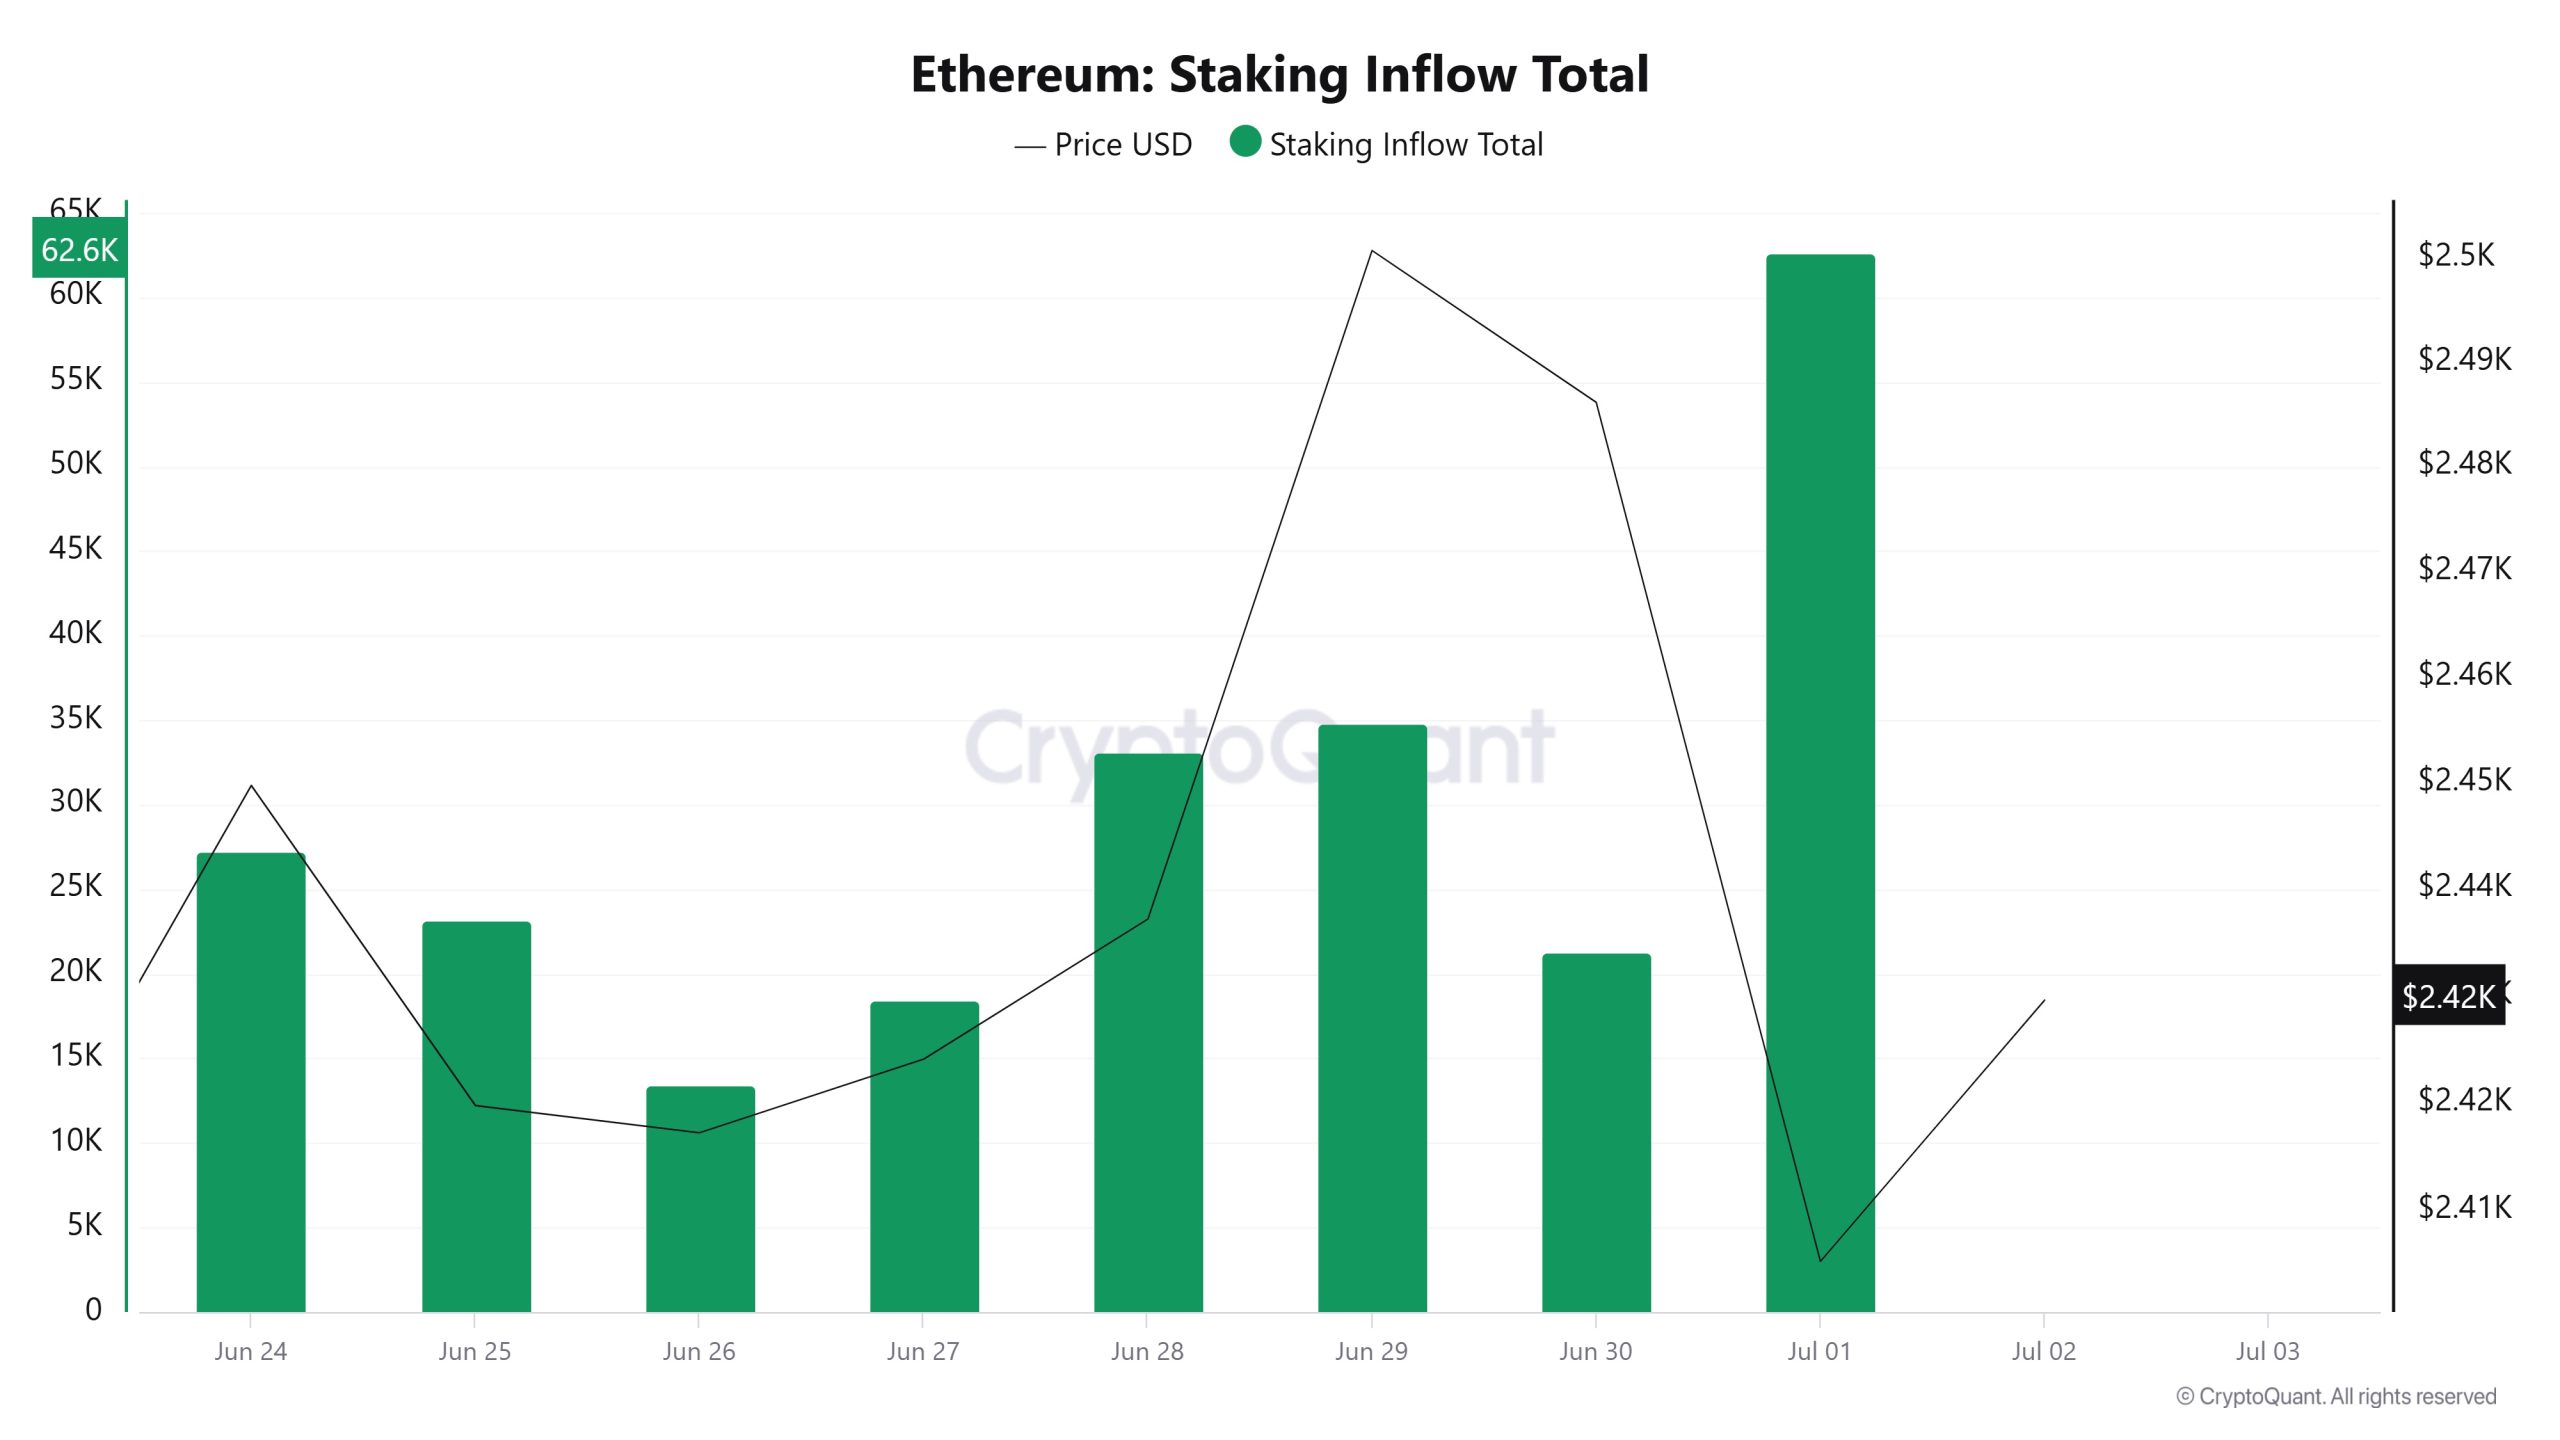
On Giugno 25, ETH price was at 2,419, while Staking Inflow was at 23,135. As of Luglio 1, ETH price fell 0.58% to 2,405, while Staking Inflow rose 170.77% to 62,631.
Derivati
Interesse aperto
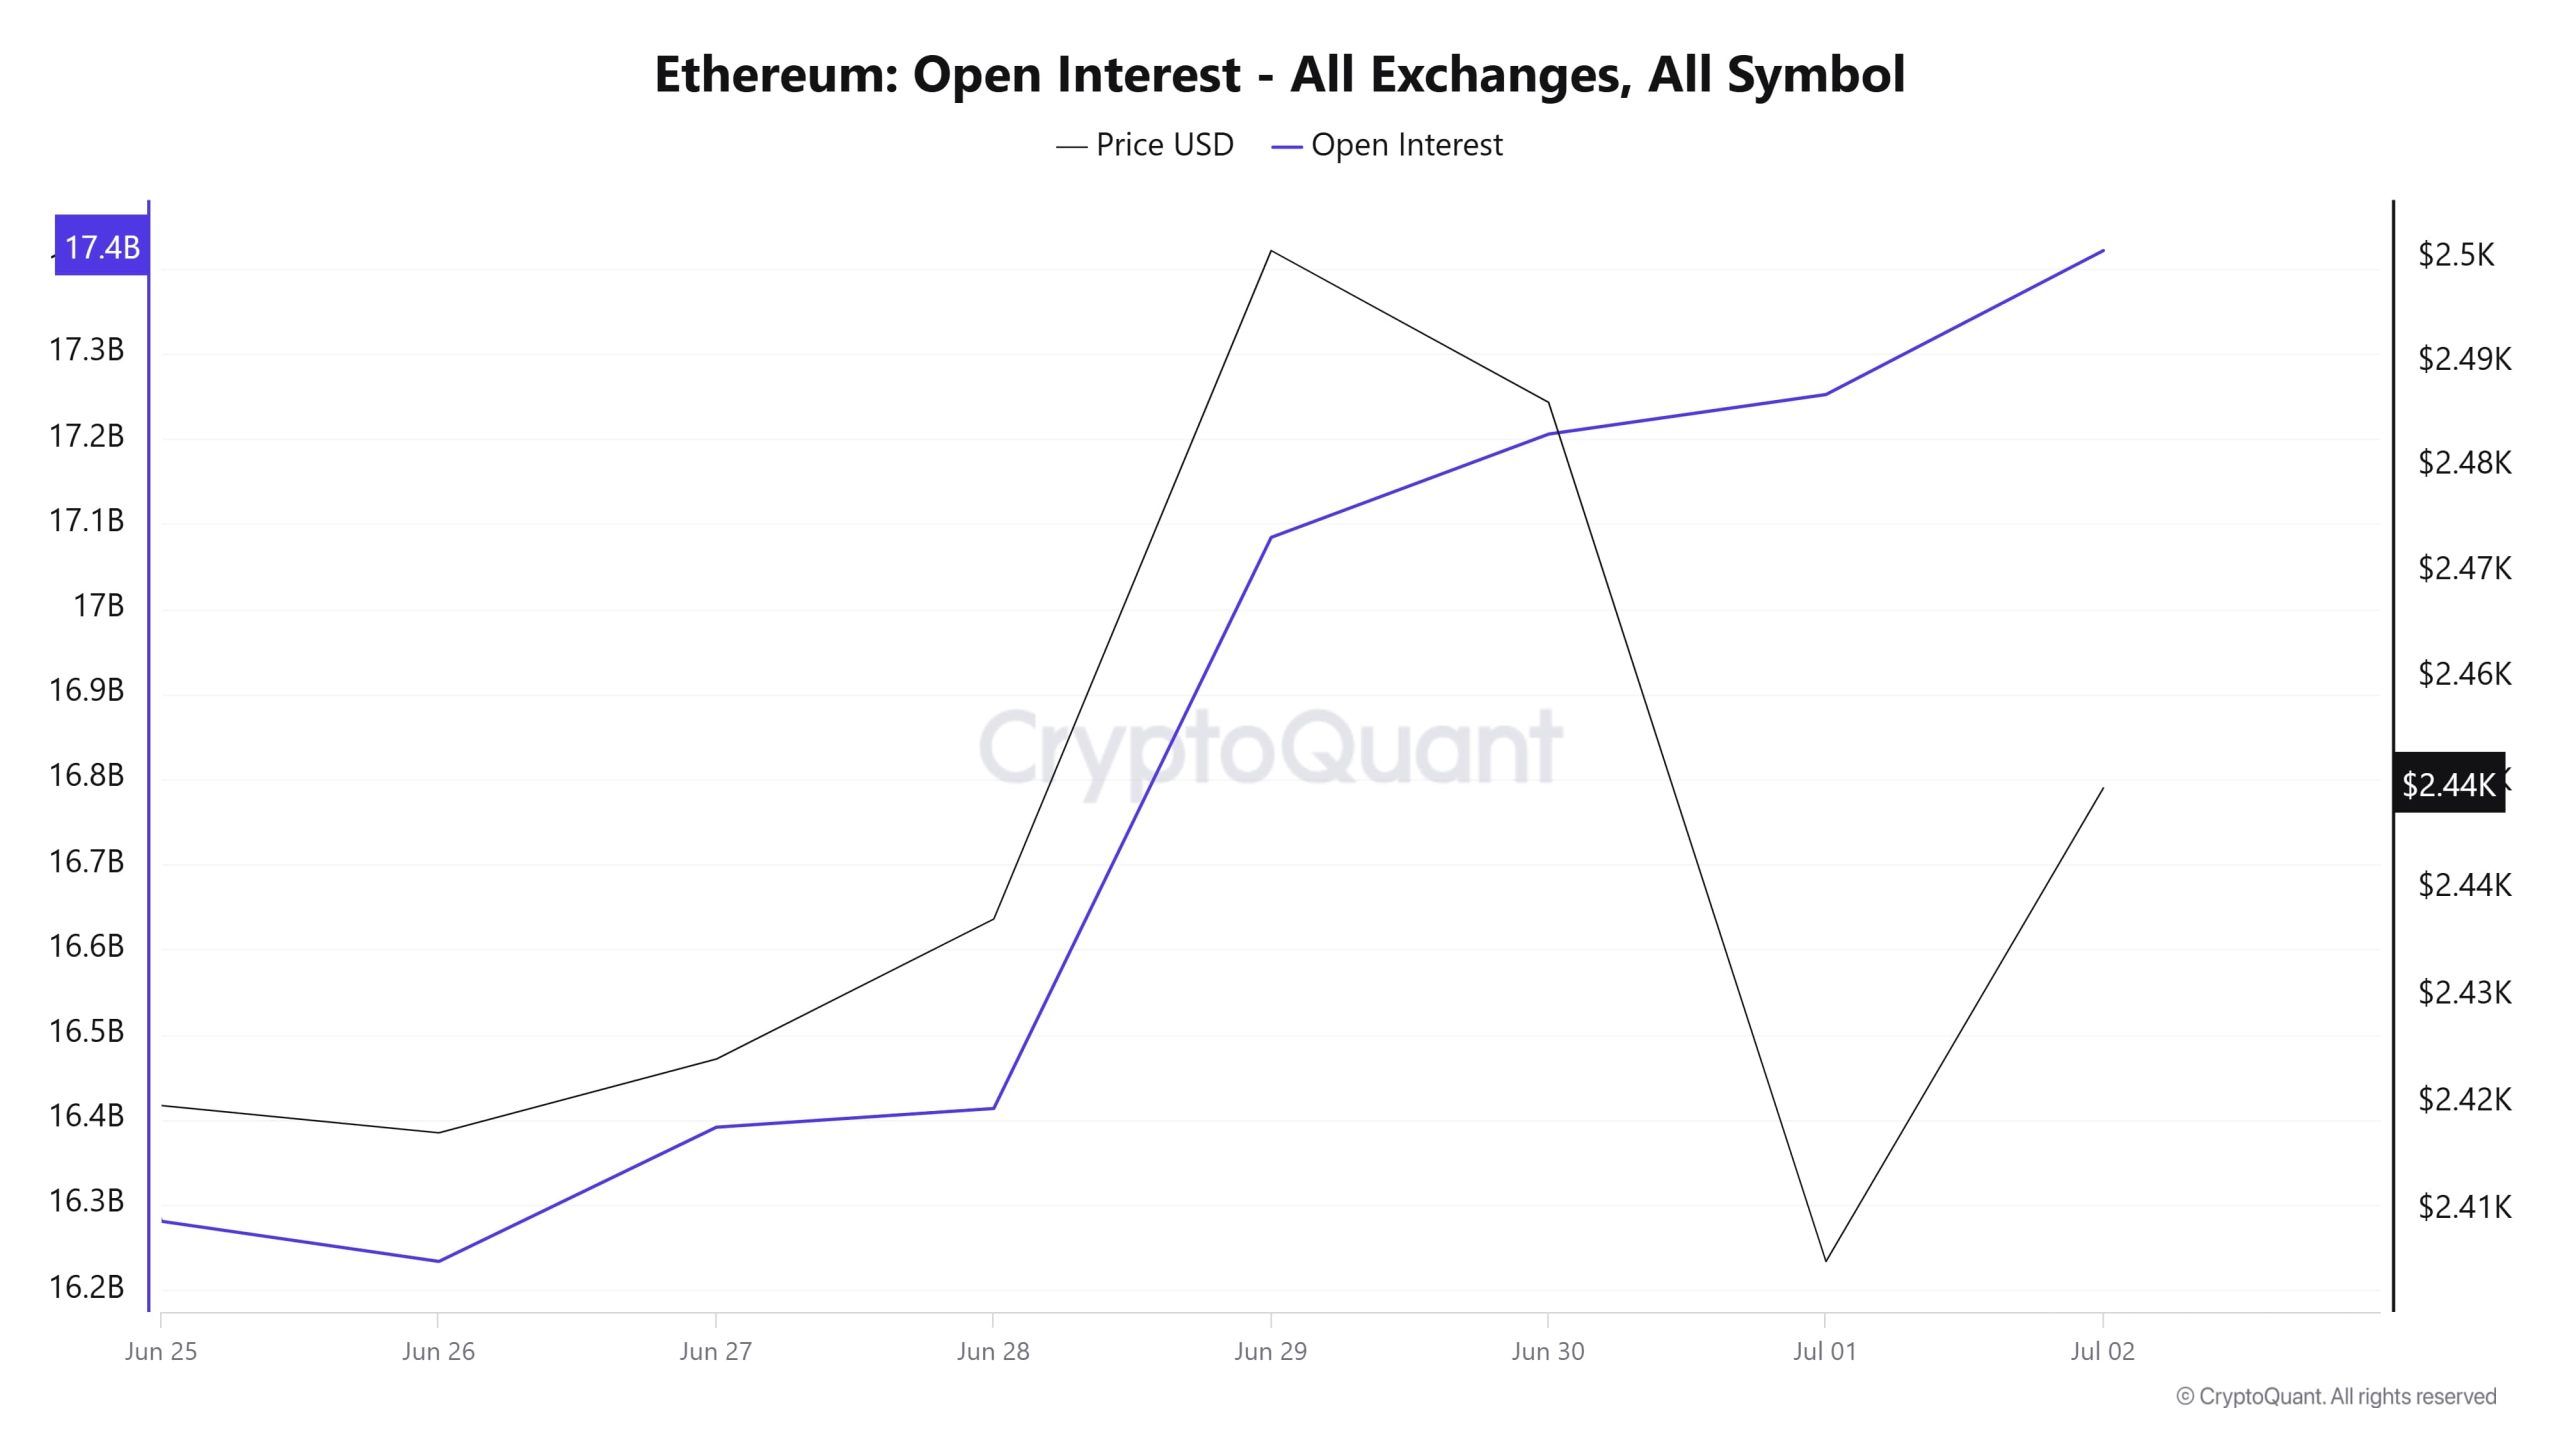
Between Giugno 25-26, both prices and open positions are quite stable. As of Giugno 27, the picture starts to change. Open interest gains upward momentum and rises sharply to $17.1 billion on Giugno 29. During the same period, the ETH price also made a sharp upward move, testing the $2,490 level. This simultaneous surge suggests that the market was heavily long, with investors buying the rise. However, as of Giugno 30, this bullish momentum was broken on the price side. On Luglio 1, the ETH price fell sharply to as low as 2,410, while on the open interest side, this time there was a sideways-positive trend instead of a strong unwind. The fact that open interest did not fall despite the sharp drop in the price may indicate that positions are mostly still being held. In other words, investors have not yet completely exited the market, but there may be some who see the decline as an opportunity.
On Luglio 2, as the price started to recover, there is an upward continuity in open interest. This suggests that investor confidence has started to rebuild and new entries are coming to the market. In particular, the fact that open interest continues to increase steadily reveals that the bullish expectation in the market continues. Overall, the chart shows that the recent direction of the Ethereum market is up, but the price may not support this uptrend at all times. The market is still strongly positioned, but these positions may become a source of pressure in the event of a sudden pullback on the price side.
Tasso di finanziamento
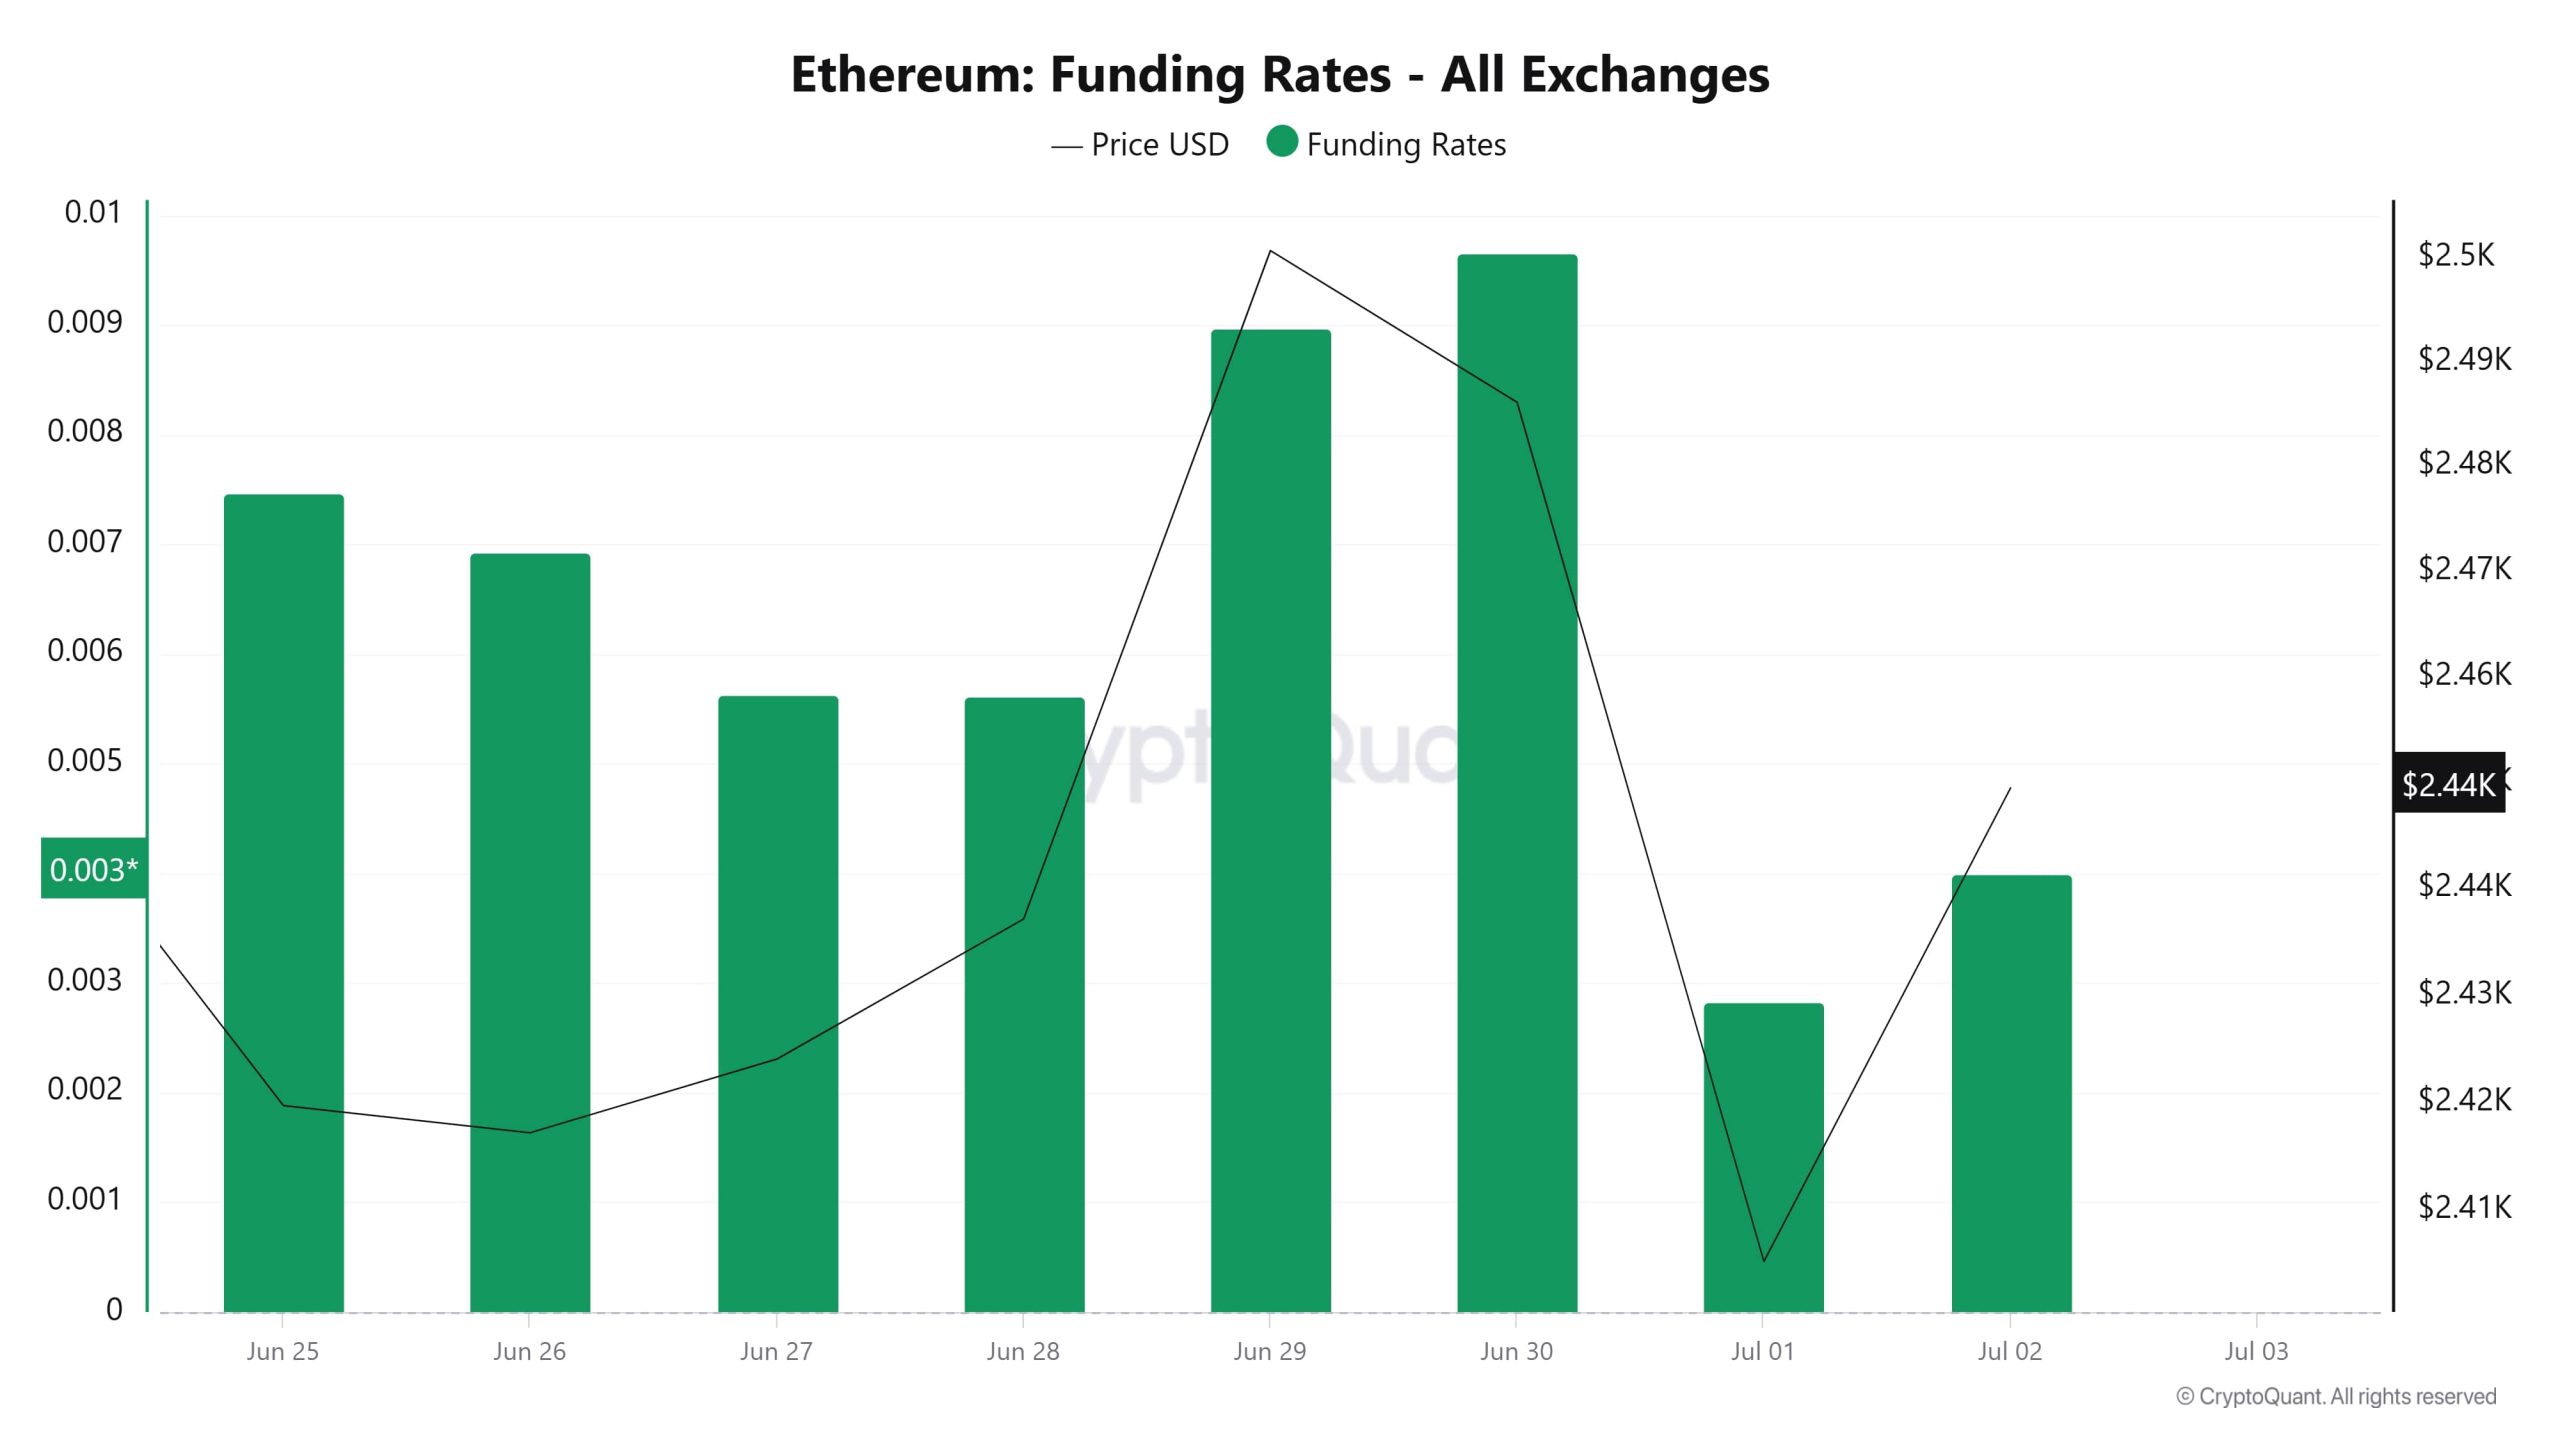
Ethereum funding rate data from Giugno 25 to Luglio 2 indicates a period of dominant long positions in the market. Especially between Giugno 28-30, the funding rate rose as high as 0.009% and the price reached $2,490, indicating strong bullish expectations. However, after this excessive long positioning, both the price and the funding rate fell sharply as of Luglio 1. This suggests that leveraged long positions were partially liquidated. On Luglio 2, with the recovery, the funding rate increased again and the price returned to the $2,450 level. The overall structure shows that despite the short-term correction in the market, the appetite for buying still persists.
Liquidazioni lunghe e brevi
With the ETH price moving in the band between $ 2,525 – $ 2,390, $ 271 million long and $ 194 million short transactions were liquidated this week.
| La storia | Importo lungo (milioni di dollari) | Importo breve (milioni di dollari) |
|---|---|---|
| Giugno 25th | 44.73 | 32.99 |
| Giugno 26th | 45.47 | 44.69 |
| Giugno 27th | 66.50 | 16.12 |
| Giugno 28 | 1.94 | 5.26 |
| Giugno 29th | 8.70 | 58.34 |
| Giugno 30th | 50.08 | 30.84 |
| Luglio 01 | 53.85 | 6.59 |
| Totale | 271.27 | 194.83 |
Distribuzione delle forniture
Total Supply: 120,895,175 units, up about 0.01688% from last week.
New Supply: The amount of ETH produced this week was 20,385.
Velocity: Velocity was 8.44 as of Giugno 30, up from 8.42 last week.
| Categoria Portafoglio | 23.06.2025 | 30.06.2025 | Variazione (%) |
|---|---|---|---|
| 100 - 1k ETH | 9.0967M | 8.9651M | -1.45% |
| 1k - 10k ETH | 13.5439M | 13.119M | -3.14% |
| 10k - 100k ETH | 16.8646M | 16.1615M | -4.17% |
| 100k+ ETH | 4.1547M | 3.8351M | -7.69% |
According to the latest weekly data, a limited decrease of -1.45% was observed in 100 – 1k ETH wallets. Wallets in the 1k – 10k ETH range experienced a similarly gradual decrease of -3.14%. The 10k – 100k ETH segment showed a slight decline of -4.17%, while 100k+ ETH wallets recorded a notable drop of -7.69%.
Riserva di scambio
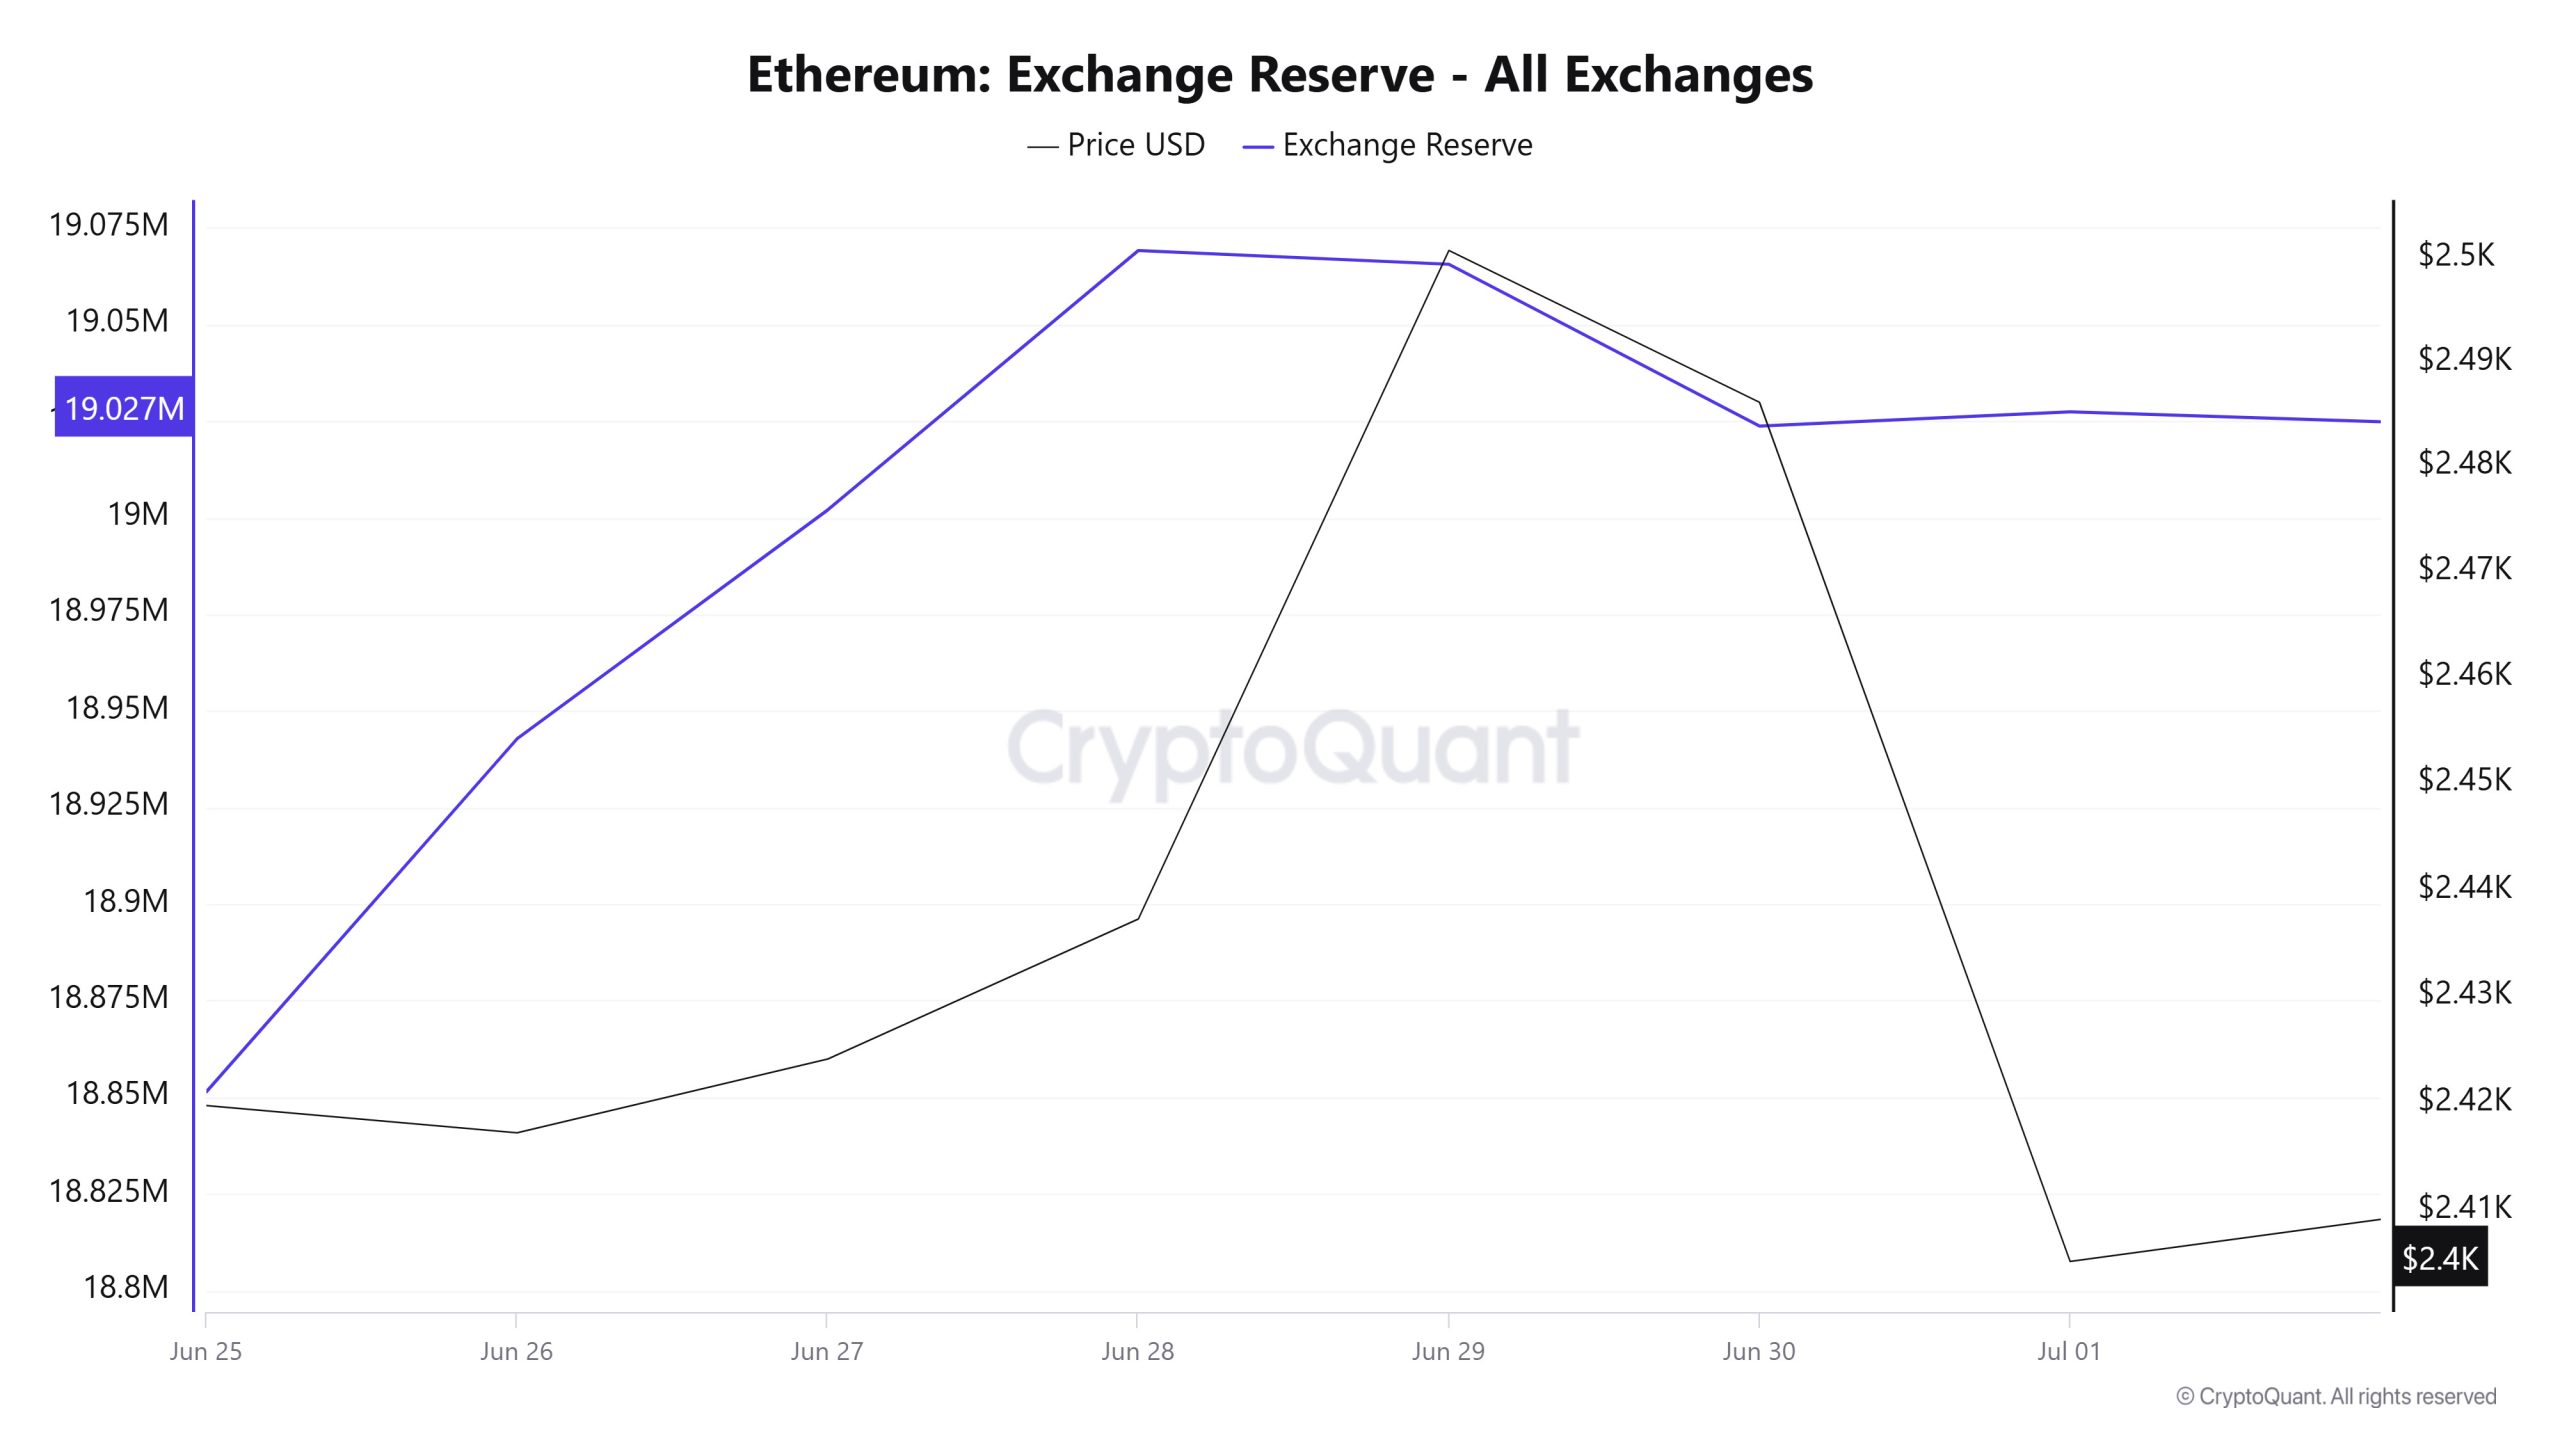
Between Giugno 25 and Luglio 1, 2025, Ethereum reserves on exchanges increased from 18,851,416 ETH to 19,027,379 ETH. During this period, there was a total net inflow of 175,963 ETH and an increase of approximately 0.93% in exchange reserves. The Ethereum price, on the other hand, fell from $2,420 to $2,405 during the same period, a depreciation of about 0.62%. While the inflows to the stock markets indicate that investors may be preparing for potential sales, the limited loss at the weekly close indicates that this trend has not yet turned into a strong selling pressure. Maintaining the balance between buyers and sellers reveals that the market continues to search for short-term direction and the general expectation remains neutral.
| Data | 25-Jun | 26-Jun | 27-Jun | 28-Jun | 29-Jun | 30-Jun | 1-Jul |
| Afflusso di scambio | 760,690 | 925,460 | 632,754 | 332,161 | 294,208 | 693,161 | 763,991 |
| Flusso di scambio | 716,778 | 834,151 | 573,509 | 265,020 | 297,752 | 735,045 | 760,296 |
| Scambio Netflow | 43,912 | 91,309 | 59,245 | 67,142 | -3,544 | -41,884 | 3,695 |
| Riserva di scambio | 18,851,416 | 18,942,725 | 19,001,970 | 19,069,112 | 19,065,568 | 19,023,684 | 19,027,379 |
| Prezzo ETH | 2,420 | 2,417 | 2,424 | 2,437 | 2,501 | 2,486 | 2,405 |
Tasse e ricavi
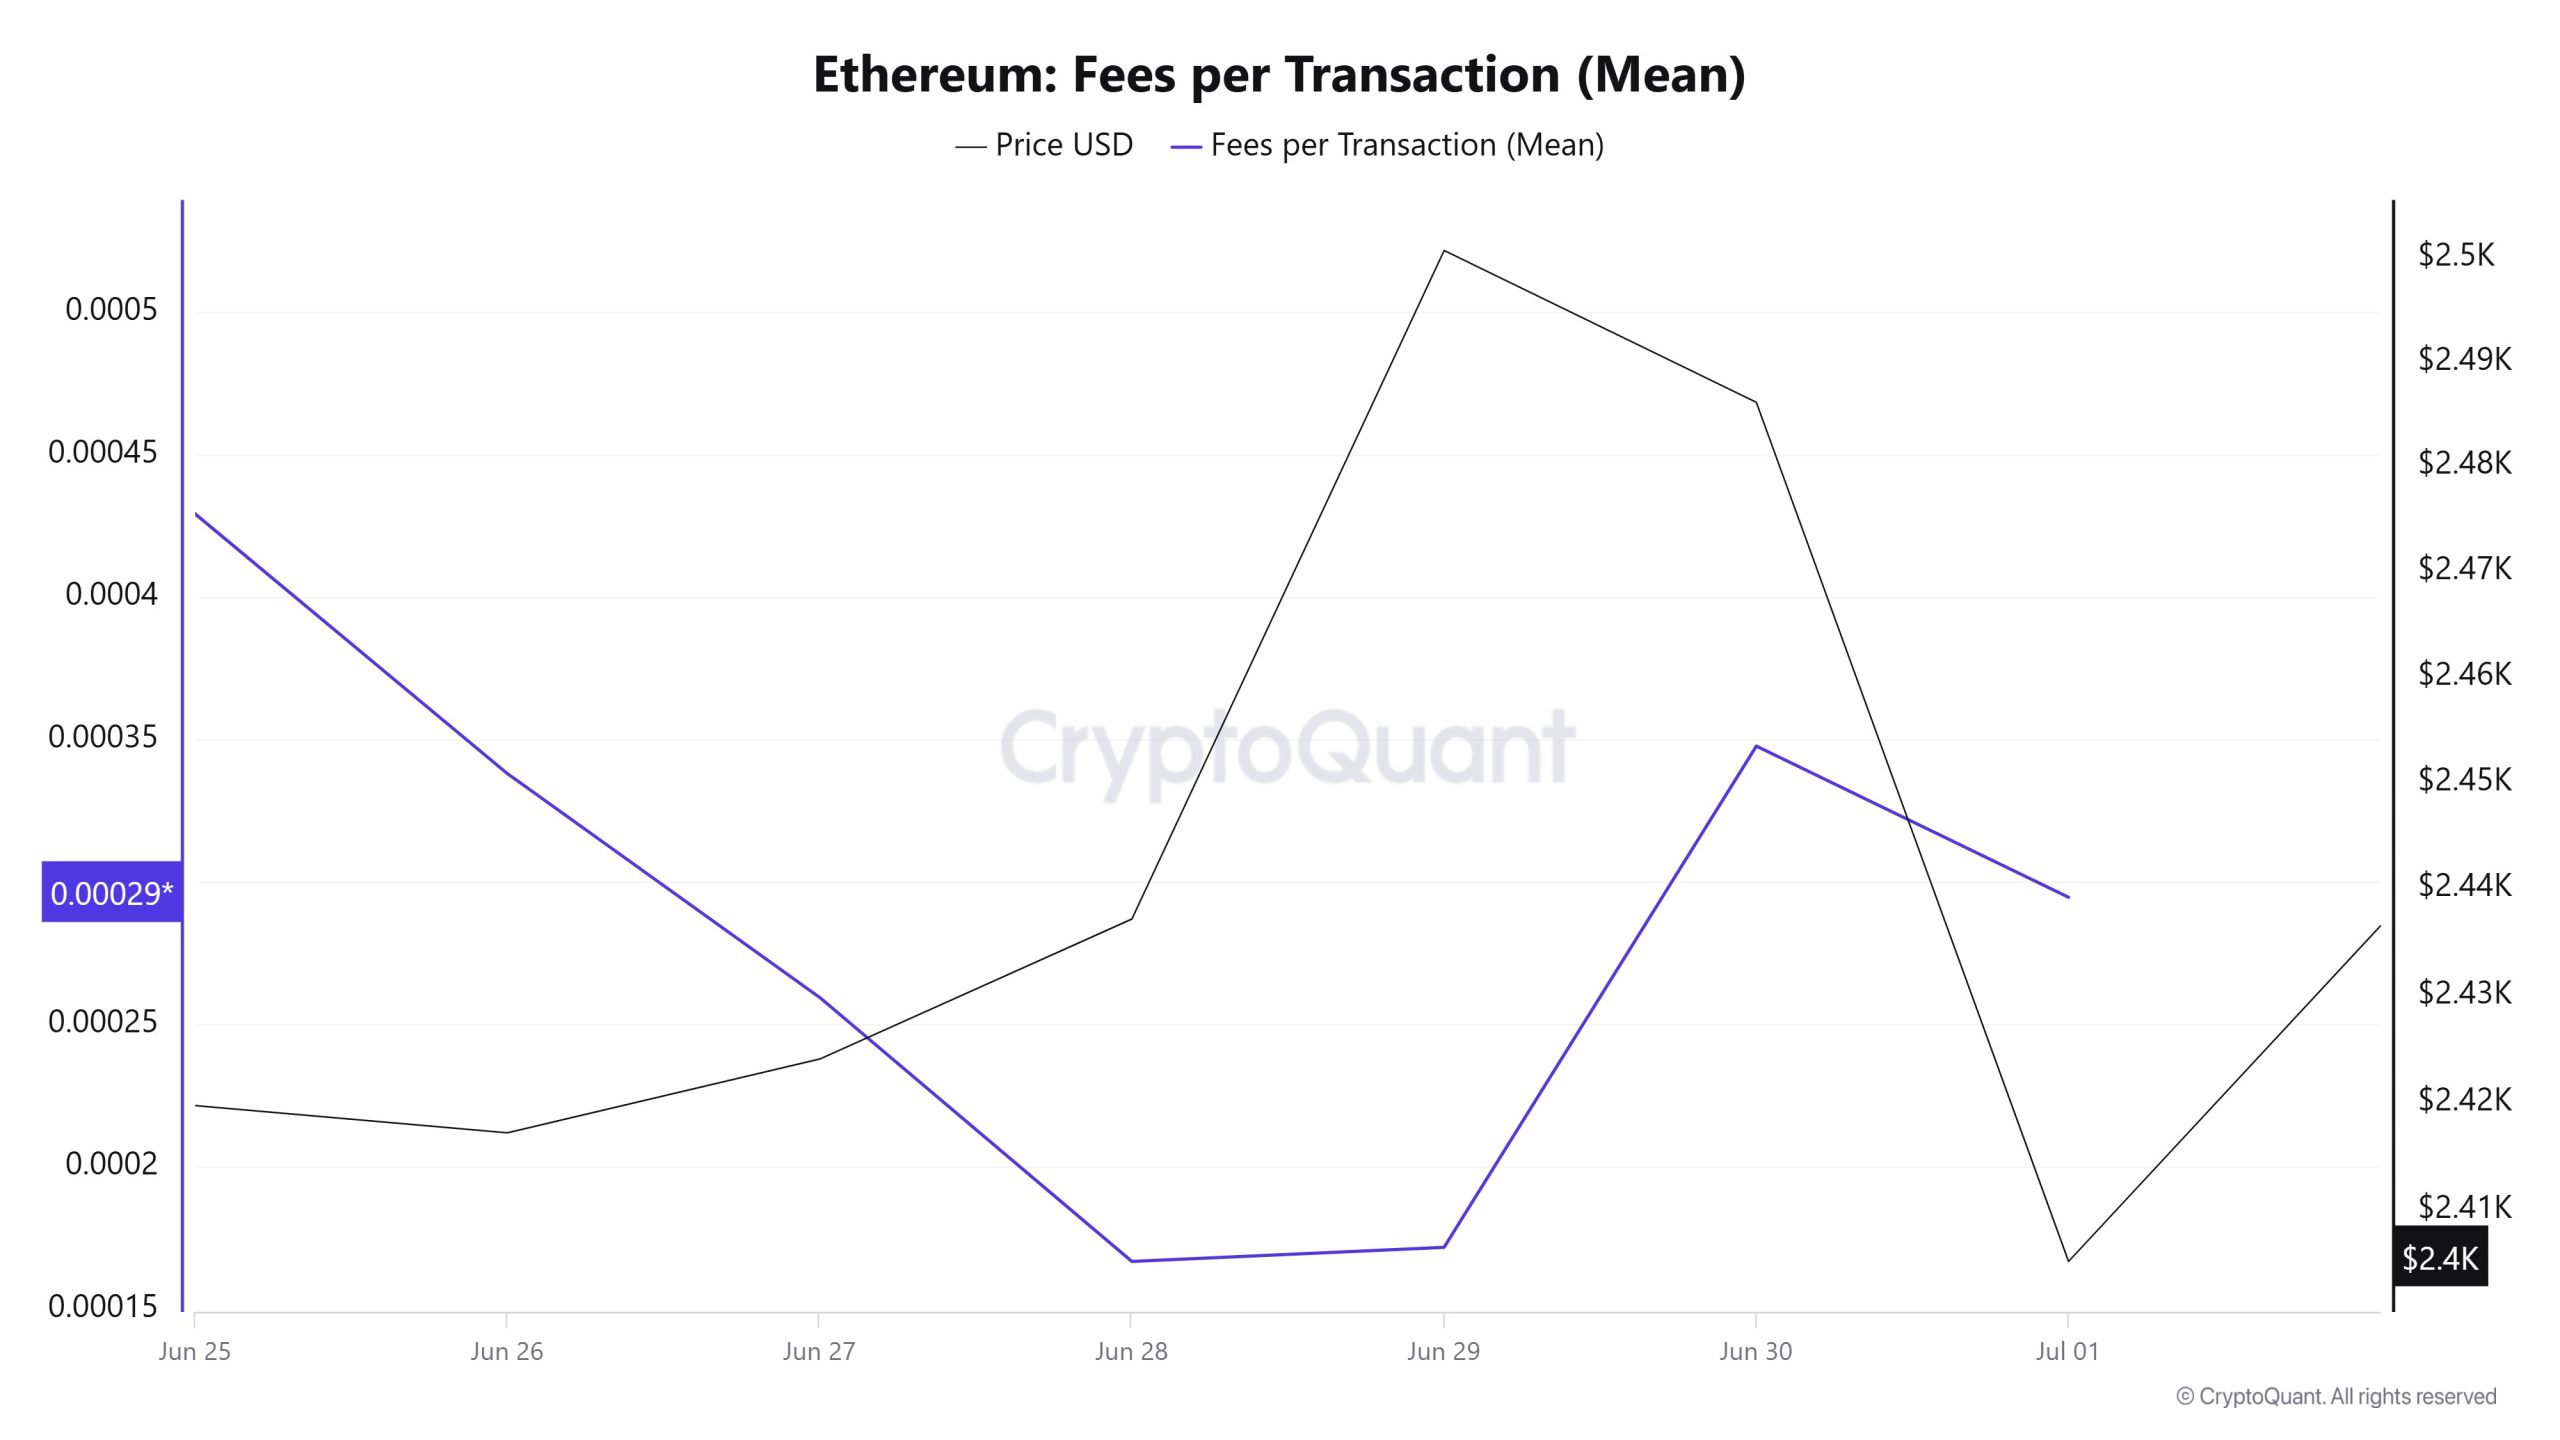
Between Giugno 25 and Luglio 1, Ethereum Fees per Transaction (Mean) data shows that this value was 0.00042925252614949 on Giugno 25, the first day of the week.
Following this, a downward trend was observed in the indicator, which fell to 0.000166918488311929 as of Giugno 28, recording the lowest value of the week.
After that, Ethereum Fees per Transaction (Mean) resumed its upward trend and closed at 0.000294737946879646 on Luglio 1, the last day of the week.
Bitcoin: commissioni (totale)
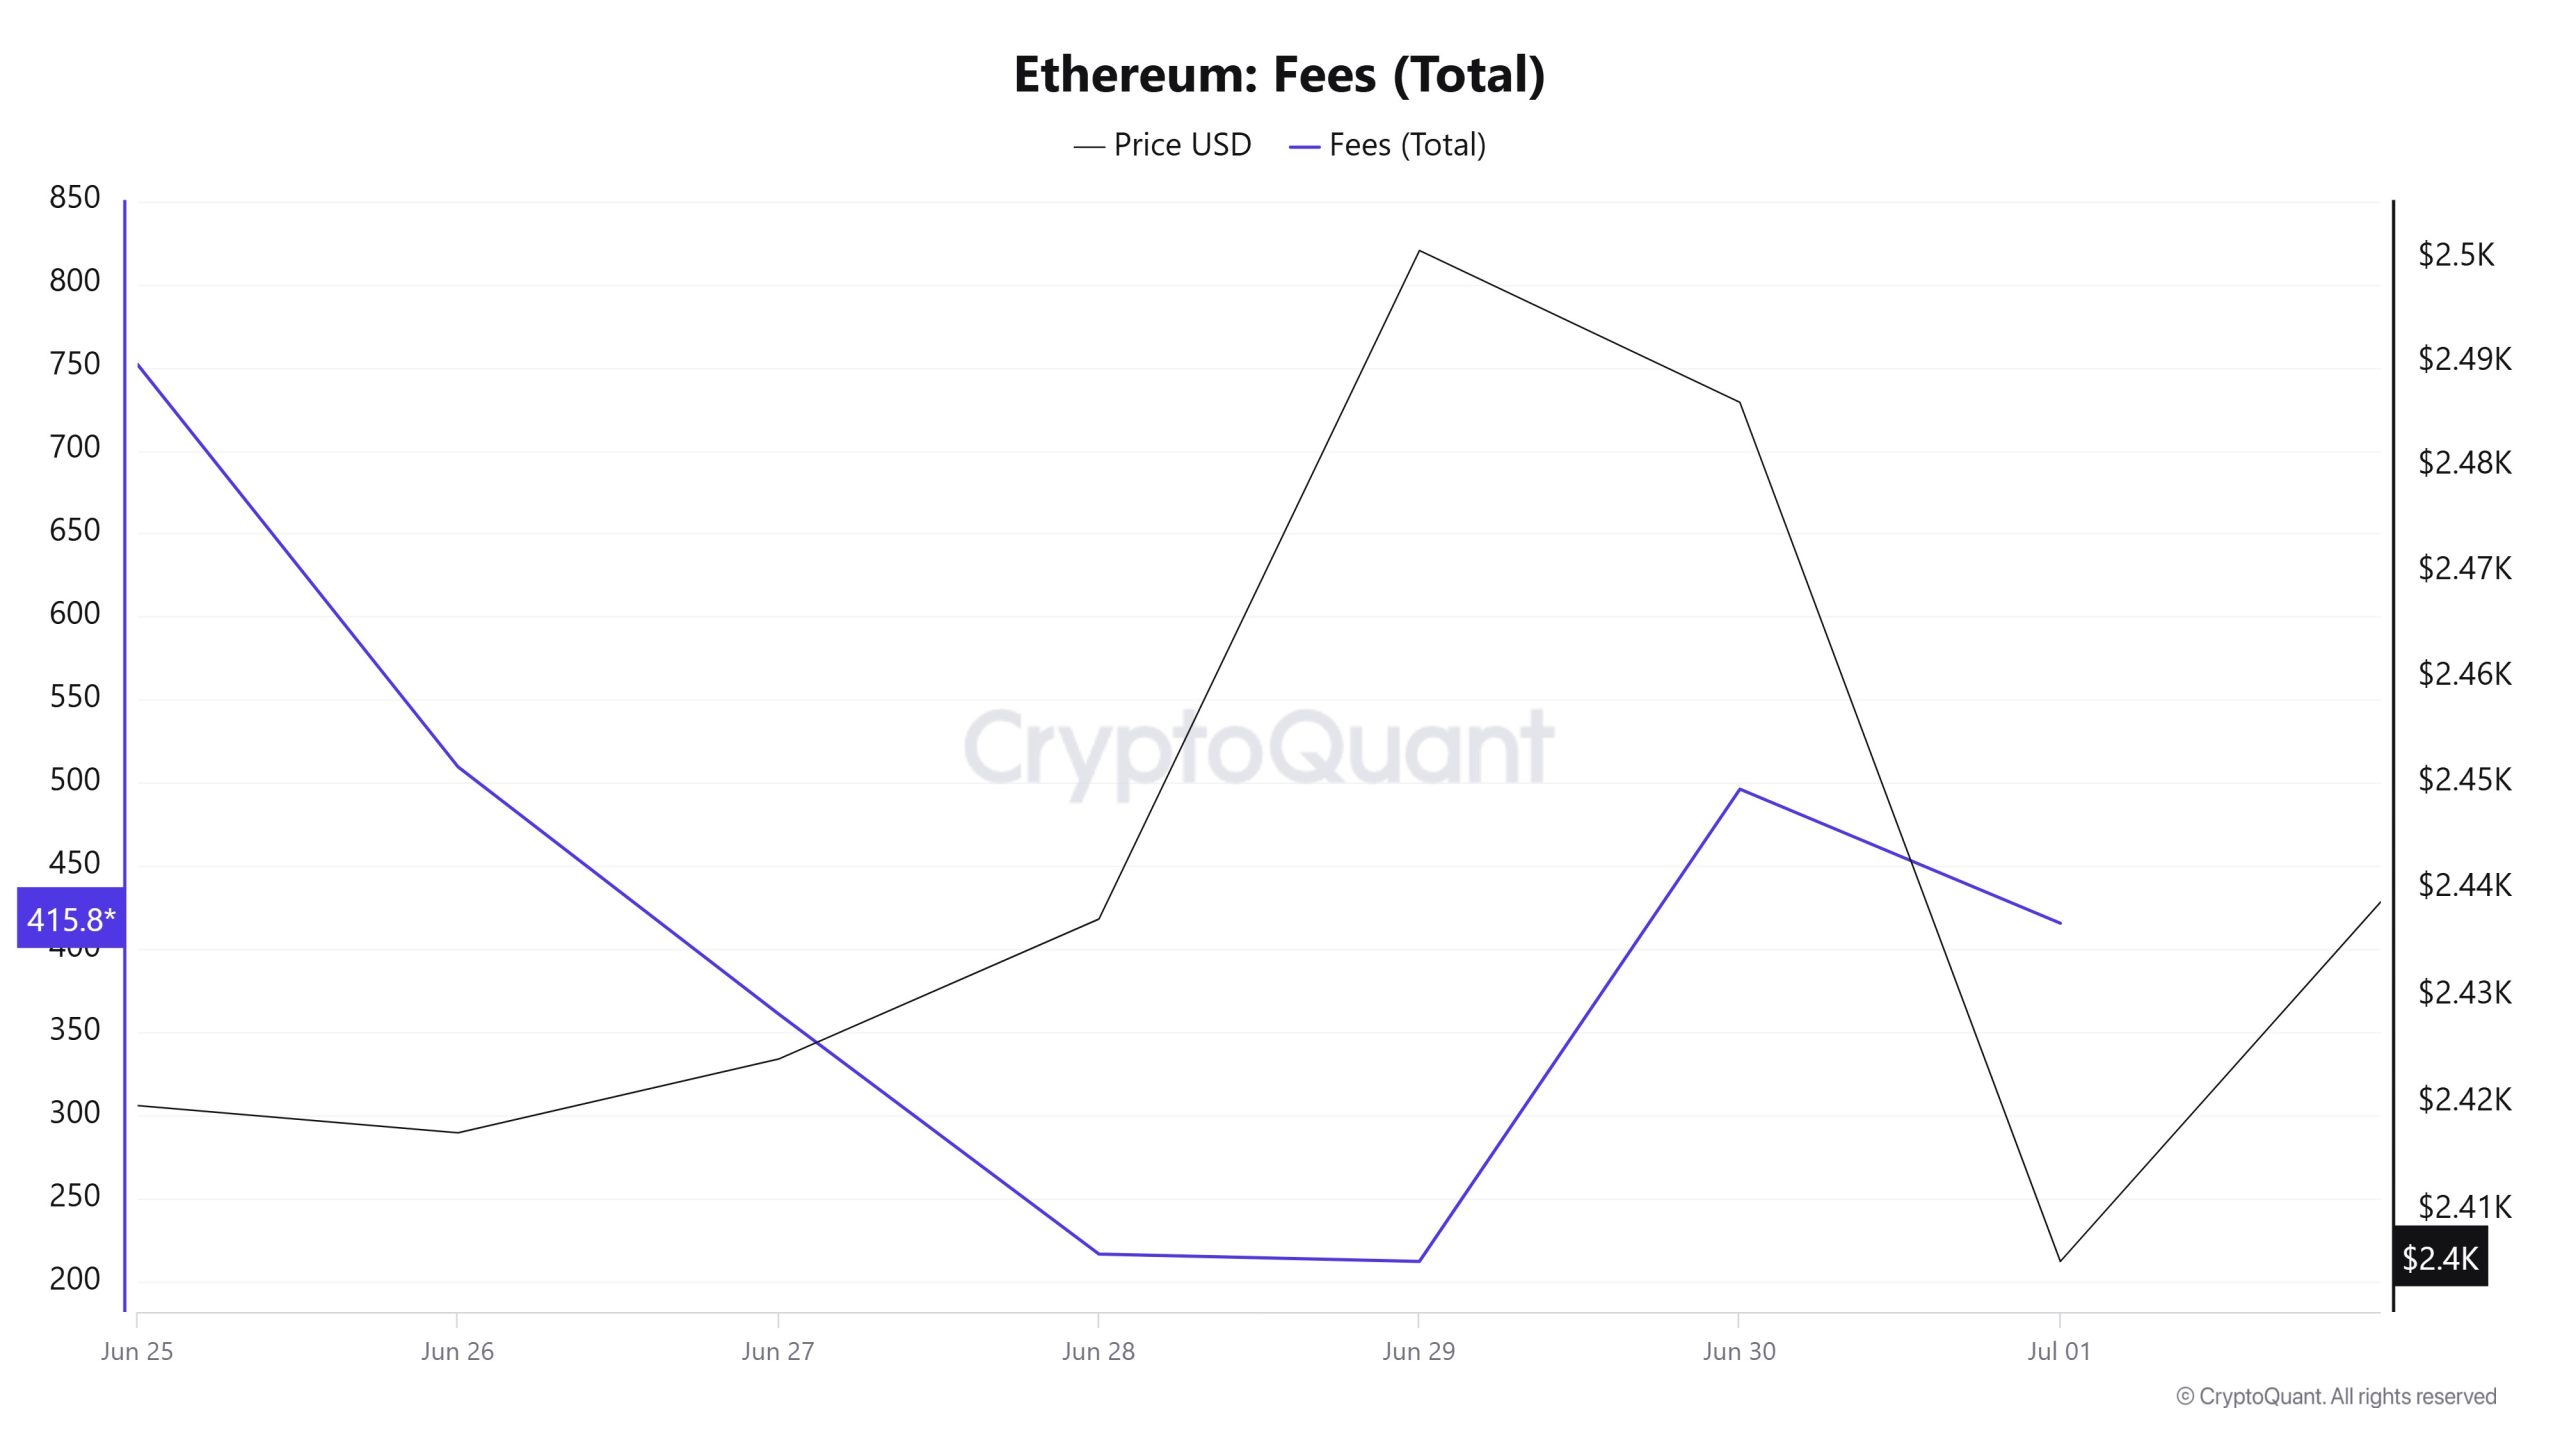
Similarly, when the Ethereum Fees (Total) data between Giugno 25 and Luglio 1 is analyzed, it is seen that this value was 751,5954181361878 on Giugno 25, the first day of the week.
Following this, a downward trend was observed in the indicator, and as of Giugno 29, it fell to 212.55636284606948, recording the lowest value of the week.
After this level, Ethereum Fees (Total) started to rise again and closed at 415,85431665295255 on Luglio 1, the last day of the week.
Blocchi estratti
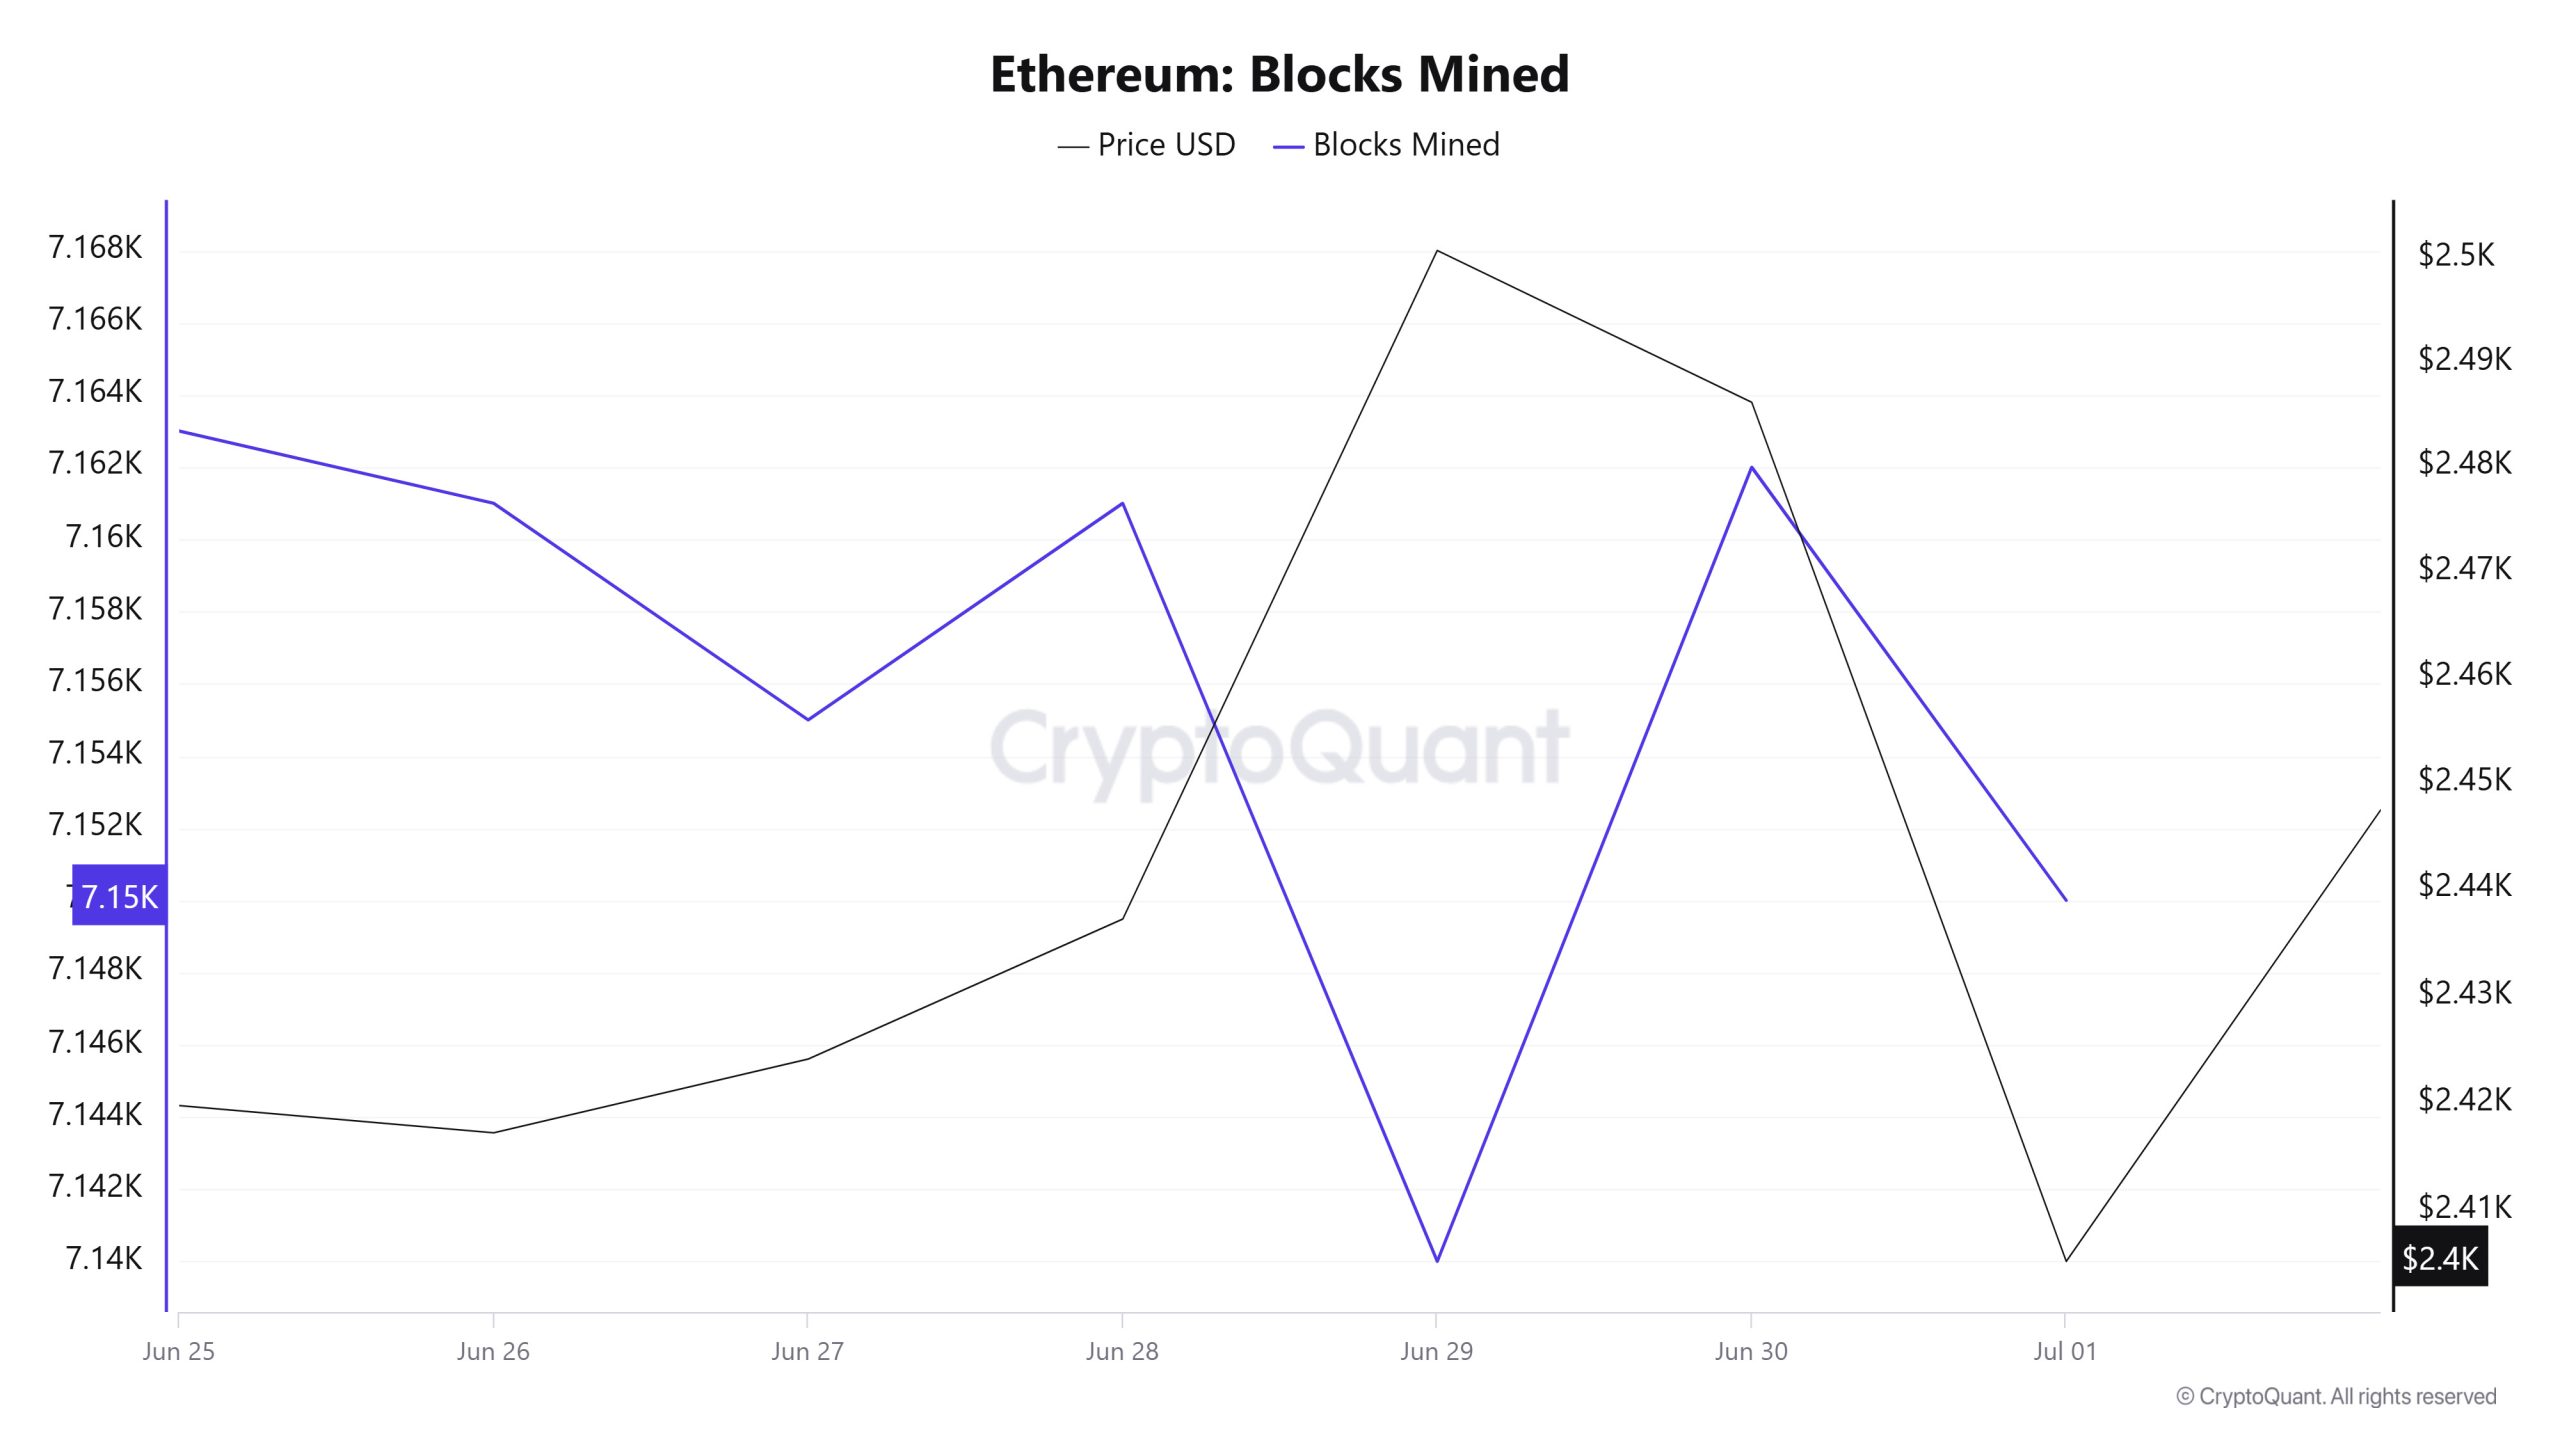
Between Giugno 25 and Luglio 1, Ethereum block production data showed a slight decline throughout the week. While 7,163 blocks were produced on Giugno 25, this number decreased to 7,150 as of Luglio 1.
During the period under review, a positive correlation was observed between the Ethereum price and the number of block production in the first days of the week, while this relationship reversed towards the middle of the week and evolved into a negative correlation; on the last day of the week, the correlation turned positive again.
Dimensione del blocco
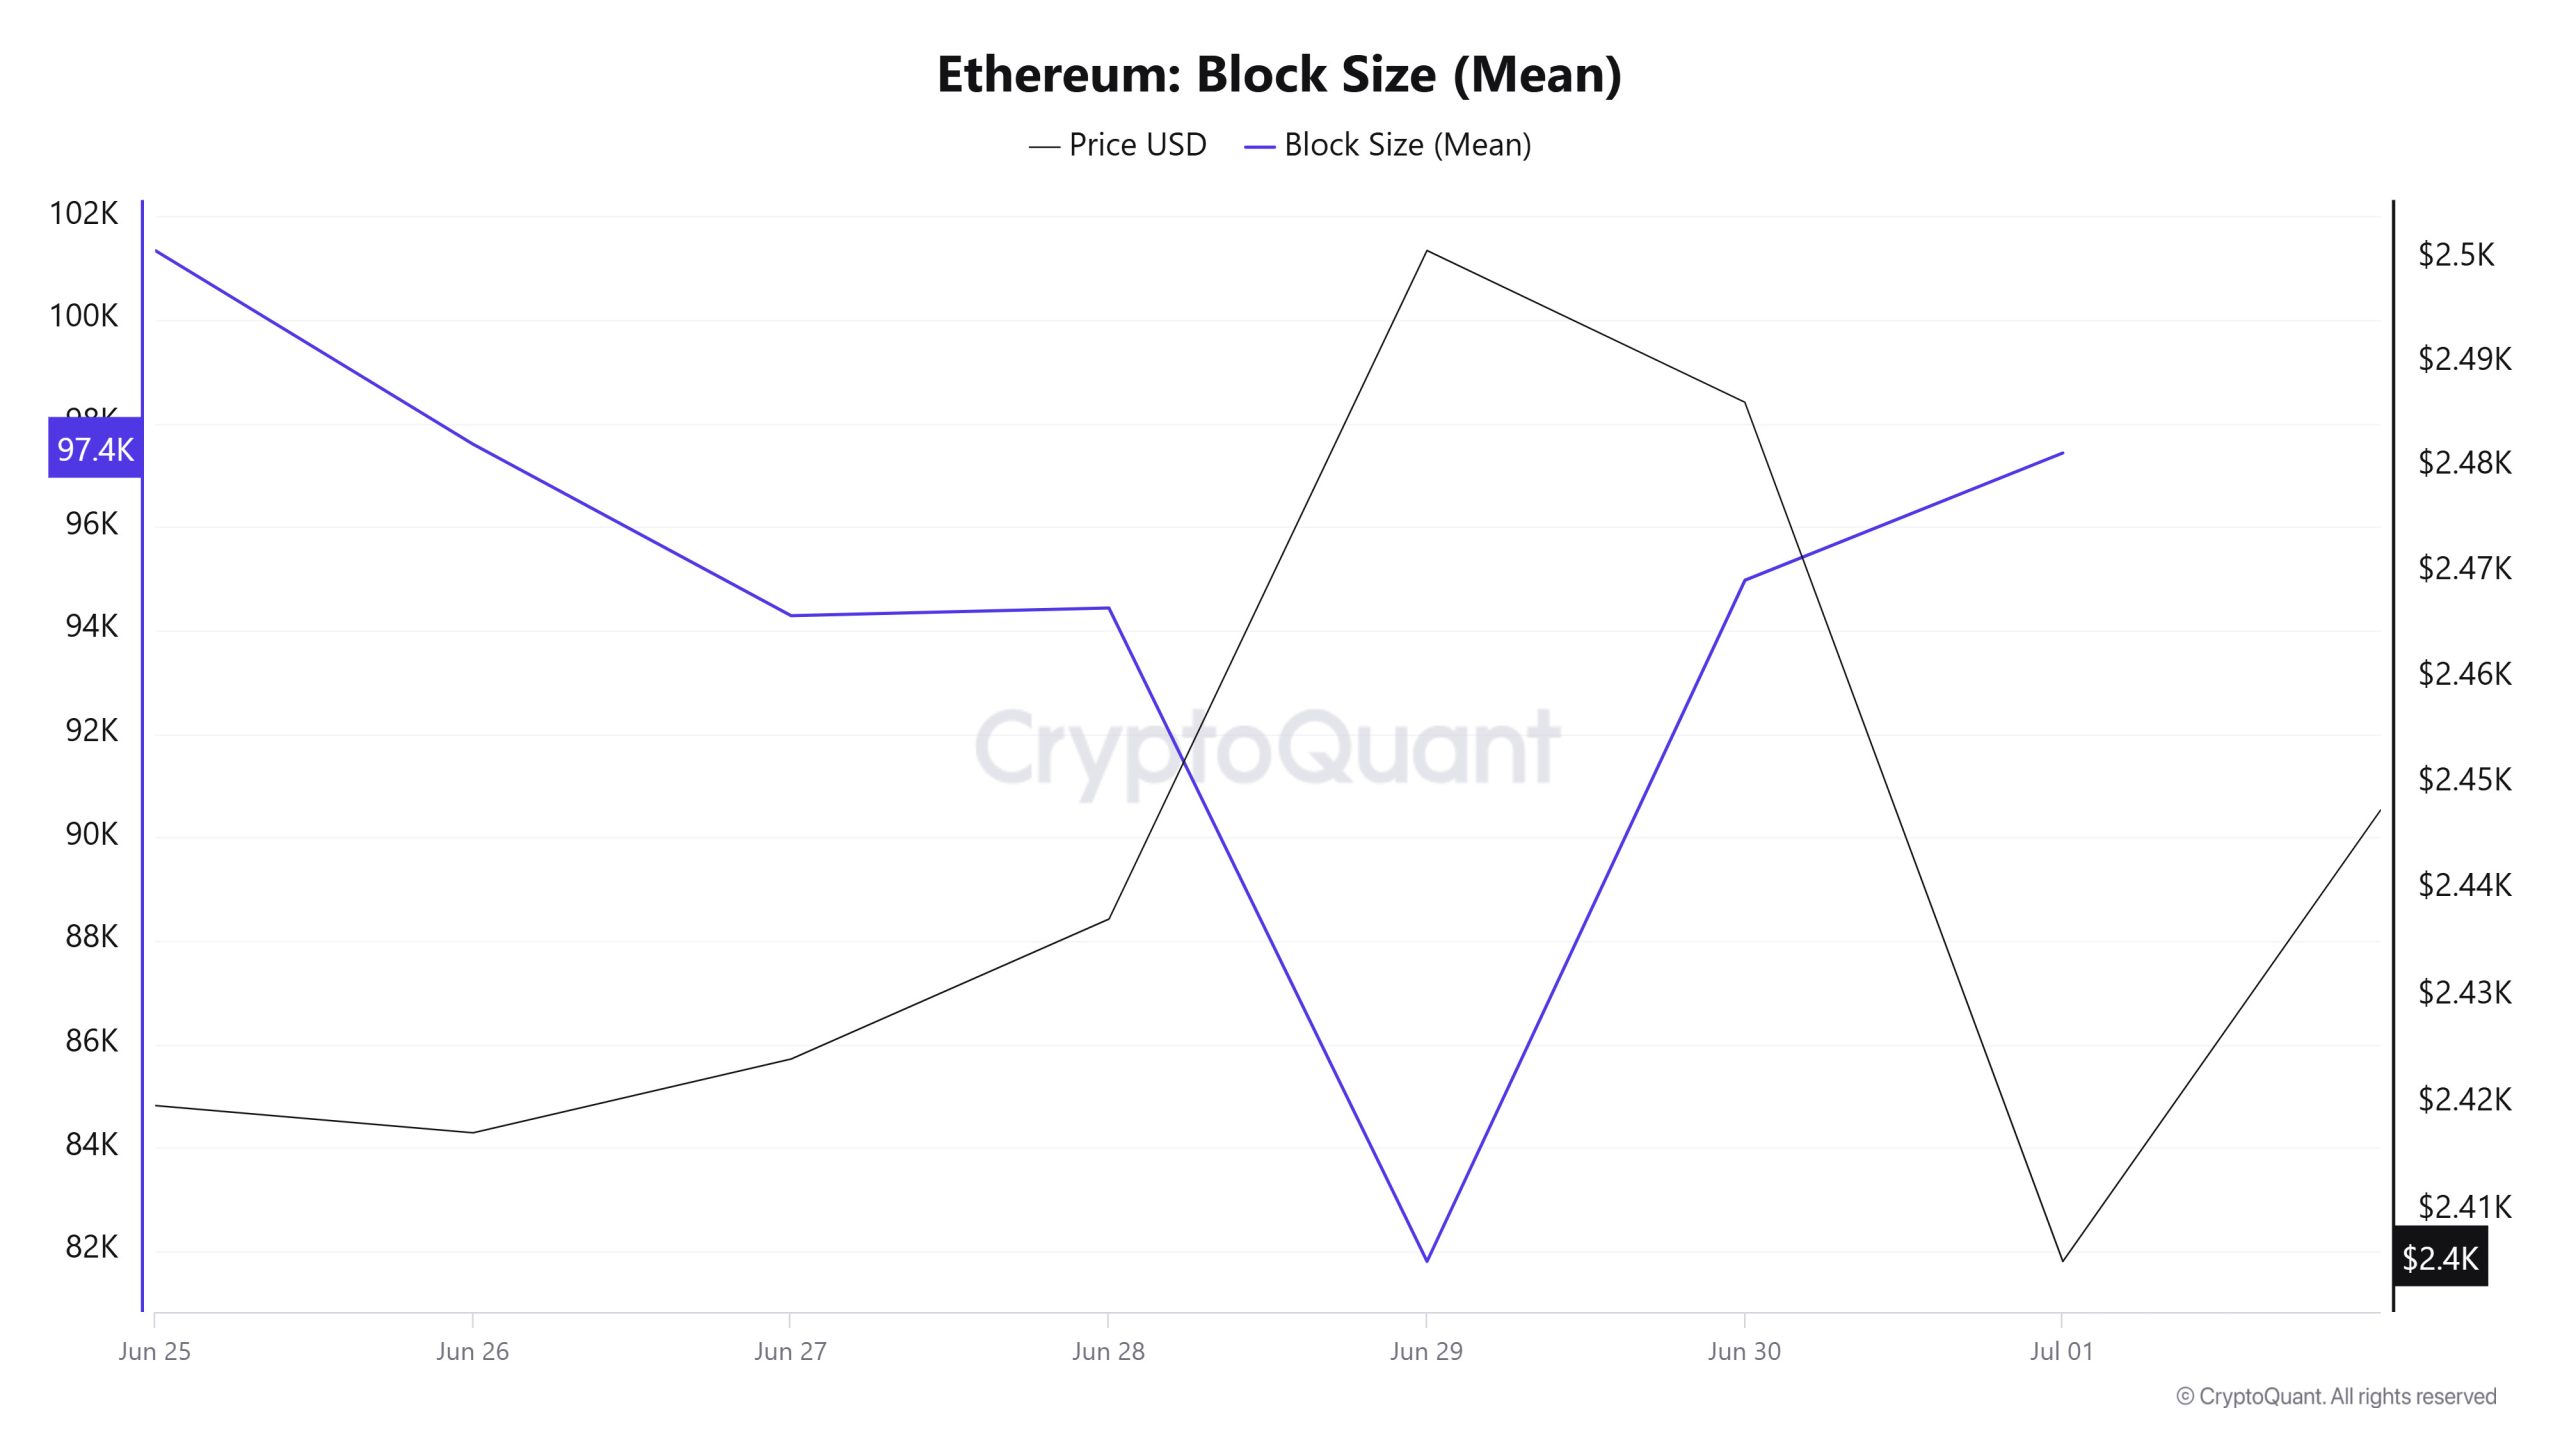
Between Giugno 25 and Luglio 1, Ethereum block size data showed a decline throughout the week. While on Giugno 25, the average block size was 101,339 bytes, this value decreased to 97,427 bytes as of Luglio 1. This decrease indicates that the transaction density or block occupancy rates on the network decreased on a weekly basis.
There was a negative correlation between block size and Ethereum price during the week.
Intervallo di blocco
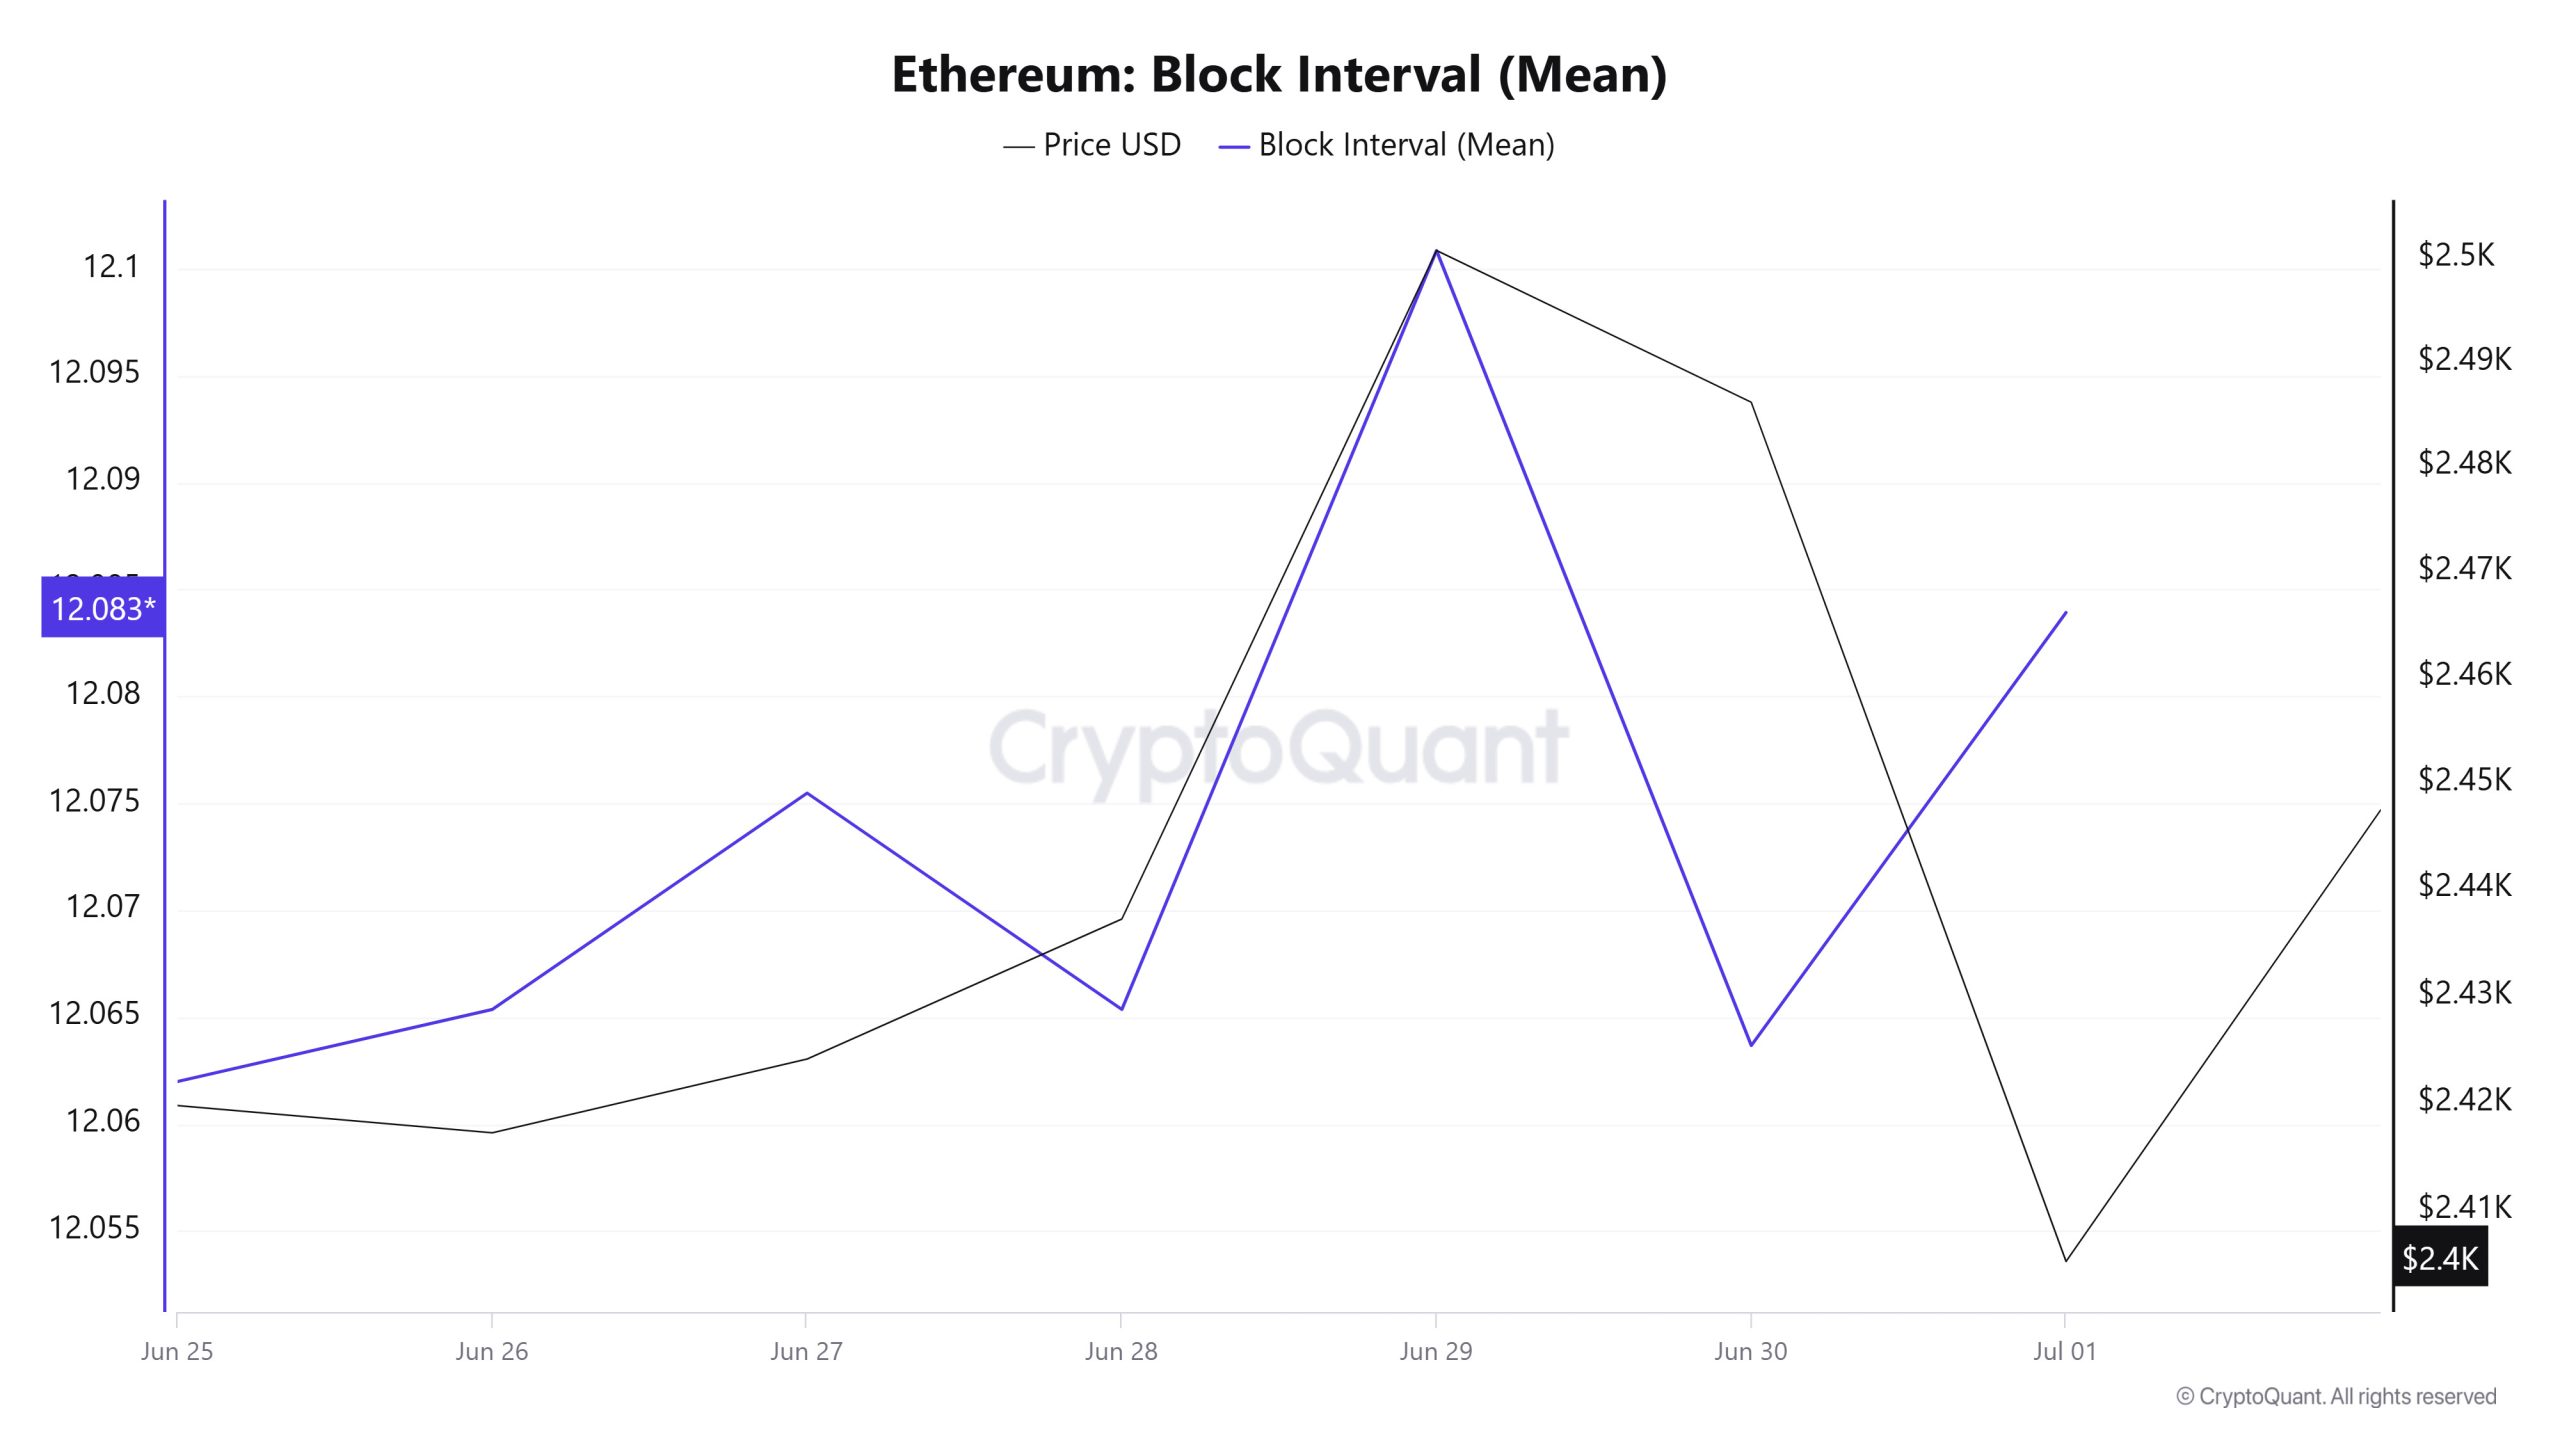
Between Giugno 25 and Luglio 1, Ethereum block data showed a slight increase throughout the week. On Giugno 25, the average block duration was recorded as 12.06 seconds, while it decreased to 12.08 seconds as of Luglio 1.
During the period in question, Ethereum block duration and price movement were positively correlated throughout the week.
Transazione
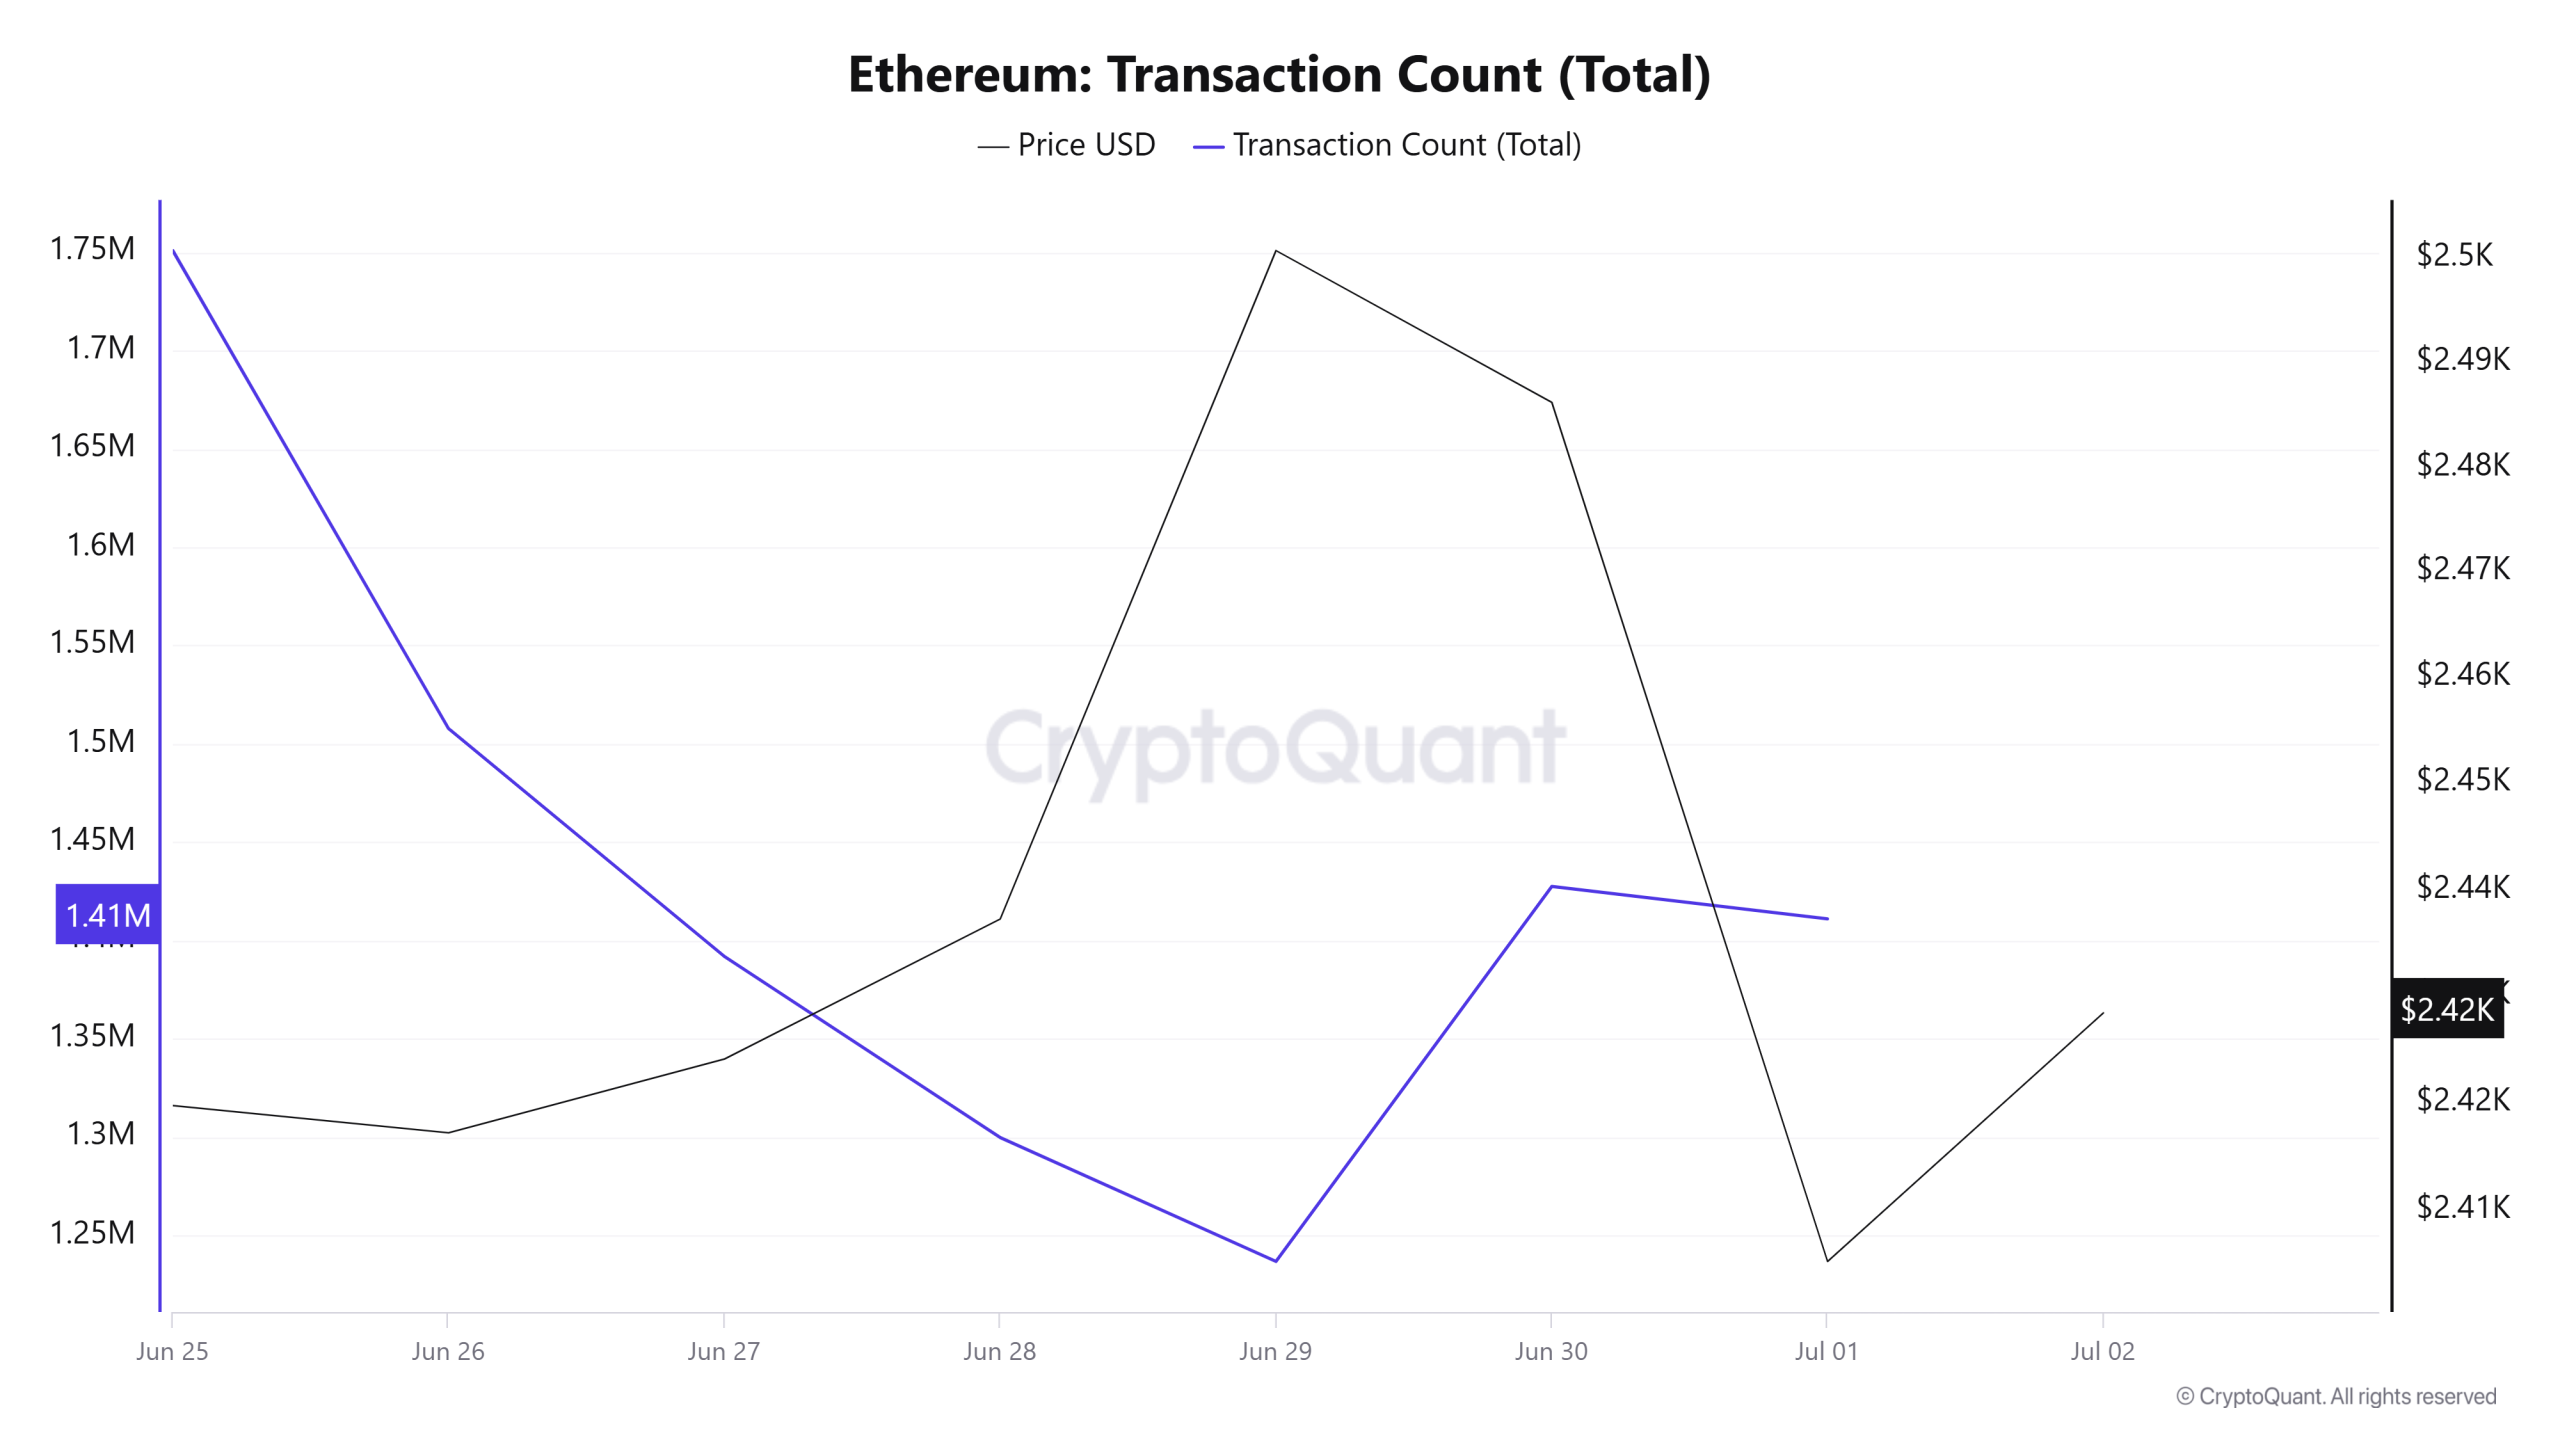
Last week, there were a total of 9,614,385 transactions on the Ethereum network, while this week it increased by about 4.27% to 10,025,292. The highest weekly transaction count was 1,750,940 on Giugno 25, while the lowest was 1,236,650 on Giugno 29.
The change in the number of transactions shows that the utilization of the network has increased compared to last week and accordingly, Ethereum burns have accelerated. The correlation between price and number of transactions was generally negative during the week.
Gettoni trasferiti
Last week, the total amount of ETH transferred on the Ethereum network was 13,023,438, while this week it decreased by approximately 21.67% to 10,201,279. The 1,972821 ETH transfer on Luglio 1 was the highest daily token transfer amount of the week, while the lowest value of the week was recorded on Giugno 29 with only 716,389 ETH transferred. Throughout the week, the price-to-token relationship showed a negative correlation.
The increase in the amount of transfers in use of the network, as well as the decrease in the amount of tokens transferred, suggests that small-scale transactions are on the rise. Avoiding large value transfers while increasing the number of transactions may imply market uncertainty or low risk appetite.
Rapporto di leva finanziaria stimato
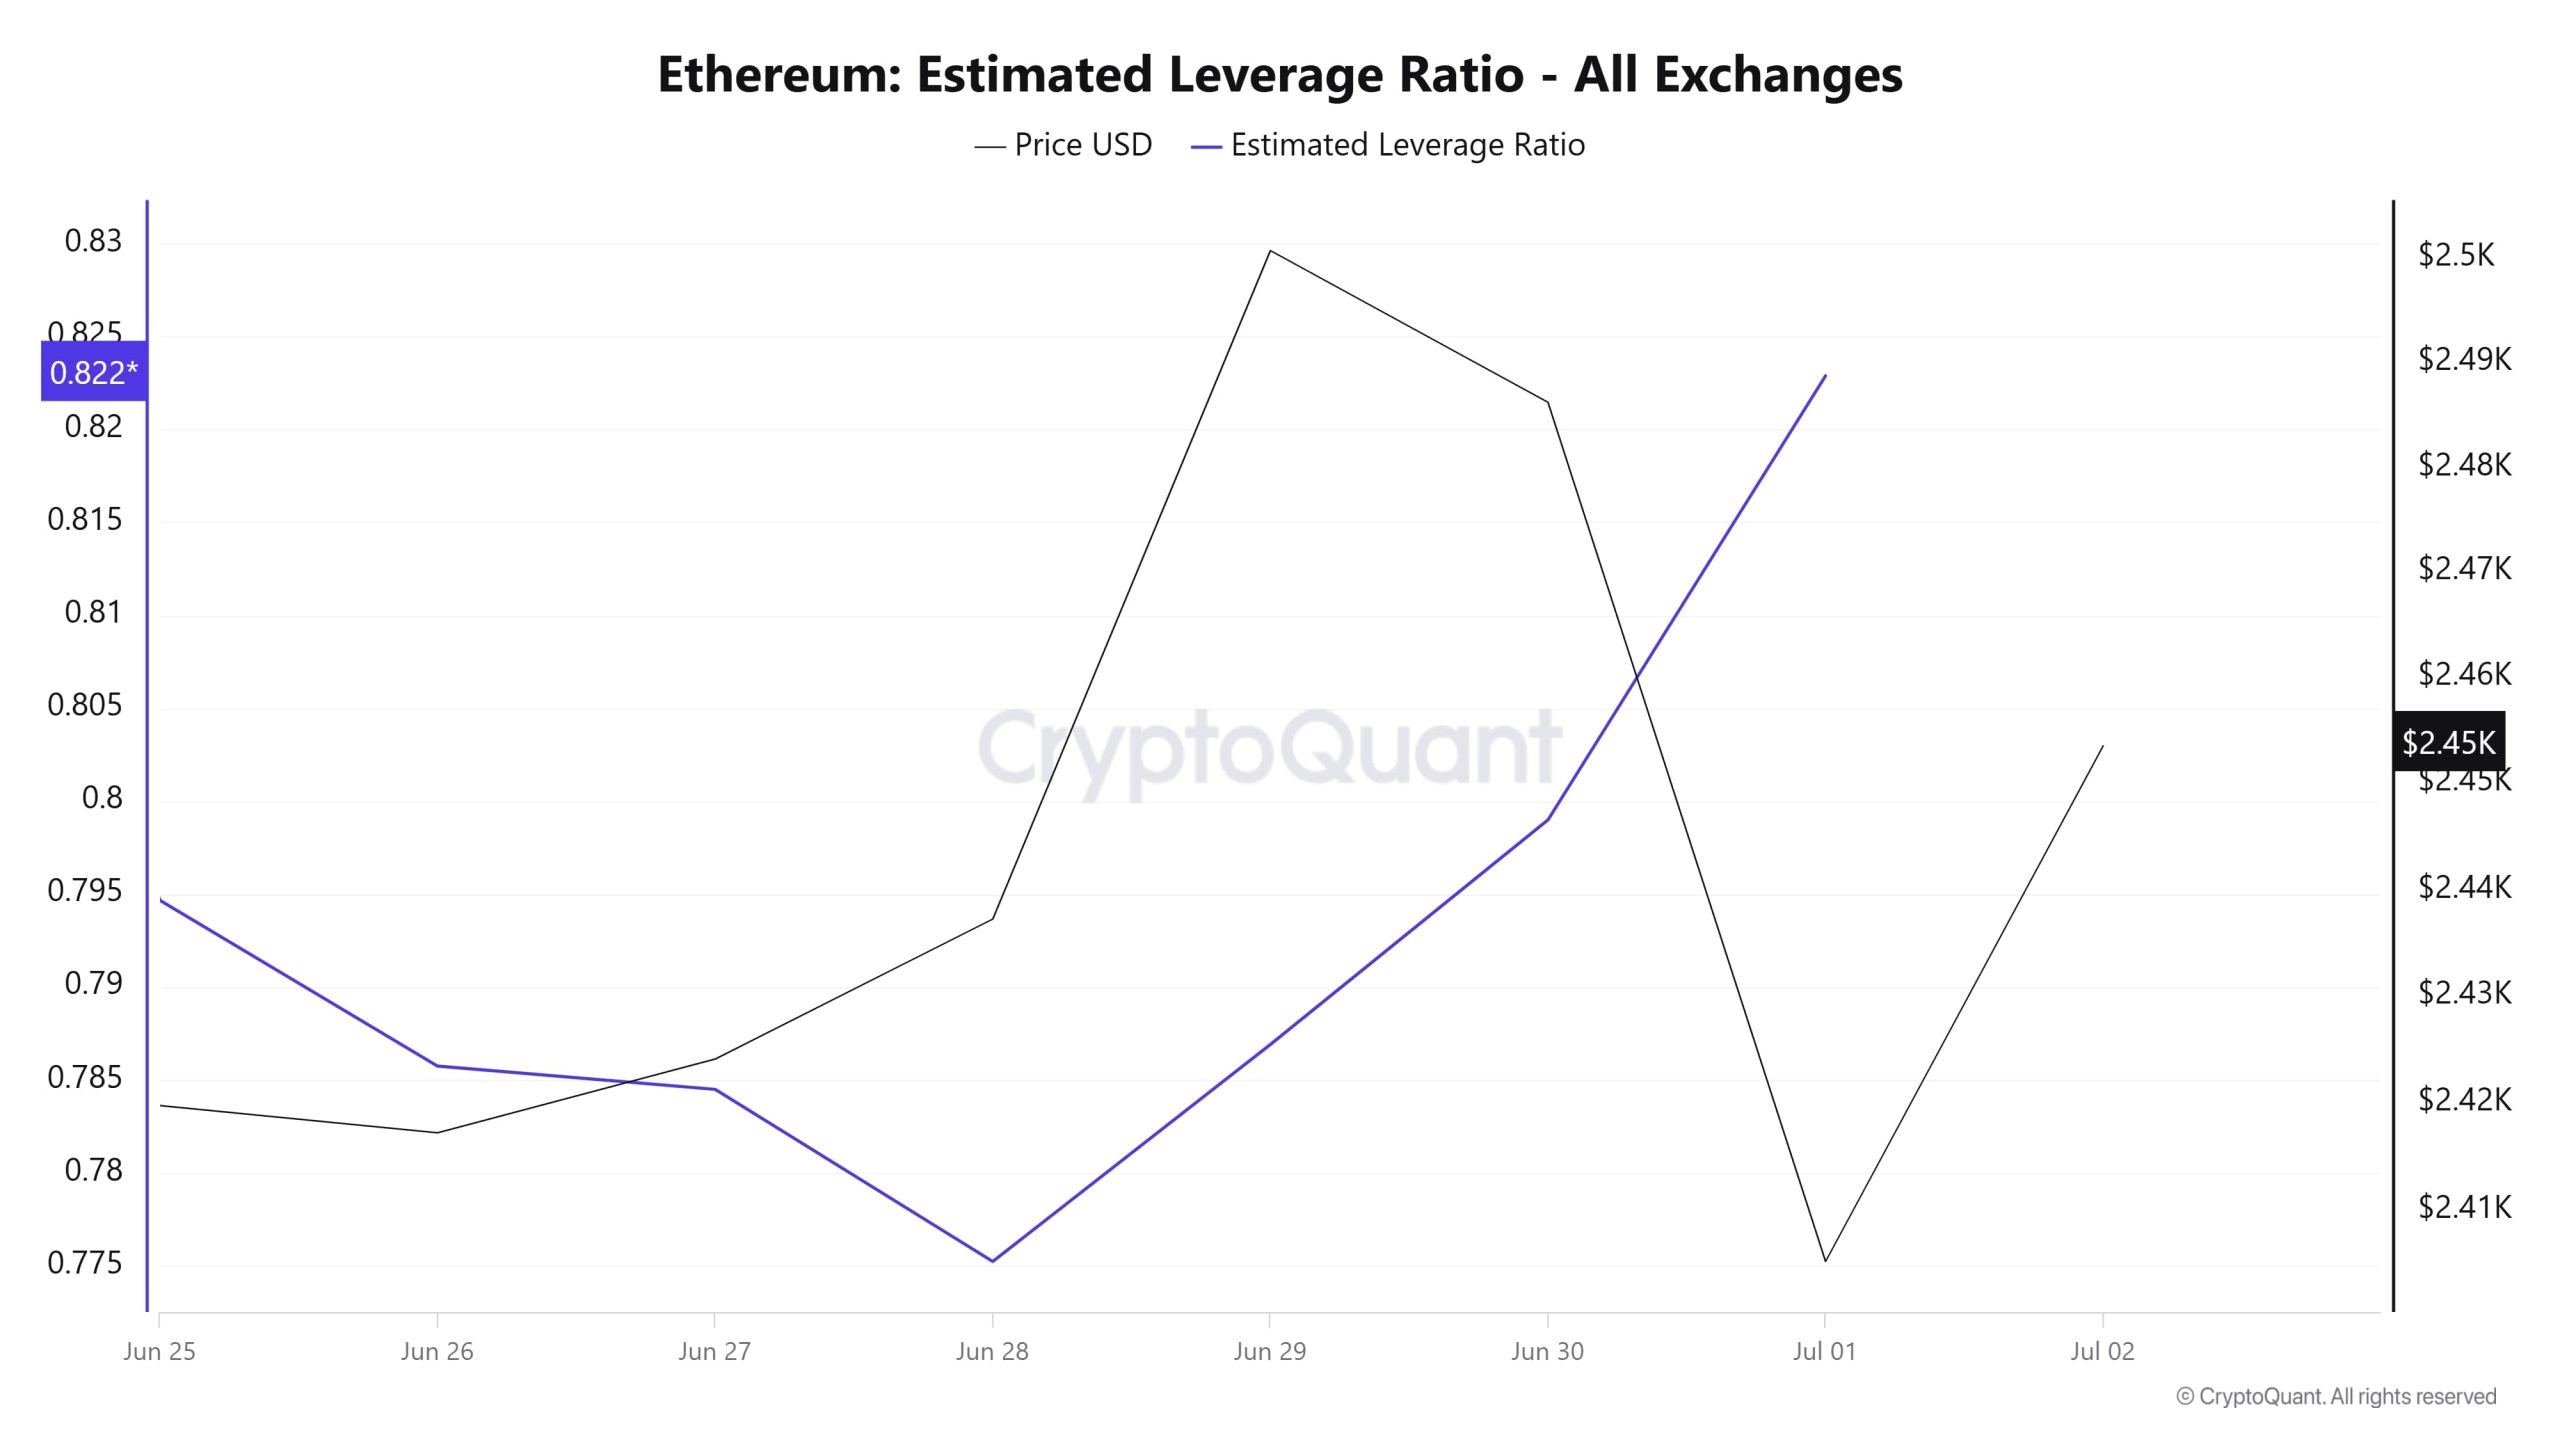
During the 7-day period, the metric generally fell during the first part of the process. ELR (Estimated Leverage Ratio), which had a value of 0.794 at the beginning of the process, reached 0.775 on Giugno 28. This was also the low point of the process. The metric continued to rise after the rest of the process, reaching 0.822 at the time of writing, which is the peak of the process. A higher ELR means that participants are willing to take on more risk and generally indicates bullish conditions or expectations. It should be noted that these rises can also be caused by a decrease in reserves. When we look at Ethereum reserves, there were 18.85 million reserves at the beginning of the process, while this figure continued to rise throughout the rest of the process. It is currently seen as 19.01 million. At the same time, Ethereum’s Open Interest is seen as 31.53 billion dollars at the beginning of the process. As of now, the volume has stabilized in the process and the open interest value stands out as 32.18 billion dollars. With all this data, the ELR metric generally followed an upward trend. The price of the asset, with all this data, was valued at $ 2,524 at the top of the process, while the lowest point was realized at $ 2,367. At the time of writing, the increase in the risk appetite of investors and traders continues. The fact that the ELR ratio also increased along with the rise in reserves throughout the process indicates that the leverage ratios of open interest have increased. As a result, although reserves remained flat in the last days of the process, the increase in the ELR metric shows that leverage rates are increasing in the open interest metric and the market is currently in an appetitive approach.
ETH Onchain Nel complesso
| Metrico | Aumento 📈 | Declino 📉 | Neutro ➖ |
|---|---|---|---|
| Indirizzi attivi | ✓ | ||
| Valore totale puntato | ✓ | ||
| Derivati | ✓ | ||
| Distribuzione delle forniture | ✓ | ||
| Riserva di scambio | ✓ | ||
| Tasse e ricavi | ✓ | ||
| Blocchi estratti | ✓ | ||
| Transazione | ✓ | ||
| Rapporto di leva finanziaria stimato | ✓ |
*Le metriche e le indicazioni contenute nella tabella non descrivono né implicano di per sé un'aspettativa di future variazioni di prezzo per qualsiasi asset. I prezzi degli asset digitali possono variare in base a molte variabili diverse. L'analisi di onchain e la relativa guida hanno lo scopo di assistere gli investitori nel loro processo decisionale, e l'effettuazione di investimenti finanziari basati esclusivamente sui risultati di questa analisi potrebbe risultare in transazioni dannose. Anche se tutte le metriche producono un risultato rialzista, ribassista o neutrale allo stesso tempo, i risultati attesi potrebbero non essere visibili a seconda delle condizioni di mercato. Gli investitori che esaminano il rapporto farebbero bene a tenere conto di queste avvertenze.
Avviso legale
Le informazioni, i commenti e le raccomandazioni sugli investimenti contenuti nel presente documento non costituiscono servizi di consulenza sugli investimenti. I servizi di consulenza sugli investimenti sono forniti da istituti autorizzati su base personale, tenendo conto delle preferenze di rischio e di rendimento dei singoli. I commenti e le raccomandazioni contenuti nel presente documento sono di tipo generale. Tali raccomandazioni potrebbero non essere adatte alla vostra situazione finanziaria e alle vostre preferenze di rischio e rendimento. Pertanto, prendere una decisione di investimento basandosi esclusivamente sulle informazioni contenute nel presente documento potrebbe non portare a risultati in linea con le vostre aspettative.
NOTE: All data used in Ethereum onchain analysis is based on Cryptoqaunt.

