
Analisi tecnica
BTC/USDT
Israel launches new airstrikes against central Iran, further escalating regional tensions. In the trade negotiations between the US and the EU, the European side is preparing to conditionally accept a 10% fixed tariff. Strategy bought another 10,100 BTC in the last week. US stock markets will be followed in the rest of the day, and it is noteworthy that pro-crypto companies are preparing for a positive opening in futures trading.
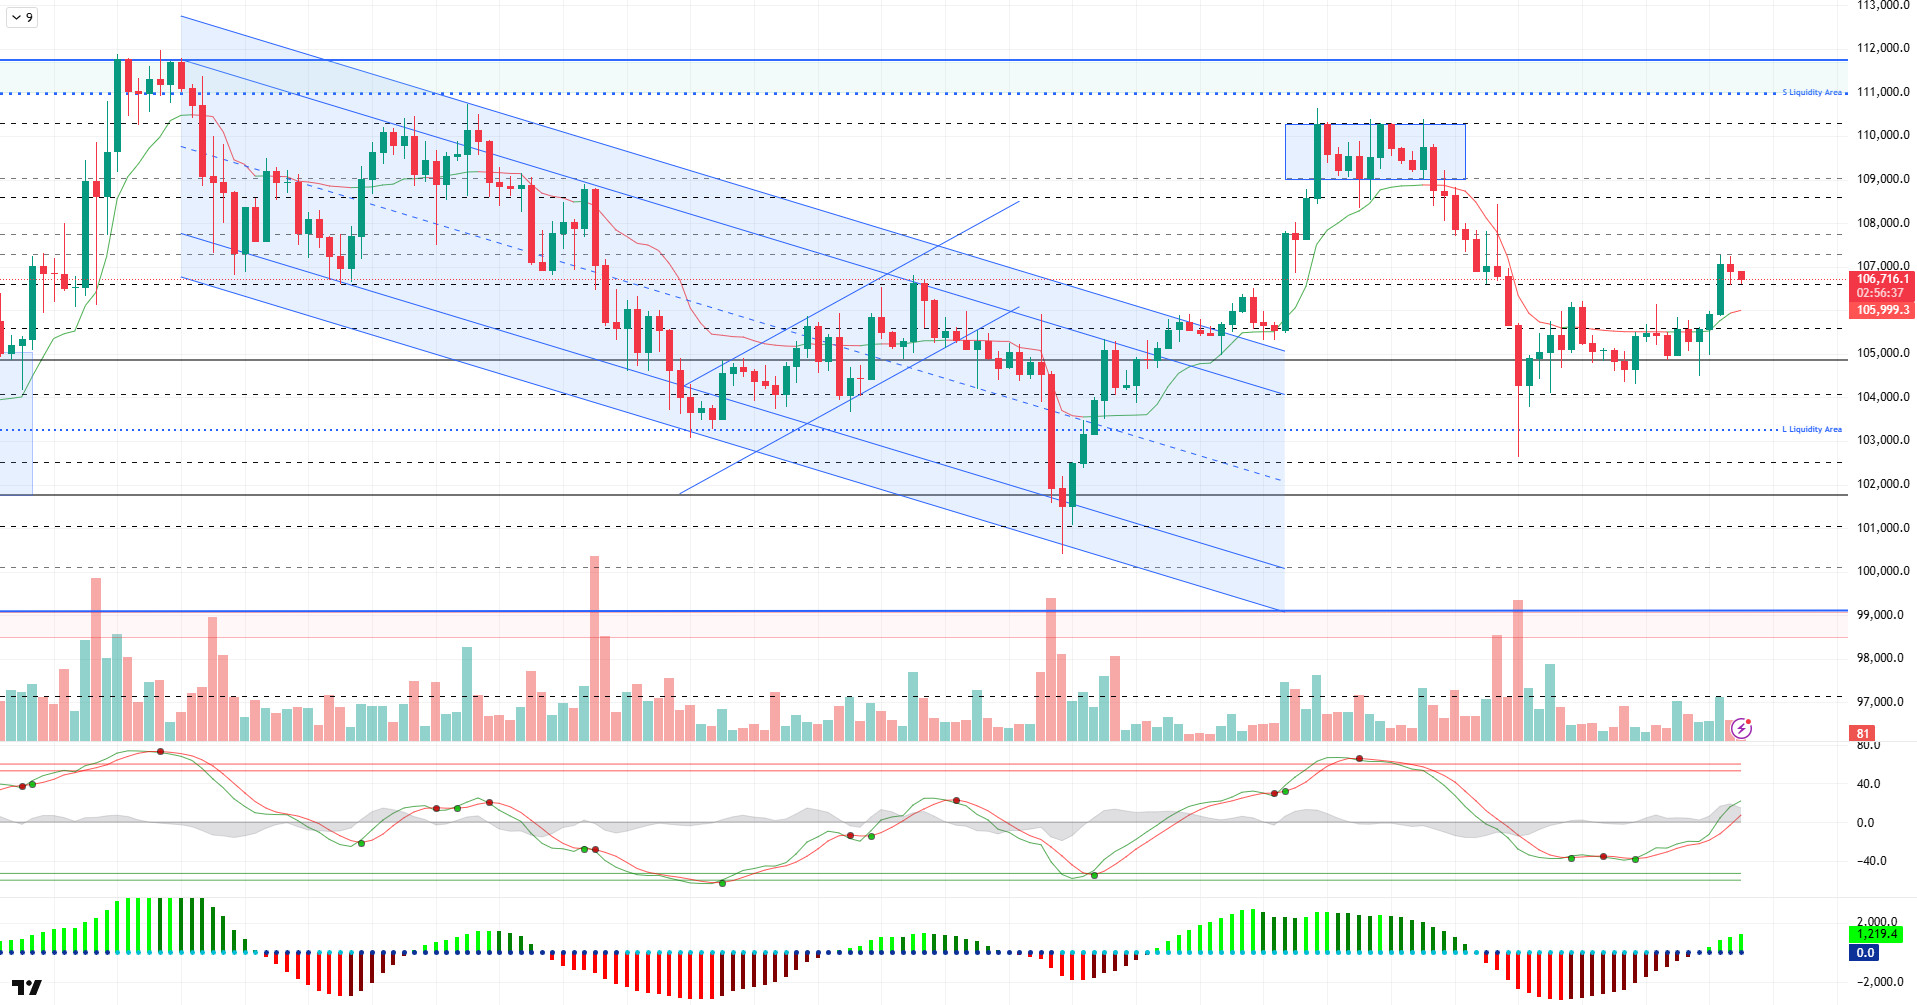
When we look at the technical outlook after the latest developments, it is seen that BTC, which continued its upward movement during the day, tested the 107,300 resistance level after exceeding the 106,600 level, but fell back to the 106,600 level again with the selling pressure it faced at this level. At the time of writing, BTC continues to trade at 106,800 levels.
In terms of technical indicators, there is no significant change compared to the previous analysis, while the wave trend oscillator maintains its buy signal. The momentum indicator has gained some more strength and remains in positive territory, while the Kaufman moving average is in a supportive position below the price. In addition, the ER value, which measures trend strength, is hovering at 0.60.
According to the liquidity data, it is observed that with the recent rise, selling transactions have been significantly liquidated and buying positions are concentrated at the 103,300 support level. This suggests that this region may function as a demand zone again in a possible pullback.
Overall, technical indicators continue to confirm the bullish scenario, while the impact of fundamental developments seems to limit the momentum. As liquidity data suggests, the potential for increased volatility and spike movements is high. In this context, the 106,600 – 107,300 band is critical and the closes in this range may be decisive for the continuation of the rise. In a possible selling pressure, 106,600 level will be the first support and then 105,000 level will be followed as a reference support point.
Supports 106,600 – 105,850 – 105,000
Resistances 107,300 – 108,600 – 110,000
ETH/USDT
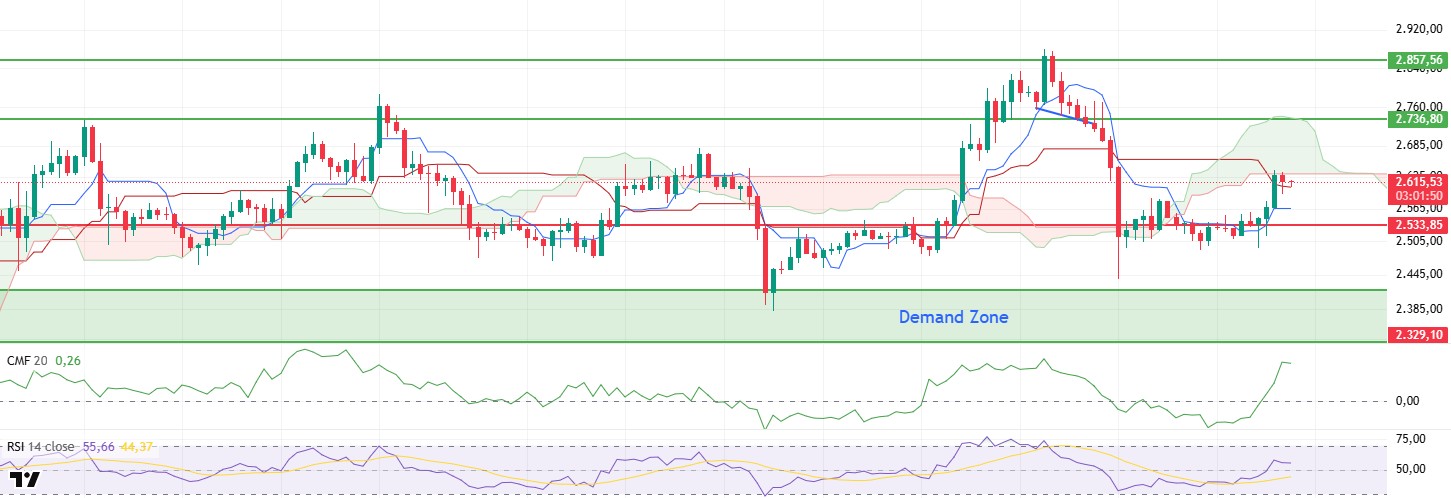
ETH maintained its balance at $2,600, moving in a narrow band with limited volatility during the day. While this horizontal course shows that the market is in an unstable structure, technical analysis data reveals that there is no transition to a negative structure yet, on the contrary, the positive outlook continues. Especially when evaluated within the framework of the Ichimoku cloud, the fact that the price remains above both the tenkan and kijun futures levels shows that buyers continue to remain active in the market. This indicates that the current horizontal movement may be an accumulation process and forms the basis for possible upward breakouts.
Analysing the structure of the Kumo cloud, it is seen that the price fluctuates near the lower band and struggles to test the upper band. While the thickness of the cloud confirms that this level works as a strong resistance, it also strengthens the possibility that the price could exceed the previously tested levels if it persists above this area. In particular, the $2,736 level stands out as a short-term target. However, crossing this resistance with a voluminous breakout is critical for the sustainability of the upward movement.
On the indicators side, Chaikin Money Flow (CMF) remains in positive territory. This indicates that capital inflows to the market continue and selling pressure remains limited for now. On the other hand, the momentum indicator maintains its upward trend. This strengthens the momentum in the market in technical terms and feeds the upside potential of the current pricing. The upward momentum may increase the possibility of an aggressive rise in the price, especially during the exit phase from the consolidation process.
However, in order to maintain the positive technical outlook, the price needs to close at least four hours above the kijun level of $2.605. Any sags below this level may cause the price to move to a weak outlook. In particular, closes below the $ 2,605 level may negatively affect market perception and cause the price to retreat to $ 2,533.
Supports 2,533 – 2,329 – 2,130
Resistances 2,736 – 2,857- 3,062
XRP/USDT
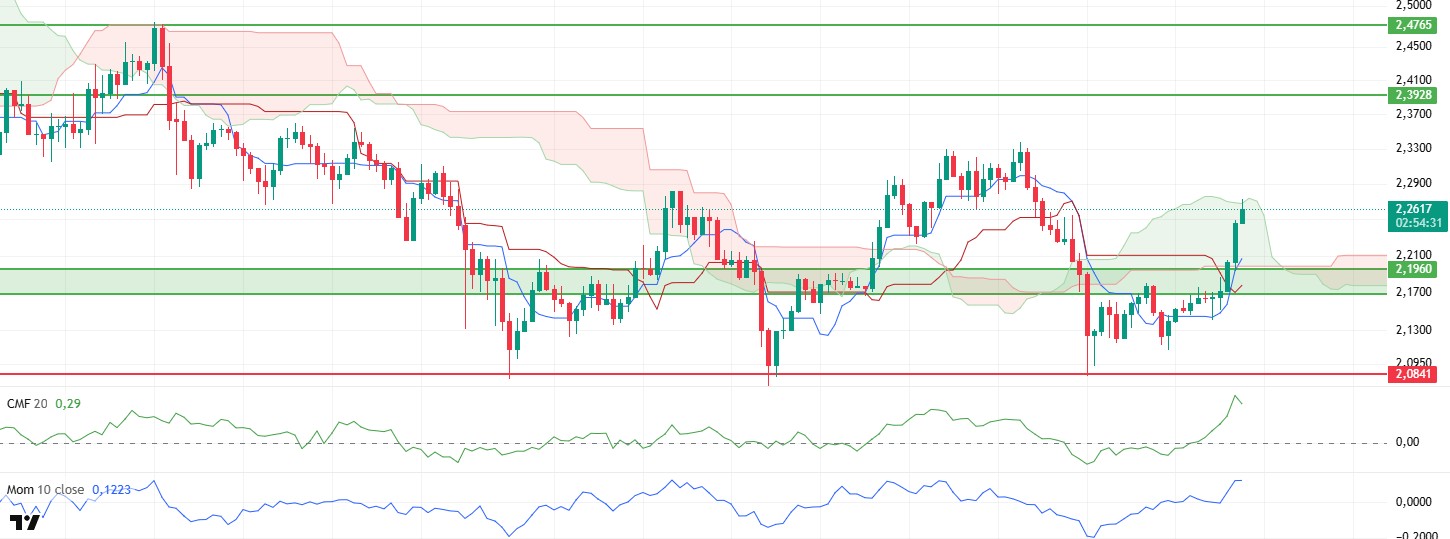
XRP moved as predicted in the technical evaluations made in the morning hours, breaking the lower band of the kumo cloud in the upward direction and continued its rise to the upper band of the cloud. With this move, the price rose to the level of $ 2.27, but with the profit realizations from this level, there was some retracement and the price fell to the level of $ 2.25. This correction movement is considered as a normal situation within the current technical structure and does not produce a clear signal that the trend is reversing at this stage. The fact that the price is still in the Ichimoku cloud, especially on short-term charts, shows that the market’s search for direction continues and the possibility of a breakout is on the agenda.
When technical indicators are analyzed in detail, the Chaikin Money Flow (CMF) indicator stands out remarkably. Although the indicator has retreated slightly after the sharp rise in recent days, indicating a limited outflow of market liquidity, CMF is still in positive territory. This suggests that the buy side remains strong across the market and that the correction is taking place on a structurally positive backdrop. The fact that CMF remains in positive territory is important to confirm that institutional or high volume buying is still effective in the market.
The momentum indicator, on the other hand, accompanies the bullish move, indicating that pricing is technically supported and that the current move is not just a short-term speculative rally. Momentum’s upward trend suggests that the uptrend is on a healthy footing and that the market may regain momentum, especially despite the price correction in recent hours.
Under this technical structure, especially in the evening hours, if the price rises above the limits of the kumo cloud and provides permanence above the upper band of the cloud, it may indicate that the upward movement may continue with a new momentum. In such a scenario, targets above $ 2.30 may come back on the agenda in the short term. However, on the other hand, if the price continues to retreat and the strong support zone at the level of $ 2.19 is violated, the current technical structure will deteriorate and the selling pressure may become evident and pull the price back to $ 2.10 levels. should be considered. For this reason, the $2.19 level is a critical threshold in terms of both preserving the technical structure and activating new buying opportunities.
Supports 2.1960 – 2.0841 – 1.6309
Resistances 2.3928 – 2.4765- 2.5900
SOL/USDT
MemeStrategy bought 2,440 Solana tokens.
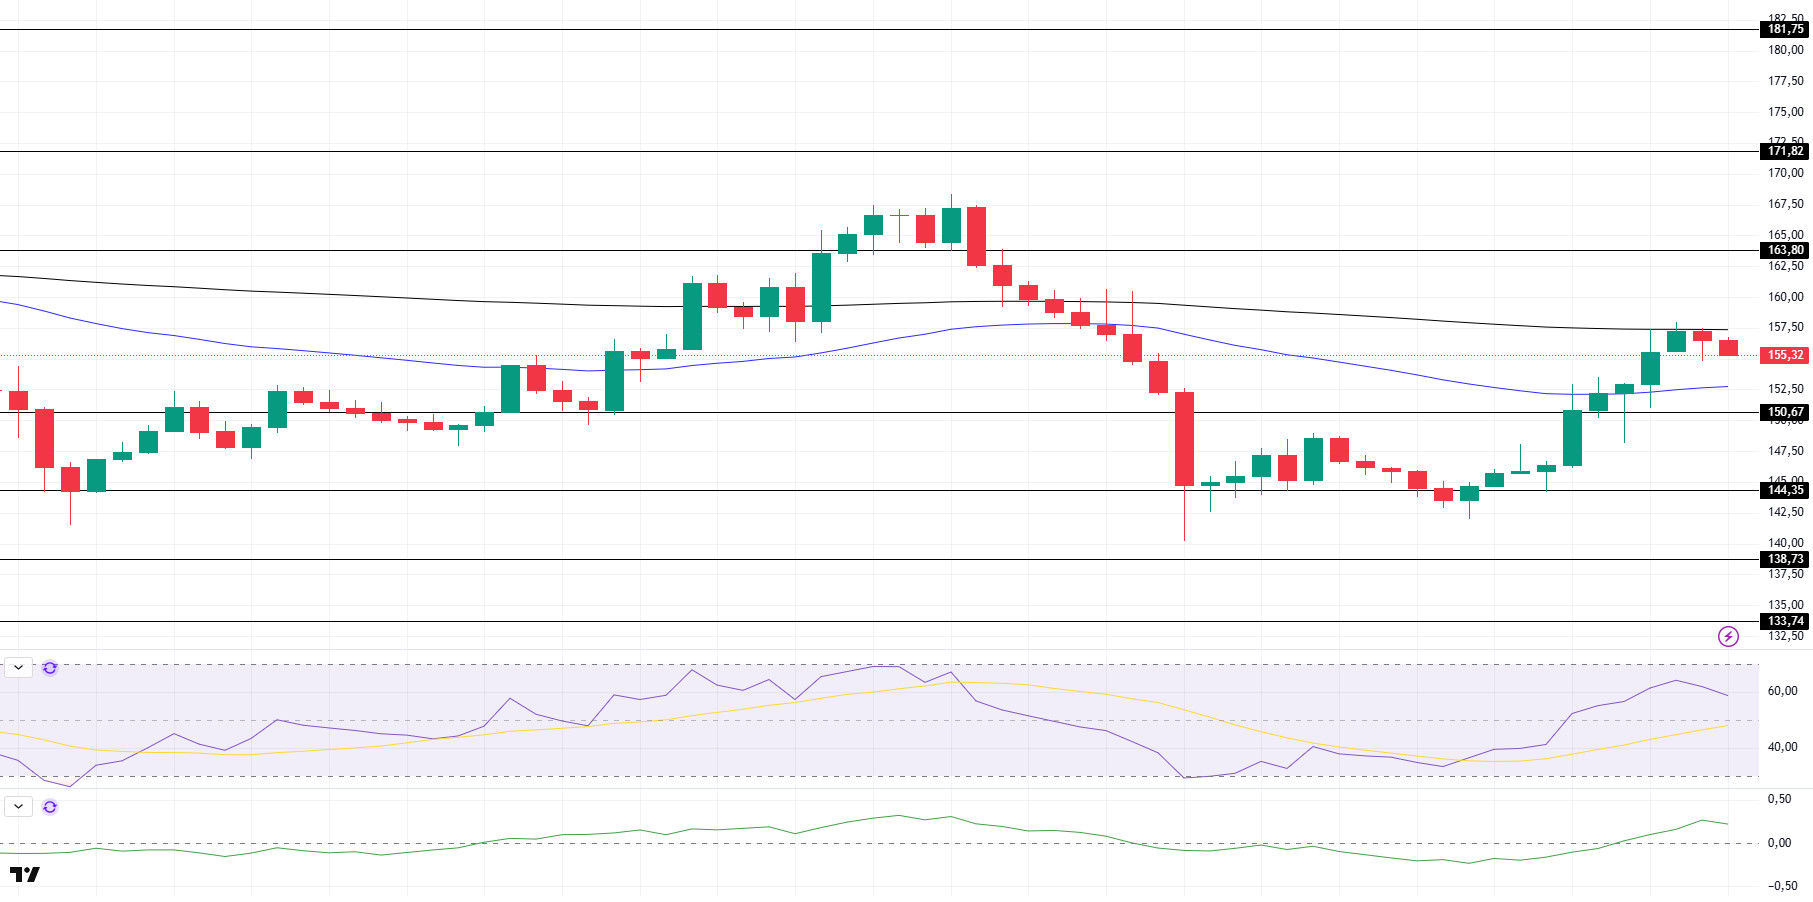
SOL price was bearish during the day. The asset tested the 200 EMA moving average, a strong resistance, but failed to break it and retreated. If the pullback continues, it may test the 50 EMA (Blue Line) as support. If the upward movement continues, the $163.80 level, which is a strong resistance, may be triggered.
On the 4-hour chart, the 50 EMA continued to be below the 200 EMA. This suggests that the bearish trend may continue in the medium term. At the same time, the fact that the price is between both moving averages suggests that the market is currently in a short-term decision-making phase. Chaikin Money Flow (CMF-20) crossed into positive territory; in addition, a decrease in daily inflows may move CMF into negative territory. Relative Strength Index (RSI-14) is at the mid-point of the positive zone, but selling pressure is building. This may cause a pullback. The $163.80 level stands out as a strong resistance point in case of a bullish breakout on the back of macroeconomic data or positive news on the Solana ecosystem. If this level is broken upwards, the rise can be expected to continue. If there are pullbacks due to contrary developments or profit realizations, the $150.67 level may be retested. In case of a decline to these support levels, the increase in buying momentum may offer a potential bullish opportunity.
Supports 150.67 – 144.35 – 138.73
Resistances 163.80 – 171.82 – 181.75
DOGE/USDT
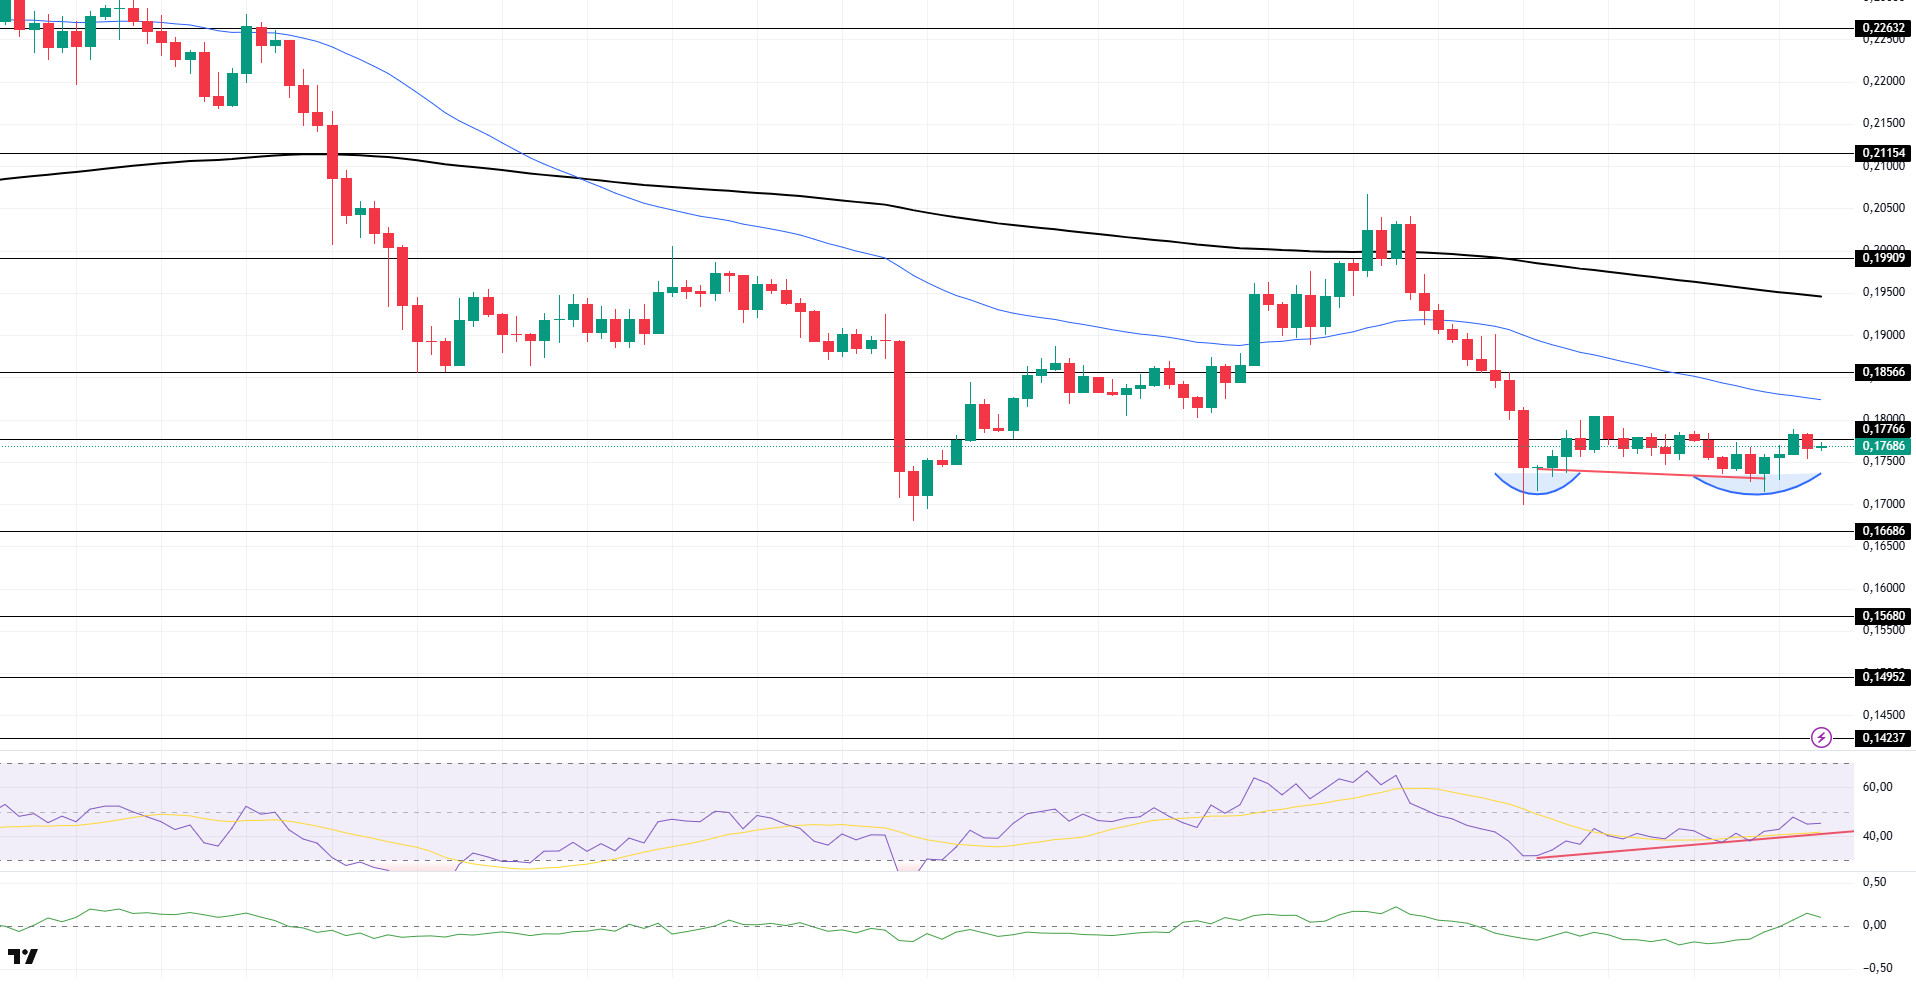
The DOGE price continued its sideways trend during the day. Failing to break the strong resistance at $0.17766, the asset may test the 50 EMA (Blue Line) if it breaks there. On the other hand, the double bottom formation may be bullish.
On the 4-hour chart, the 50 EMA (Blue Line) continues to be below the 200 EMA (Black Line). This shows us that the asset is bearish in the medium term. The fact that the price is below the two moving averages suggests that the asset is bearish in the short term. The Chaikin Money Flow (CMF-20) indicator moved into positive territory. In addition, negative money inflows may move CMF into negative territory. Relative Strength Index (RSI-14), on the other hand, remained in negative territory, but buying pressure has started to build. This may allow the price to recover. On the other hand, a positive divergence has formed. However, it remains above the uptrend that has formed since Giugno 13. This may cause the price to move higher. The $0.18566 level stands out as a strong resistance zone in the event of a rally in line with political developments, macroeconomic data or positive news flow in the DOGE ecosystem. In the opposite case or possible negative news flow, the $0.16686 level may be triggered. In case of a decline to these levels, the increase in momentum may start a new bullish wave.
Supporti 0,16686 - 0,15680 - 0,14952
Resistenze 0,17766 - 0,18566 - 0,19909
Avviso legale
Le informazioni sugli investimenti, i commenti e le raccomandazioni contenute nel presente documento non costituiscono una consulenza sugli investimenti. I servizi di consulenza sugli investimenti sono forniti individualmente da istituzioni autorizzate che tengono conto delle preferenze di rischio e di rendimento dei singoli individui. I commenti e le raccomandazioni contenuti nel presente documento sono di natura generale. Tali raccomandazioni potrebbero non essere adatte alla vostra situazione finanziaria e alle vostre preferenze di rischio e rendimento. Pertanto, prendere una decisione di investimento basandosi esclusivamente sulle informazioni contenute nel presente documento potrebbe non produrre risultati in linea con le vostre aspettative.