BTC/USDT
Trump’s long-advocated “Great and Beautiful” tax and spending bill passed the House of Representatives and was sent to the White House for signature. At the same time, crypto regulations are gaining momentum: In mid-July, three major bills will be placed on the House agenda. During this process, Trump announced that they will impose new tariffs of up to 60% on some countries starting August 1, while Senator Lummis proposed a new tax reform that could directly affect crypto users. While there is no development in the data set today, US markets are closed due to “Independence Day”.
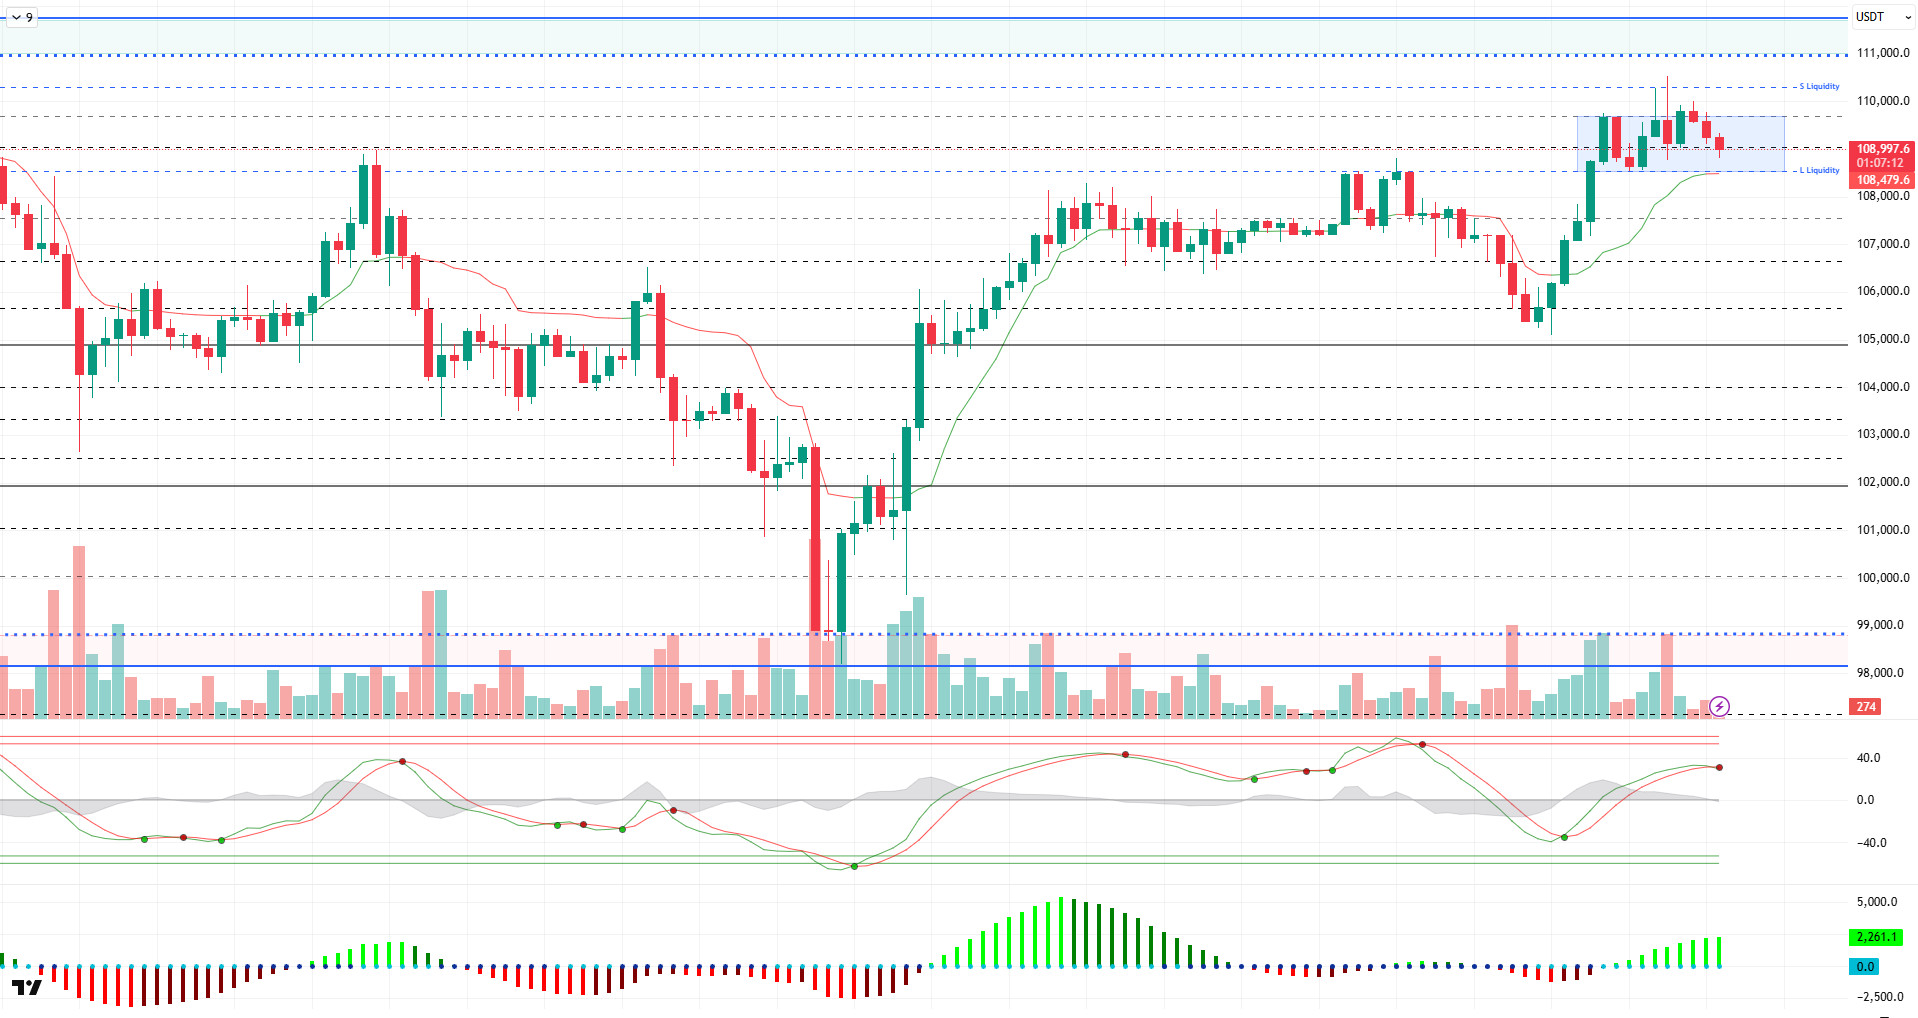
When we look at the technical outlook, BTC continues to maintain its strong stance, while the horizontal band range it formed near the ATH level attracts attention. The price, which could not maintain above the resistance level of 110,000, continues to retreat and trade just below the 109,000 level.
Technical indicators are showing signs of weakening near the overbought zone, with the Wave Trend (WT) trend reversal. The histogram on the Squeeze Momentum (SM) indicator is showing a negative mismatch as it moves back into positive territory. The Kaufman moving average is just below the price at 108,400.
When the liquidity data is analyzed, BTC, which headed towards the liquidity area with the recent rise, this time liquidated the sell-side transactions above 110,000. Then, the price, which faced selling pressure, fell below the 109,000 level, while it may target buy trades at 108,400.
As a result, while fundamental developments continue to be a catalyst for pricing, a new catalyst may be needed for the uptrend to gain momentum after this stage. Technically, while the possibility of a correction is on the agenda, liquidity data draws a neutral picture. After the market’s short-term search for direction on the horizontal, the intensity in liquidity data may give us a message about the direction. In this context, we will follow the 109,000-110,000 band for now. In case the rise regains momentum, the price exceeding the 110,000 level will be a reference for us on behalf of the new ATH, while in a possible selling pressure, the reaction of the price from the liquidity area at 108,500 will be followed.
Supports 109,000 – 108,500 – 107,500
Resistances 110,000 – 111,000 – 111,970
ETH/USDT
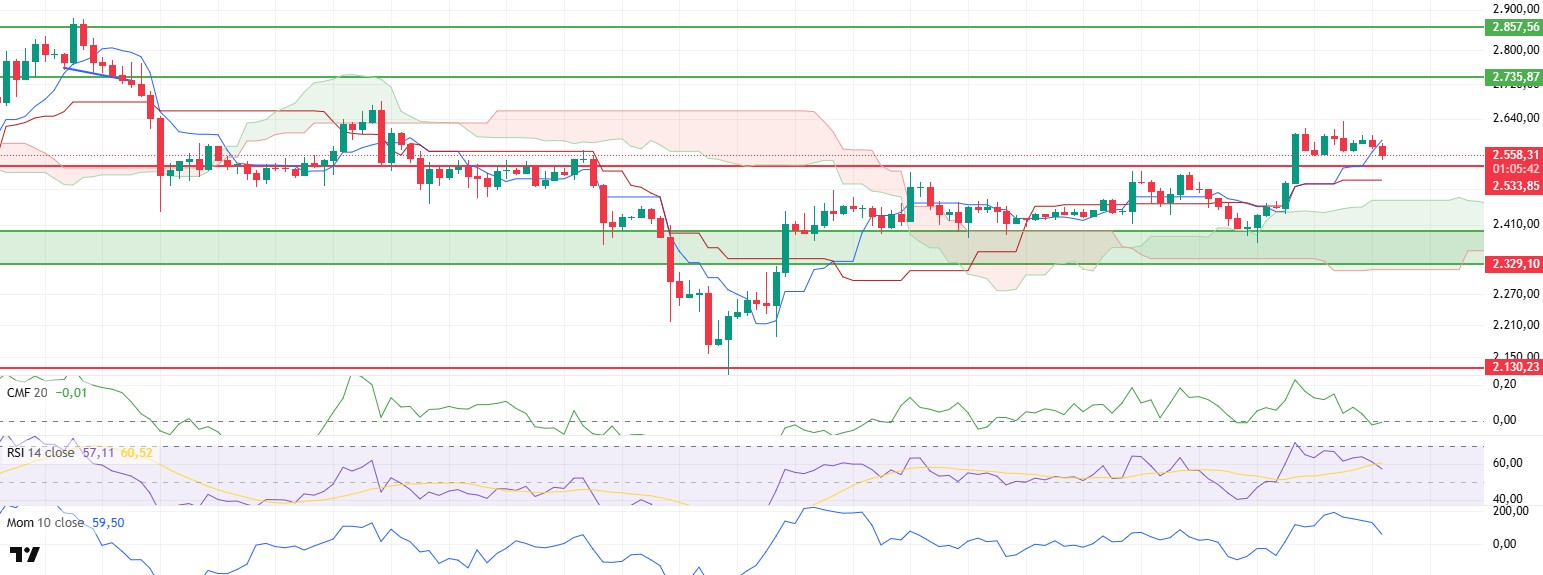
Although ETH regained the $2,600 level after the decline it experienced yesterday evening, it could not sustain this gain with the selling pressure in the morning hours and the price retreated to the $2,550 level. This movement shows that short-term profit realizations are effective in the market and investors are cautious about pricing in this region.
On the technical indicators side, the ichimoku indicator has produced a short-term negative signal when the price moves below the tenkan level. This signal indicates that the price may remain under pressure for a while in the short term. However, despite this, the fact that the kumo cloud continues to expand upwards and the price is still priced above the kijun level suggests that the overall structure remains positive. This creates an environment where declines may remain limited and pullbacks can be considered as buying opportunities.
The Chaikin Money Flow (CMF) indicator, on the other hand, has retreated to the zero line and is now searching for equilibrium in this region. This outlook reveals that there is no intense liquidity outflow from the market and that buyers are still in place despite limited selling. CMF’s support from the zero zone provides a positive backdrop for bullish scenarios.
Momentum and Relative Strength Index (RSI) indicators point to continued short-term pressure. In particular, the fact that the RSI continues to remain below the based MA line indicates that the weak trend continues and the possibility of a short-term decline increases before a new recovery begins during the day.
As a result, slight pullbacks are likely to continue in intraday pricing. However, there is no breakdown in the main trend yet. If the price holds above the $2,533 level, it is likely to test the $2,600 level again later in the day. As long as this threshold can be maintained, the market can be expected to maintain its positive trend.
Top of Form
Below the Form
Supports 2,329 – 2,130 – 2,029
Resistances 2,533 – 2,736 – 2,857
XRP/USDT
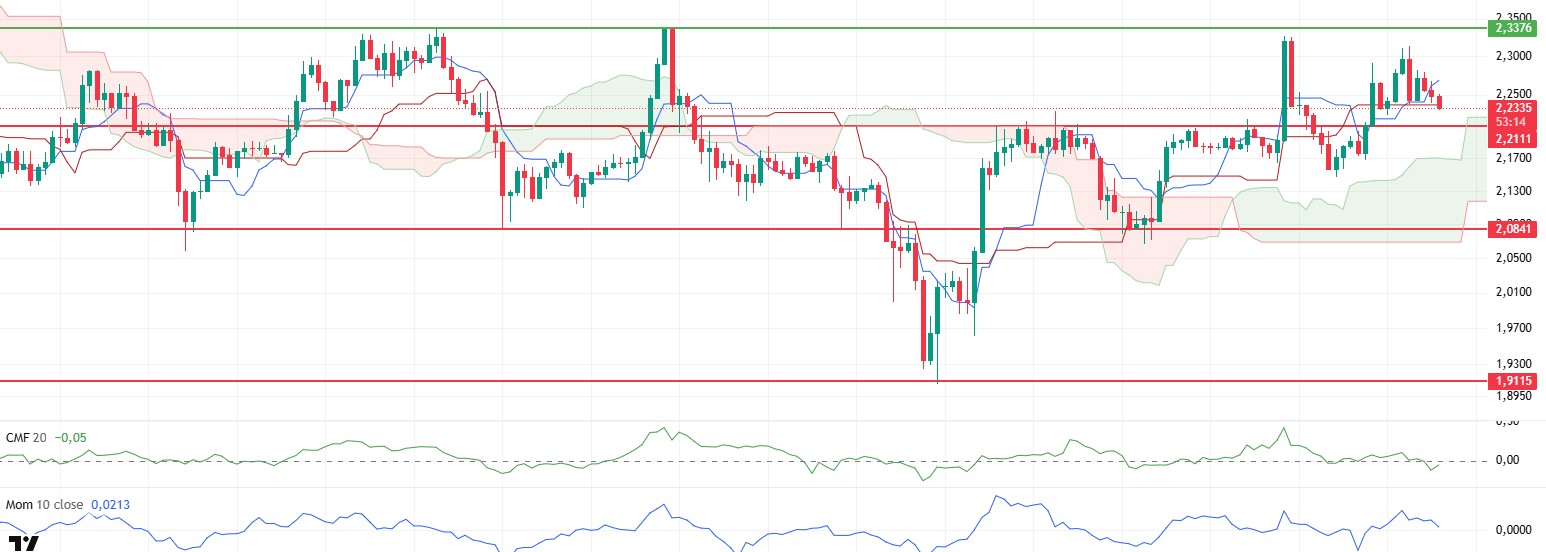
XRP continued its downward trend, which started yesterday evening, in the morning hours and fell as low as $2.23. Although this decline shows that short-term weakness continues, maintaining certain technical levels continues to be decisive in terms of the overall structure.
When technical indicators are evaluated, the price’s decline to the kijun level on the ichimoku indicator indicates a short-term test of support. However, the fact that the price is still above the kumo cloud and the cloud structure continues to expand upwards indicates that the overall trend remains positive. This suggests that the current pullback may remain a correction and the main trend has not yet been broken.
The Chaikin Money Flow (CMF) indicator started to signal a weak recovery in this region after shifting into negative territory. CMF’s effort to move back into positive territory reveals that limited liquidity inflows continue in the market, albeit at a slower pace. This outlook supports that the selling pressure has not fully prevailed and buyers are still stepping in at certain levels.
The downward trend of the momentum indicator suggests continued short-term selling pressure and weakening market momentum. However, the positive divergence of the On Balance Volume (OBV) indicator on the hourly timeframe keeps the possibility of a sudden volume-led rebound on the agenda. This suggests that the current weakness in momentum may be short-lived and buyers may suddenly re-engage.
As a result, maintaining the $2.23 level during the day plays a critical technical role. If this region continues to work strongly as support, it may pave the way for the price to start an upward movement again. In the opposite scenario, that is, if this level is lost, the possibility of the price retreating to the level of $2.21 will increase. In the short term, the price behavior between these two levels will be decisive for the intraday direction of XRP.
Supports 2.2111 – 2.0841 – 1.9115
Resistances 2.3376 – 2.5900 – 2.8347
SOL/USDT
The Jito Foundation conducted a live upgrade to its TipRouter program, enabling Solana validators to distribute priority fees directly to shareholders. DeFi Development Corp, a publicly traded company in the US, announced the purchase of another 17,760 SOL tokens.
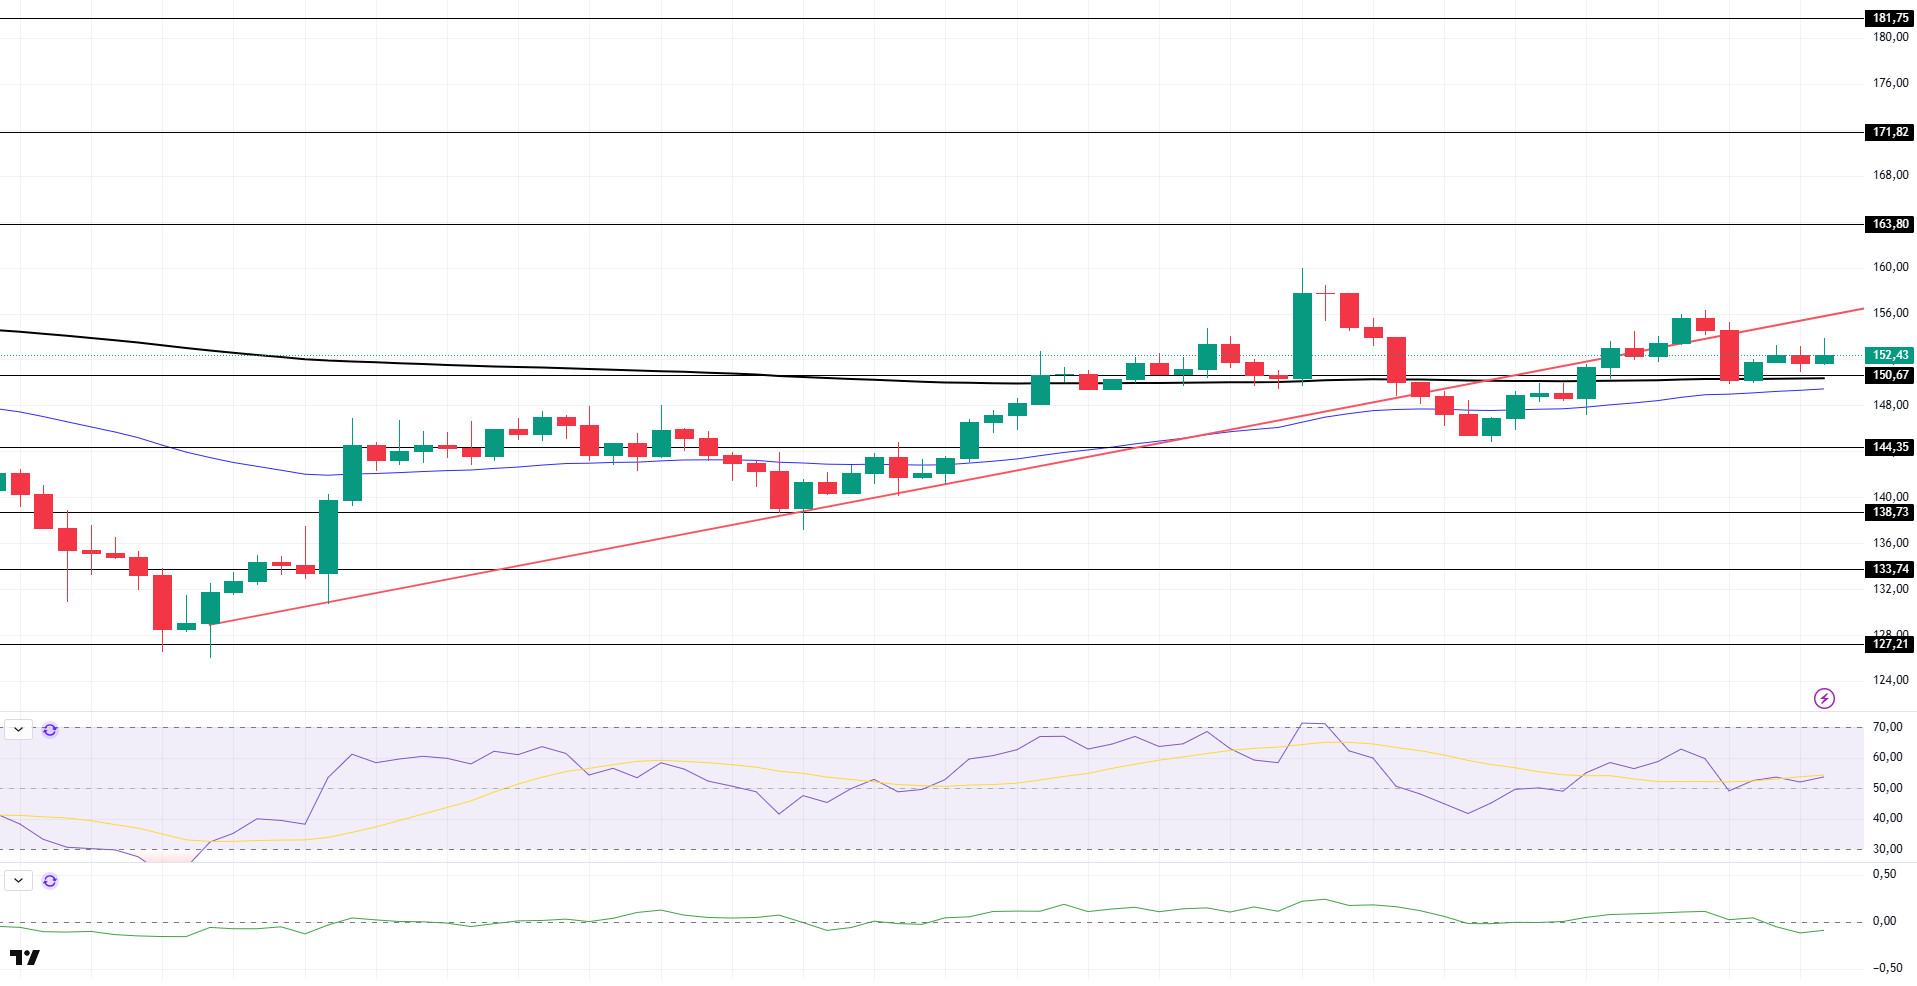
SOL price experienced a decline. The asset managed to hold above the strong resistance at $150.67 and the 200 EMA (Black Line). The price, which is currently below the uptrend that started on June 22, should follow the $ 144.35 level on candle closes below the 200 EMA moving average.
On the 4-hour chart, the 50 EMA (Blue Line) continued to be below the 200 EMA (Black Line). This suggests that the bearish trend may continue in the medium term. At the same time, the fact that the price is above both moving averages suggests that the market is currently bullish in the short term. Chaikin Money Flow (CMF-20) has crossed into negative territory; in addition, a decrease in inflows could take CMF deeper into negative territory. Relative Strength Index (RSI-14), on the other hand, remained in positive territory. The $163.80 level stands out as a strong resistance point in case of a bullish breakout on the back of macroeconomic data or positive news on the Solana ecosystem. If this level is broken upwards, the rise can be expected to continue. If there are pullbacks due to contrary developments or profit realizations, the $ 144.35 level can be tested. In case of a decline to these support levels, the increase in buying momentum may offer a potential bullish opportunity.
Supports 150.67 – 144.35 – 138.73
Resistances 163.80 – 171.82 – 181.75
DOGE/USDT
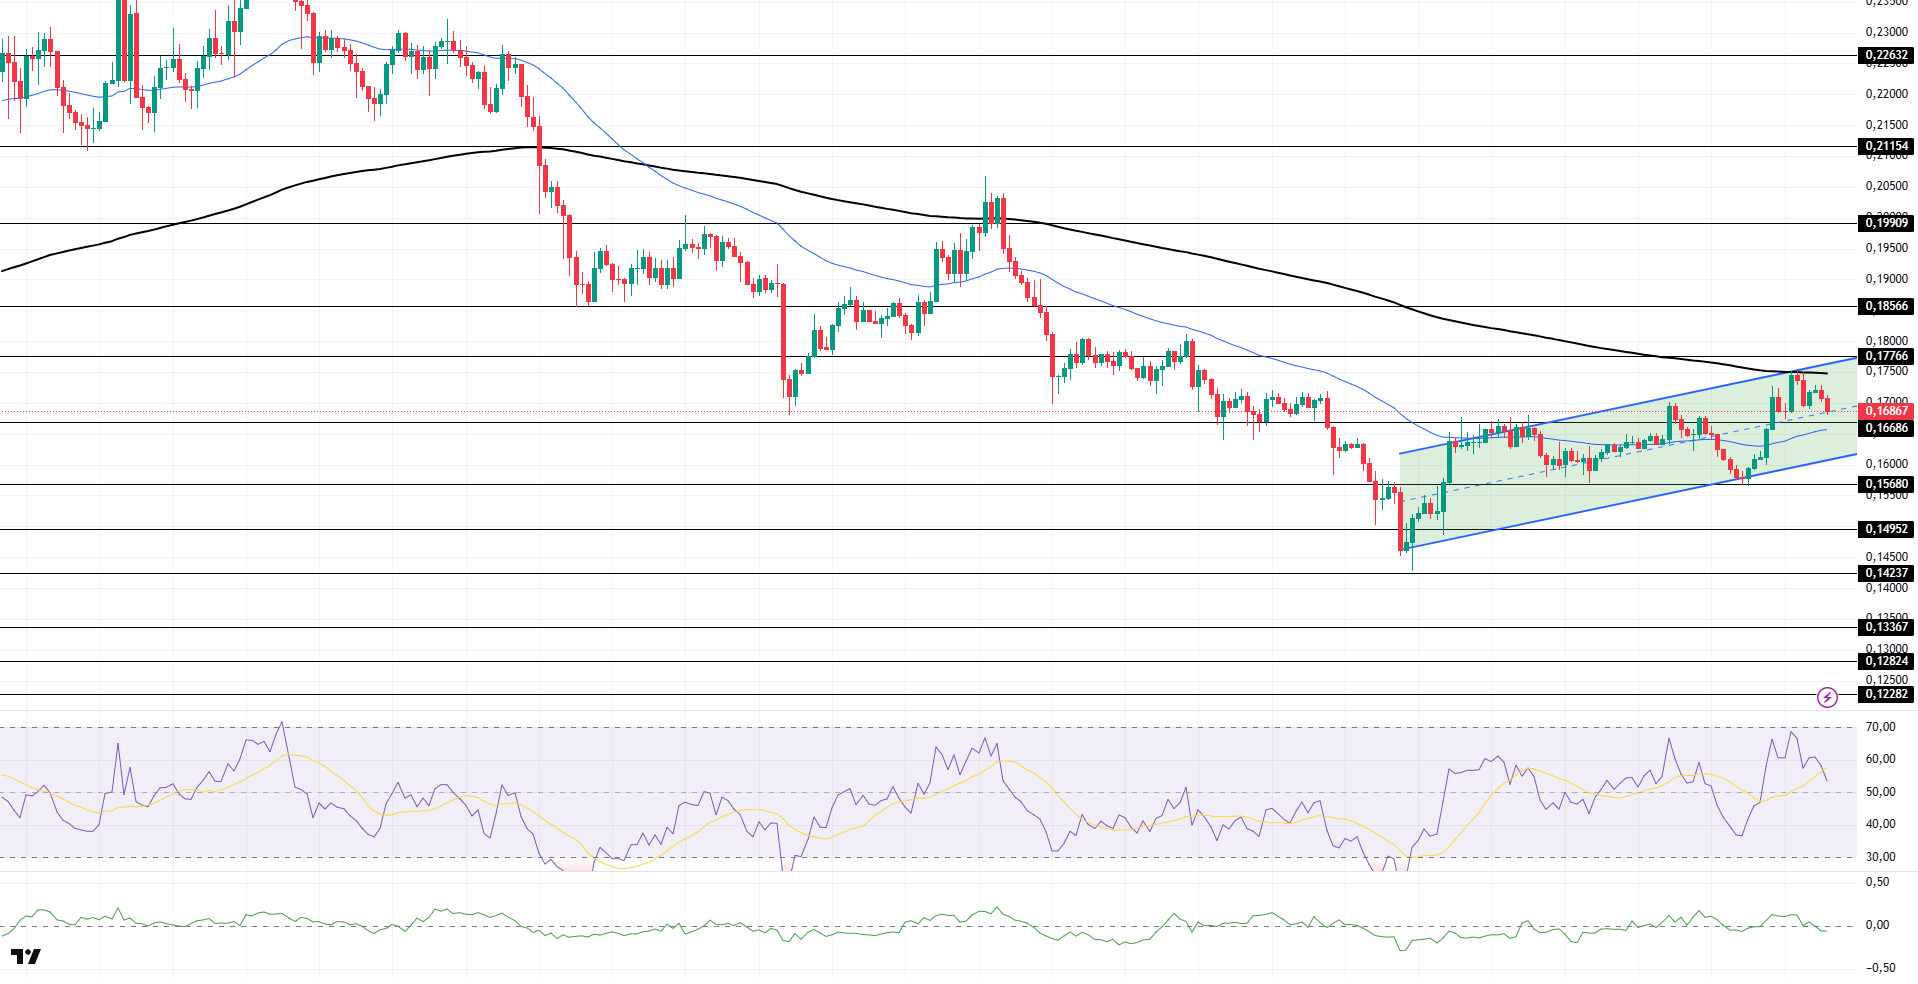
DOGE price moved sideways during the day. The asset, which managed to stay above the 50 EMA (Blue Line) moving average, failed to break the 200 EMA (Black Line) moving average and remained inside the falling pennant pattern. If the falling pennant pattern breaks down, the $0.12282 level should be followed.
On the 4-hour chart, the 50 EMA (Blue Line) continues to be below the 200 EMA (Black Line). This suggests that the asset is bearish in the medium term. The fact that the price is between both moving averages suggests that the asset is in the decision phase in the short term. Chaikin Money Flow (CMF-20) started to be in the negative territory. In addition, negative inflows may push CMF deeper into the negative territory. Relative Strength Index (RSI-14) continues to be in positive territory. However, selling pressure has emerged. The $0.17766 level stands out as a strong resistance zone in the case of possible rises in line with political developments, macroeconomic data or positive news flow in the DOGE ecosystem. In the opposite case or possible negative news flow, the $0.16686 level may be triggered. In case of a decline to these levels, the momentum may increase and start a new bullish wave.
Supports 0.16686 – 0.15680 – 0.14952
Resistances 0.17766 – 0.18566 – 0.19909
Legal Notice
The investment information, comments and recommendations contained herein do not constitute investment advice. Investment advisory services are provided individually by authorized institutions taking into account the risk and return preferences of individuals. The comments and recommendations contained herein are of a general nature. These recommendations may not be suitable for your financial situation and risk and return preferences. Therefore, making an investment decision based solely on the information contained herein may not produce results in line with your expectations.