
BTC/USDT
The Fed meeting minutes for Giugno, which will be released today, contain five important points regarding how monetary policy will take shape in the second half of 2025. The first is the possibility of an interest rate cut at the Luglio meeting. The second is the end of the “wait-and-see” period. If the minutes contain a clearer time frame rather than data-dependent guidance, the door could be opened for an interest rate cut in Settembre. Third, the decline in the threshold for an interest rate cut is noteworthy. The fourth is internal disagreements. There were serious differences of opinion among the 19 FOMC members. The reasoning behind the seven members who do not expect any cuts in 2025 is eagerly awaited by the market. The final headline will be statements on the balance between inflation and employment. The minutes will reveal whether the Fed continues to warn about price increases and whether it is concerned about the possibility of a deterioration in the labor market.
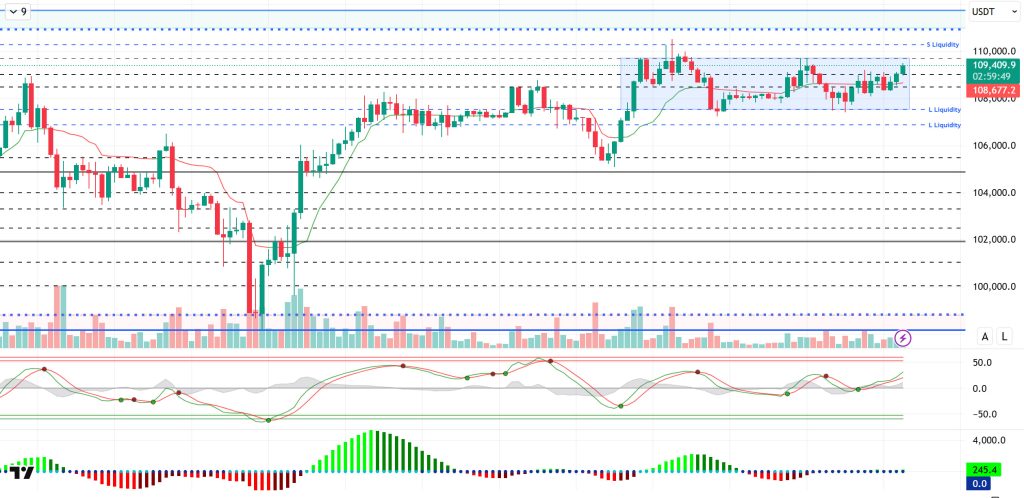
Looking at the technical picture, BTC continues to maintain its strong stance while continuing to move within the horizontal band range it formed near the ATH level. With low volatility and volume, the price, which was stuck within the 108,000 – 109,000 band during the day, has broken out of this band and is currently trading at the 109,400 level.
Technical indicators show that the Wave Trend (WT) is reversing its direction upward in the middle band of the channel with signs of weakening, while the histogram of the Squeeze Momentum (SM) indicator has moved into the positive zone, beginning to provide momentum support. The Kaufman moving average has crossed below the price level at 108.678, confirming the upward movement in the short term.
When examining short-term liquidity data, it can be seen that the selling level has intensified at 110,000. On the other hand, the buying level has thinned out at 107,000. In a broader time frame, it can be seen that the intensity of buy-side transactions continues at 106,600.
In conclusion, while fundamental developments continue to act as catalysts for pricing, a new catalyst may be needed for the uptrend to gain momentum after this stage. Technically, the short term supports upward movements, while liquidity data may reflect that upward price movements will take the form of liquidity purchases. In the event of a potential new upward movement, we will monitor closes above the 110,000 level as a reference point for an all-time high (ATH). On the other hand, in the event of a surprise selling pressure, the 106,600 level will be monitored as the nearest liquidity zone.
Supports 108,500 – 107,500 – 106,800
Resistances 109,000 – 110,000 – 111,000
ETH/USDT
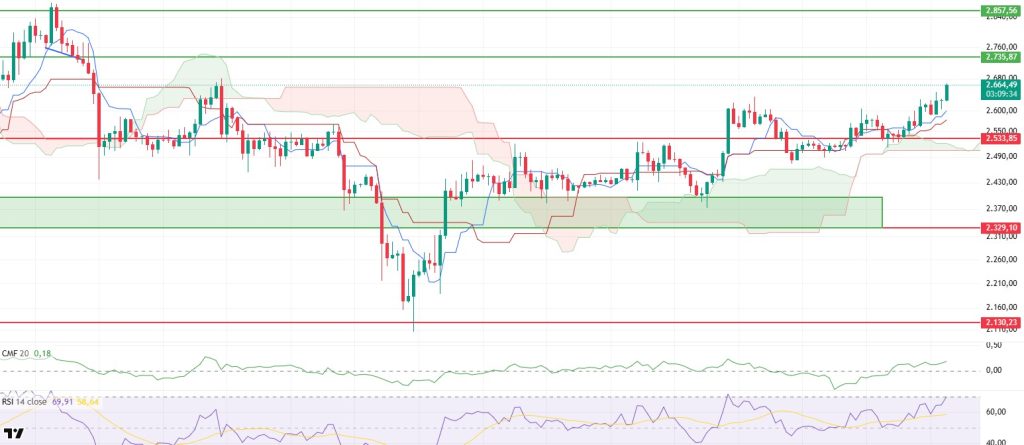
ETH continued its upward movement throughout the day, supported by positive signals from technical indicators, climbing above the $2,660 level. The absence of any negative divergence in the indicators during this rise indicates that price movements are healthy and that market participants are largely acting in unison. Positive trends in technical indicators also suggest that the upward momentum could persist into the evening hours.
Cumulative Volume Delta (CVD) data indicates that buyers are dominant in both the futures and spot markets. This structure, which points to continued buyer pressure, confirms the volume support behind the uptrend.
The Chaikin Money Flow (CMF) indicator also remains in positive territory, continuing its upward trend. This indicates that liquidity inflows into the market are continuing to increase and investor interest is intensifying. The increase in money inflows is a critical indicator not only for the short term but also for the continuity of the trend.
The Relative Strength Index (RSI) indicator rises to the overbought zone, clearly revealing the momentum in the market. While the RSI reaching this region reflects the strength of the upward trend, its presence in the overbought zone also brings the possibility of a short-term correction. Especially at such levels, profit-taking should be considered a common scenario.
On the Ichimoku indicator, the price moving above both the Tenkan and Kijun levels and settling above the Kumo cloud indicates that the overall structure remains positive and that the trend has the potential to continue upward. The price above the cloud forms a strong support structure in technical terms and indicates that buyers are in control.
When all this data is evaluated, there appears to be a strong possibility of movement toward the $2,735 level for ETH prices in the evening hours. However, considering the levels of the RSI indicator, the possibility of a limited correction in the short term should not be overlooked. In terms of the sustainability of the uptrend, it will be important for the price to continue its upward movement in a healthy manner with volume support.
Supporti 2.533 - 2.329 - 2.130
Resistenze 2.736 - 2.857 - 3.062
XRP/USDT
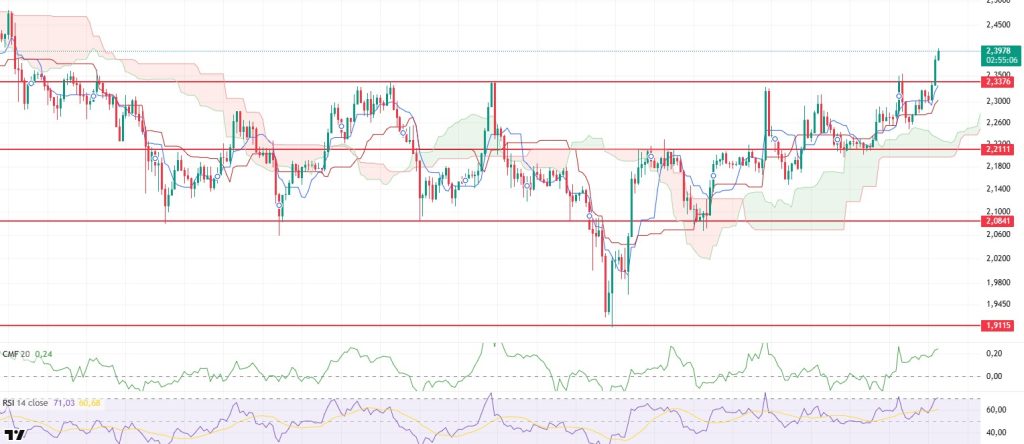
The XRP price broke through the strong resistance line at $2.3376, which it had been struggling to break for a long time, as expected, and rose to $2.40. Passing this technical level indicates that the upward price movement is gaining strength and that market participants’ buying trend is continuing.
The Relative Strength Index (RSI) indicator rising in parallel with price movements and reaching the overbought zone indicates strong momentum on the buy side. The RSI reaching these levels supports the notion that the upward movement is occurring on a technically strong foundation. However, entering the overbought zone also suggests that the market may pause for a brief period in the short term and that the risk of a correction could emerge.
The Chaikin Money Flow (CMF) indicator continues to remain in positive territory, moving within an upward channel. This structure indicates that there is increasing liquidity entering the market and that buyers remain active. The CMF’s persistence in positive territory suggests that the upward trend is supported by volume and that investor confidence remains intact.
When evaluating the overall outlook, if the XRP price manages to hold its support level at $2.33, it is likely that the upward movement will continue and gain momentum towards the $2.59 level. However, the possibility of a short-term correction should not be overlooked due to the RSI indicator reaching the overbought zone. In such a scenario, the $2.33 level will act as a critical support level, and it is important for the price not to fall below this level for the upward trend to continue in a healthy manner. As long as the price remains above this region, the overall technical structure may continue to maintain its positive trend.
Supports 2.3376 – 2.2111 – 2.0841
Resistances 2.5900 – 2.8347 – 3.1497
“
SOL/USDT
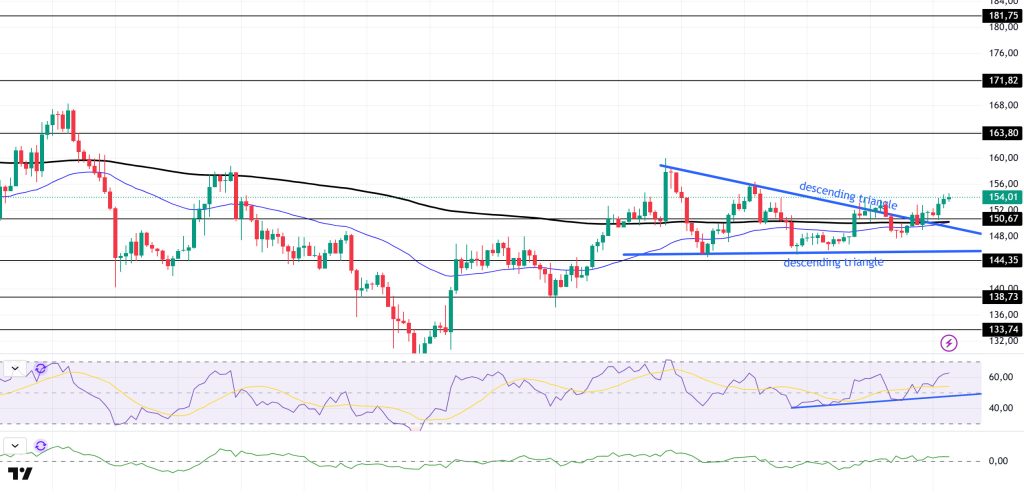
SOL price continued to rise during the day. The asset remained above the descending triangle formation and continued its upward momentum. If the upward momentum continues, the $163.80 level can be monitored.
On the 4-hour chart, the 50 EMA (Blue Line) remained below the 200 EMA (Black Line). This indicates that the downward trend may continue in the medium term. At the same time, the price being above both moving averages shows that the market is currently trending upward in the short term. Chaikin Money Flow (CMF-20) remained in positive territory; however, a decrease in money inflows could push CMF into negative territory. The Relative Strength Index (RSI-14) also remained in positive territory. Additionally, it continues to remain above the upward trend that began on Luglio 4. This could strengthen the upward movement. In the event of an upward movement due to positive macroeconomic data or news related to the Solana ecosystem, the $163.80 level emerges as a strong resistance point. If this level is broken upward, the upward movement is expected to continue. In the event of a pullback due to adverse developments or profit-taking, the 144.35 dollar level could be tested. A decline to these support levels could see an increase in buying momentum, potentially presenting an opportunity for an upward move.
Supporti 150,67 - 144,35 - 138,73
Resistenze 163,80 - 171,82 - 181,75
DOGE/USDT
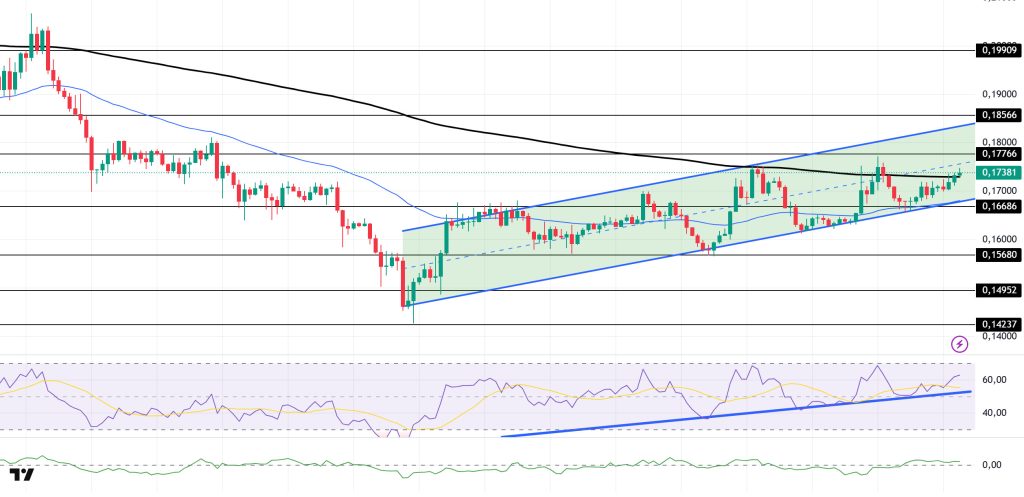
DOGE price rose during the day. The asset managed to stay above the 50 EMA (Blue Line) moving average and is currently testing the 200 EMA (Black Line) moving average as resistance. If the price continues to rise while remaining within the descending flag formation and closes above the formation, the 0.18566 dollar level could be targeted. Otherwise, the bottom level of the descending flag formation should be monitored.
On the 4-hour chart, the 50 EMA (blue line) remains below the 200 EMA (black line). This indicates that the asset is in a downward trend in the medium term. The price being above both moving averages indicates that the asset is in an upward trend in the short term. Chaikin Money Flow (CMF-20) remains in positive territory. Additionally, positive cash inflows could push the CMF to higher levels in the positive zone. The Relative Strength Index (RSI-14) is in the middle of the positive zone and has continued to remain above the upward trend that began on Giugno 22, supported by that trend. At the same time, buying pressure has formed, which could trigger an upward movement. In the event of an upward movement driven by political developments, macroeconomic data, or positive news flow within the DOGE ecosystem, the $0.17766 level emerges as a strong resistance zone. In the opposite scenario or in the event of negative news flow, the 0.16686 dollar level could be triggered. A decline to these levels could increase momentum and potentially initiate a new upward wave.
Supports 0.16686 – 0.15680 – 0.14952
Resistance levels 0.17766 – 0.18566 – 0.19909
Avviso legale
Le informazioni sugli investimenti, i commenti e le raccomandazioni contenute nel presente documento non costituiscono una consulenza sugli investimenti. I servizi di consulenza sugli investimenti sono forniti individualmente da istituzioni autorizzate che tengono conto delle preferenze di rischio e di rendimento dei singoli individui. I commenti e le raccomandazioni contenuti nel presente documento sono di natura generale. Tali raccomandazioni potrebbero non essere adatte alla vostra situazione finanziaria e alle vostre preferenze di rischio e rendimento. Pertanto, prendere una decisione di investimento basandosi esclusivamente sulle informazioni contenute nel presente documento potrebbe non produrre risultati in linea con le vostre aspettative.

