
Analisi tecnica
ETH/USDT
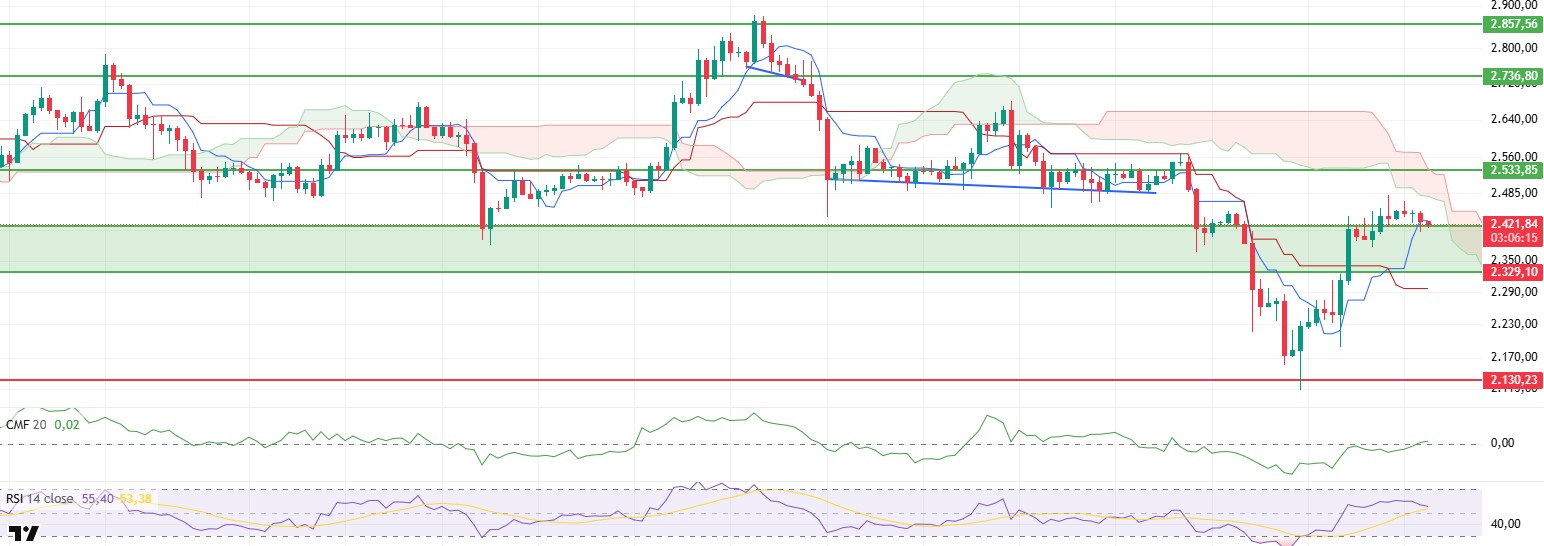
ETH experienced a slight pullback during the day in line with the technical outlook in the morning hours and the price dropped to the level of $ 2,405. From this level, with the limited entry of buyers, the price started to recover again and rose above the $2,420 level. Although this movement gives the first signals that the decline may be limited in the short term, the picture read through technical indicators offers mixed signals.
In particular, the Chaikin Money Flow (CMF) indicator has moved out of the negative zone and into the positive zone, indicating that the liquidity inflow in the market has started again and the buy side has started to gain dominance. This suggests that the price is not under strong selling pressure despite the pullbacks and that the appetite for buying continues in the short term.
However, when the Ichimoku Cloud is analyzed, although the upward trend of the tenkan level in particular produces a positive signal, the fact that the price is still trading in the lower band of the kumo cloud indicates that the current rise may be limited and that there are still fragilities in the market structure. This picture suggests that price movements may be uncertain, especially in the short term, and that the search for direction continues.
In addition, the Relative Strength Index (RSI) indicator still exhibits a bearish bias, providing clear signs that momentum has started to weaken. This trend of the RSI reveals that despite the price’s bullish efforts, there is not enough strength in the internal dynamics yet, especially that volume and momentum support is needed for the upside breakouts to be permanent.
In general terms, the fact that the price failed to exceed the $2,480 level in the evening hours and continued to remain below this resistance suggests that upside attempts may be limited in the short term and the price may come under pressure again and experience slight pullbacks. Therefore, the $2,480 level is not only a short-term resistance but also a critical threshold that will determine the direction of the market. A break of this level to the upside would be a strong signal that buyers are gaining strength more clearly and the bullish move could gain momentum.
Supporti 2.329 - 2.130 - 2.029
Resistenze 2.533 - 2.736 - 2.857
XRP/USDT
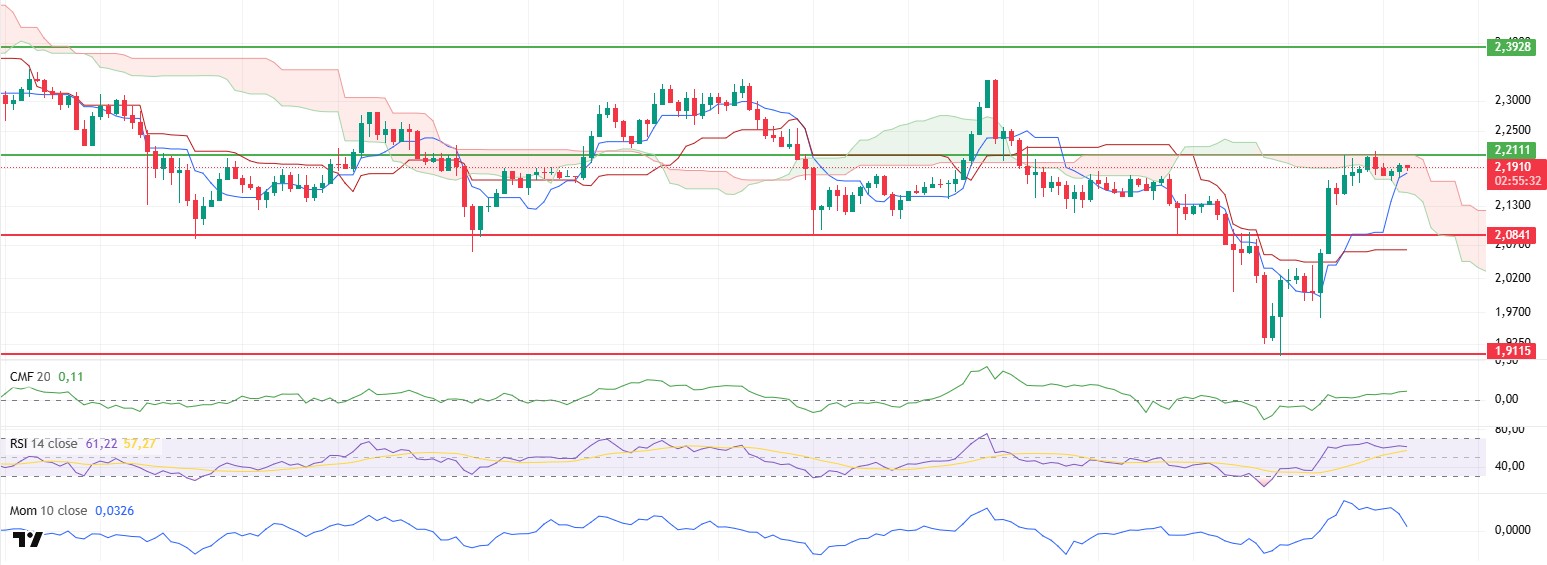
XRP remained sideways in a narrow price range during the day and managed to stay above the tenkan level momentarily during this process, and although it shows that the price has a supportive structure in the short term, the overall technical outlook contains some indecision signals. Technical indicators suggest that the market is still buyer-oriented and the upside potential remains intact.
While the Chaikin Money Flow (CMF) indicator remains in positive territory, the upward slope of the indicator indicates that capital inflows within the market are still ongoing and the buy side remains dominant. This outlook suggests that the price is resilient to pullbacks in the short term and does not allow demand to sag below a certain threshold. However, other indicators do not fully support this positive picture.
Although the Relative Strength Index (RSI) is moving horizontally above the based moving average (MA) line, there is no upward momentum in the indicator. The fact that the momentum has started to weaken suggests that the intrinsic strength required for a steady upward price action is not yet at a sufficient level. This horizontal and weakening structure in the RSI indicates that buyers are becoming indecisive and that the price may become vulnerable to the downside in the event of a possible volume decline.
Looking at the overall structure of the Ichimoku indicator, the price tested the upper band of the kumo cloud but failed to break through this level. This suggests that technically, the current levels are working as resistance zones and the possibility of the price returning from these levels is on the table. In particular, the failure to break through the upper cloud band suggests that the upside may remain limited and a potential correction may be on the agenda in the short term.
As a result, if XRP continues to stay below the $2.21 level, short-term technical pullbacks are likely. However, if this level is broken upwards and the price is sustained above it, it may pave the way for the buyer side to regain clear strength in the market and the bullish movement to gain momentum.
Supports 2.0841 – 1.9115 – 1.7226
Resistances 2.2111 – 2.3928 – 2.5900
SOL/USDT
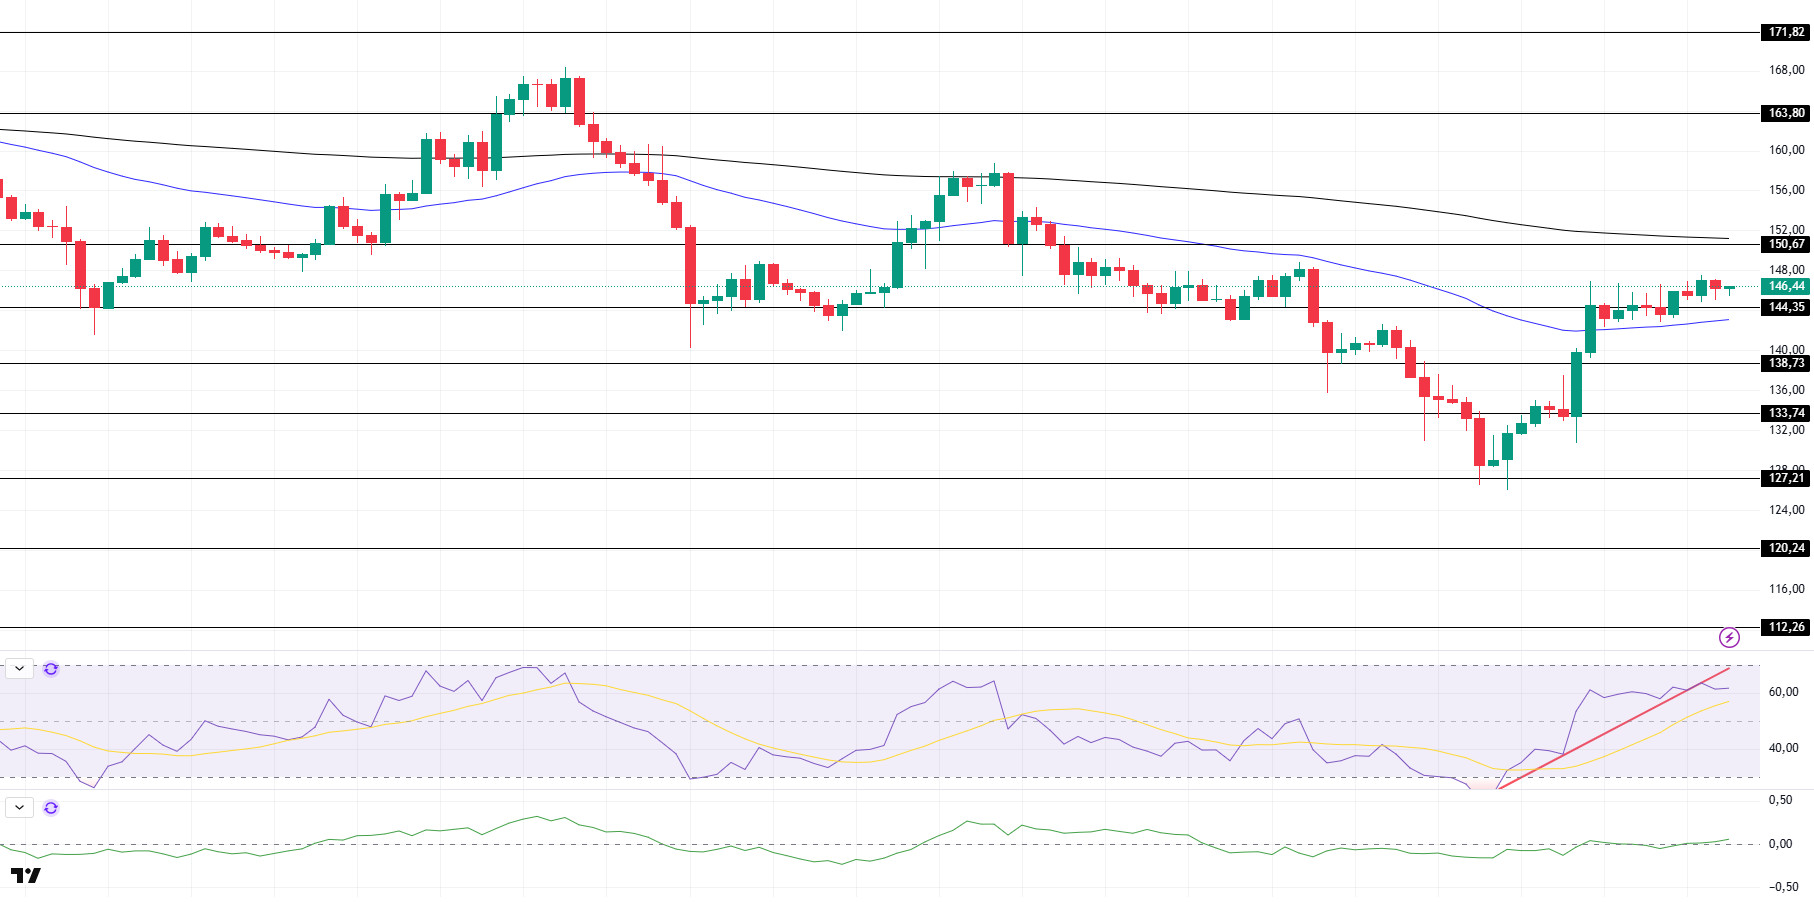
SOL price continued its sideways movement during the day. The asset remains above the strong support level of $144.35 and the 50 EMA (Blue Line) moving average. If the upward movement continues, it may test the 200 EMA (Black Line) moving average as resistance. Candle closes below the $144.35 level could see a pullback.
On the 4-hour chart, the 50 EMA continued to be below the 200 EMA. This suggests that the bearish trend may continue in the medium term. At the same time, the fact that the price is between both moving averages suggests that the market is currently in a short-term decision-making phase. Chaikin Money Flow (CMF-20) moved into positive territory; in addition, a decline in inflows could move CMF into negative territory. Relative Strength Index (RSI-14) continued to move at the mid-point of the positive zone. However, selling pressure has emerged. On the other hand, it also broke the uptrend that started on Giugno 22 to the downside. This may bring a decline. In case of an uptrend due to macroeconomic data or positive news about the Solana ecosystem, the $150.67 level stands out as a strong resistance point. If this level is broken upwards, the rise can be expected to continue. If there are pullbacks due to contrary developments or profit realizations, the $ 138.73 level may be tested. In case of a decline to these support levels, the increase in buying momentum may offer a potential bullish opportunity.
Supports 144.35 – 138.73 – 133.74
Resistances 150.67 – 163.80 – 171.82
DOGE/USDT
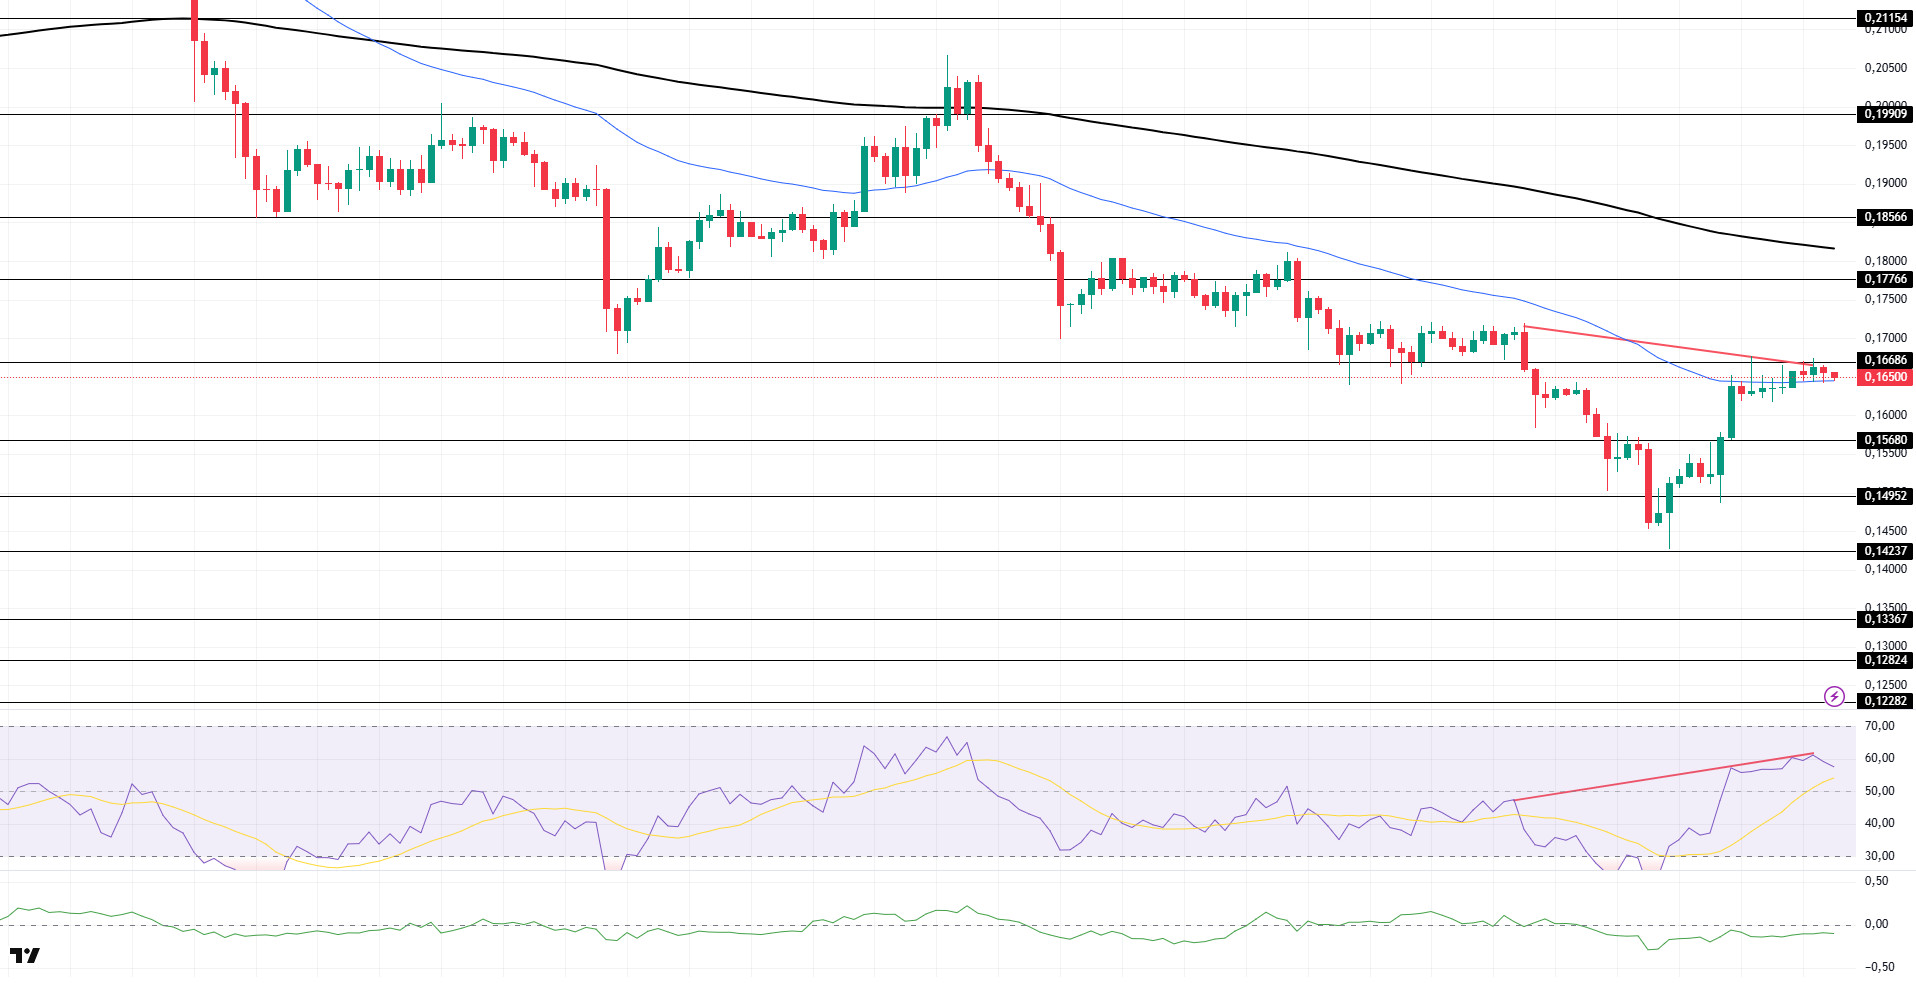
DOGE price continued to move sideways during the day. The asset, which hit strong resistance at $0.16686, failed to break it and is currently testing the 50 EMA (Blue Line) moving average as support. If the price accelerates upwards and closes candles above the $0.16686 level, it may test the $0.17766 level.
On the 4-hour chart, the 50 EMA (Blue Line) continues to be below the 200 EMA (Black Line). This suggests that the asset is bearish in the medium term. The fact that the price is between two moving averages suggests that the asset is in the decision phase in the short term. Chaikin Money Flow (CMF-20) remained in negative territory. In addition, negative money inflows may push CMF deeper into negative territory. Relative Strength Index (RSI-14) remained in positive territory. However, selling pressure has emerged. However, there is a bearish mismatch. These may be bearish. In the case of possible rises in line with political developments, macroeconomic data or positive news flow in the DOGE ecosystem, the $0.16686 level stands out as a strong resistance zone. In the opposite situation or possible negative news flow, the $ 0.15680 level may be triggered. In case of a decline to these levels, the momentum may increase and a new bullish wave may start.
Supports 0.15680 – 0.14952 – 0.14237
Resistances 0.16686 – 0.17766 – 0.18566
Avviso legale
Le informazioni sugli investimenti, i commenti e le raccomandazioni contenute nel presente documento non costituiscono una consulenza sugli investimenti. I servizi di consulenza sugli investimenti sono forniti individualmente da istituzioni autorizzate che tengono conto delle preferenze di rischio e di rendimento dei singoli individui. I commenti e le raccomandazioni contenuti nel presente documento sono di natura generale. Tali raccomandazioni potrebbero non essere adatte alla vostra situazione finanziaria e alle vostre preferenze di rischio e rendimento. Pertanto, prendere una decisione di investimento basandosi esclusivamente sulle informazioni contenute nel presente documento potrebbe non produrre risultati in linea con le vostre aspettative.

