Introduction
We have left behind a year in which the impact of macroeconomic and geopolitical events on financial markets was clearly felt. The inflation-interest rate balance, growth expectations, and political uncertainties at the global level formed the main agenda of the markets. Under these conditions, volatility remained high across many asset classes. In particular, interest rate decisions and political decisions in the US increased market volatility throughout the year. Furthermore, with the start of a new presidential term in the US, trade policies, tariffs, and global economic relations remained constantly on the agenda. During this period, risk appetite fluctuated periodically, and no lasting trend emerged in the markets.
In this environment, precious metals performed strongly, while US stock markets ended the year on a positive note with a more balanced and stable outlook. New highs were seen in the cryptocurrency market, but accelerating selling pressure in the final quarter of the year led to a negative close for the year.
The tables in the report were prepared using data from CryptoQuant, the Federal Reserve Bank of St. Louis, and GoldPrice. Opening levels refer to end-2024 closing values, while monthly tables show end-of-month closes in 2025
2025 Asset Performance
When examining the annual performance of selected assets based on their values at the beginning and end of 2025:
Table 1 – 2025 Asset Performance
| Asset | Opening Level | Closing Level | Change (%) |
|---|---|---|---|
| Bitcoin (BTC) | $93,385 | $87,823 | -5.96% |
| Ethereum (ETH) | $3,331 | $2,967 | -10.93% |
| Solana (SOL) | $189 | $124 | -34.12% |
| XRP | $2.08 | $1.84 | -11.54% |
| Gold (USD/oz) | 2,607 | 4,340 | 66.47% |
| Silver (USD/oz) | 28.94 | 75.24 | 159.99% |
| S&P 500 | 5,882 | 6,846 | 16.39% |
| Nasdaq 100 | 21,012 | 25,250 | 20.17% |
| Dow Jones | 42,544 | 48,063 | 12.97% |
Looking at the table, silver clearly delivered the strongest performance in 2025, followed by gold. While US stock markets posted double-digit gains, led by technology stocks.
Although major crypto assets reached new highs during the year, intensified sell-offs in the final quarter led them to close 2025 in negative territory. Solana’s decline of over 34% clearly demonstrated the pressure on altcoins during periods of risk aversion.
2025 Bitcoin vs. Other Assets Comparison
In this section, we will compare Bitcoin’s performance with other crypto assets such as Ethereum, Solana, and XRP, as well as gold, silver, and U.S. stock indices.
BTC-ETH Comparison
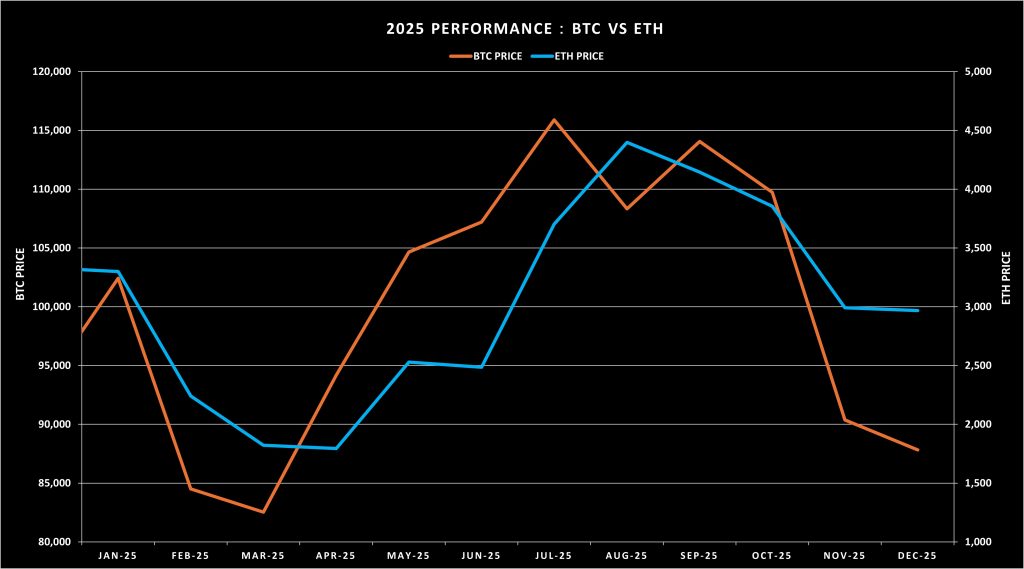
Bitcoin showed more resilient performance compared to Ethereum throughout the year. Although both coins reached all-time highs during the year, Bitcoin ended the year with a 5.96% loss in value, while Ethereum’s loss was 10.93%. This divergence stemmed from Ethereum’s higher volatility compared to Bitcoin and its tendency to move more aggressively during uptrends, yet it failed to sustain this momentum, particularly in the final quarter of the year.
Source: Prepared by Darkex Research Department using CryptoQuant data.
Table 2 – 2025 BTC and ETH Performance
| Datetime | BTC Price ($) | BTC Change | ETH Price ($) | ETH Change |
|---|---|---|---|---|
| Jan-25 | 102,416 | 9.67% | 3,300 | -0.92% |
| Feb-25 | 84,501 | -17.49% | 2,241 | -32.10% |
| Mar-25 | 82,535 | -2.33% | 1,822 | -18.69% |
| Apr-25 | 94,180 | 14.11% | 1,794 | -1.55% |
| May-25 | 104,645 | 11.11% | 2,529 | 41.00% |
| Jun-25 | 107,210 | 2.45% | 2,486 | -1.70% |
| Jul-25 | 115,899 | 8.10% | 3,703 | 48.95% |
| Aug-25 | 108,325 | -6.54% | 4,398 | 18.77% |
| Sep-25 | 114,051 | 5.29% | 4,145 | -5.75% |
| Oct-25 | 109,726 | -3.79% | 3,854 | -7.04% |
| Nov-25 | 90,366 | -17.64% | 2,991 | -22.37% |
| Dec-25 | 87,823 | -2.81% | 2,967 | -0.82% |
| 2025 Total Change | -5,562 | -5.96% | -364 | -10.93% |
Although Ethereum experienced strong periods of growth, volatility-driven declines limited the sustainability of this performance. Bitcoin, on the other hand, experienced more limited losses during periods of decline due to its more stable price structure compared to Ethereum.
BTC-SOL Comparison
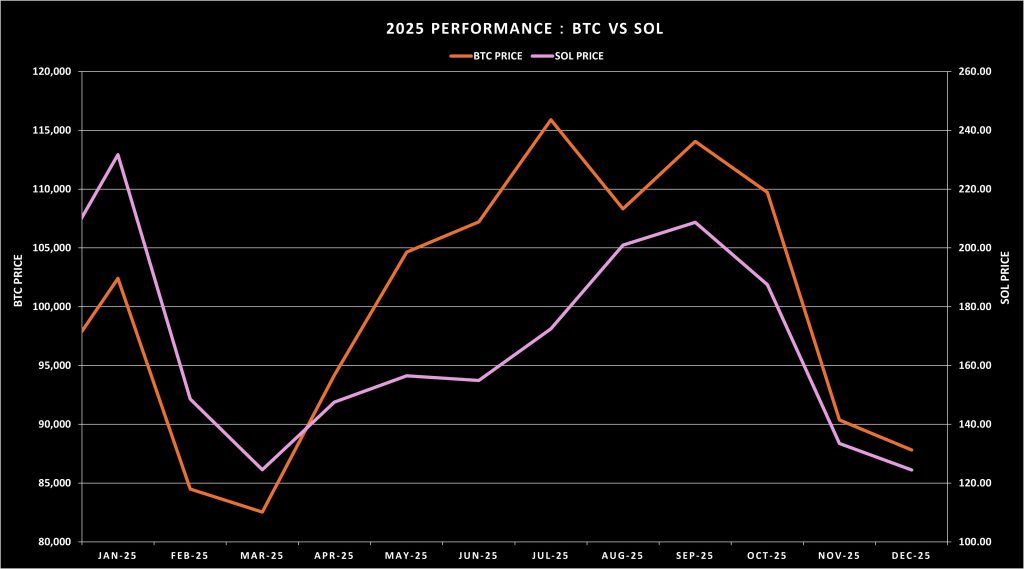
During periods of increased risk appetite, Solana showed much faster increases than Bitcoin. It stood out with double-digit increases in some months. However, these movements were often not sustainable. The declines following sharp increases showed that volatility remained high on the Solana side, while Bitcoin maintained its more balanced price structure.
Source: Prepared by the Darkex Research Department using CryptoQuant data.
Table 3 – 2025 BTC and SOL Performance
| Datetime | BTC Price ($) | BTC Change | SOL Price ($) | SOL Change |
|---|---|---|---|---|
| Jan-25 | 102,416 | 9.67% | 232 | 22.66% |
| Feb-25 | 84,501 | -17.49% | 149 | -35.88% |
| Mar-25 | 82,535 | -2.33% | 125 | -16.20% |
| Apr-25 | 94,180 | 14.11% | 148 | 18.50% |
| May-25 | 104,645 | 11.11% | 156 | 6.06% |
| Jun-25 | 107,210 | 2.45% | 155 | -1.00% |
| Jul-25 | 115,899 | 8.10% | 172 | 11.32% |
| Aug-25 | 108,325 | -6.54% | 201 | 16.51% |
| Sep-25 | 114,051 | 5.29% | 209 | 3.85% |
| Oct-25 | 109,726 | -3.79% | 187 | -10.15% |
| Nov-25 | 90,366 | -17.64% | 133 | -28.80% |
| Dec-25 | 87,823 | -2.81% | 124 | -6.76% |
| 2025 Total Change | -5,562 | -5.96% | -64 | -34.12% |
The sharp corrections experienced by Solana deepened the total loss, causing it to end the year with a 34.12% decline. This table shows that Bitcoin played a more resilient and stabilizing role during periods of risk aversion, while Solana exhibited a more fragile performance due to its high volatility.
BTC-XRP Comparison
XRP exhibited much sharper and more abrupt price movements compared to Bitcoin throughout the year. The strong rallies seen particularly in January and July highlighted XRP’s high dependence on news flow and market sentiment. However, these rallies failed to translate into a sustained trend. Price movements quickly reversed direction, generating high volatility.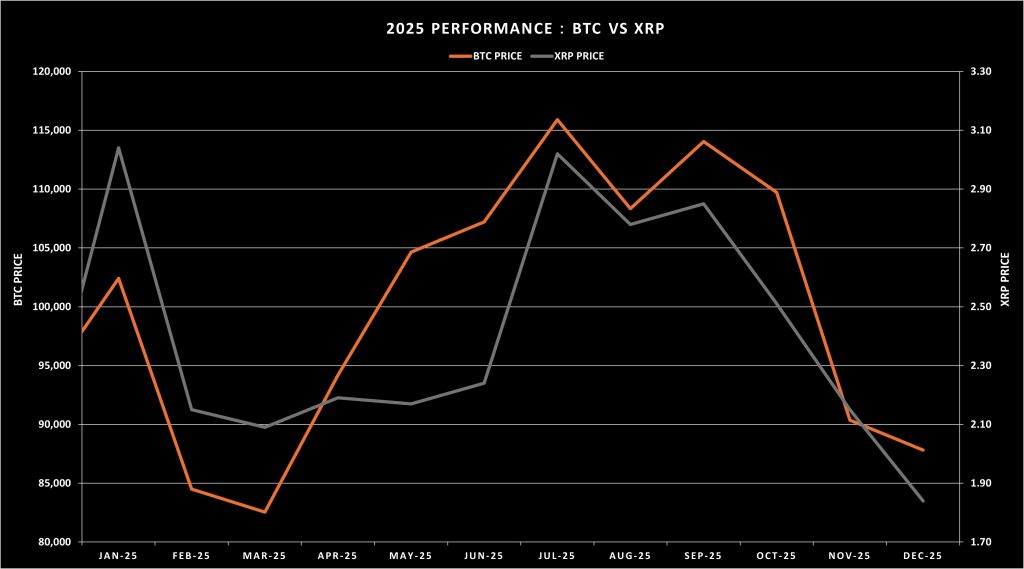
Source: Prepared by Darkex Research Department using CryptoQuant data.
Table 4 – 2025 BTC and XRP Performance
| Datetime | BTC Price ($) | BTC Change (%) | XRP Price ($) | XRP Change (%) |
|---|---|---|---|---|
| Jan-25 | 102,416 | 9.67% | 3.04 | 45.87% |
| Feb-25 | 84,501 | -17.49% | 2.15 | -29.28% |
| Mar-25 | 82,535 | -2.33% | 2.09 | -2.64% |
| Apr-25 | 94,180 | 14.11% | 2.19 | 4.83% |
| May-25 | 104,645 | 11.11% | 2.17 | -0.79% |
| Jun-25 | 107,210 | 2.45% | 2.24 | 2.87% |
| Jul-25 | 115,899 | 8.10% | 3.02 | 35.12% |
| Aug-25 | 108,325 | -6.54% | 2.78 | -8.11% |
| Sep-25 | 114,051 | 5.29% | 2.85 | 2.52% |
| Oct-25 | 109,726 | -3.79% | 2.51 | -11.84% |
| Nov-25 | 90,366 | -17.64% | 2.15 | -14.13% |
| Dec-25 | 87,823 | -2.81% | 1.84 | -14.57% |
| 2025 Total Change | -5,562 | -5.96% | -0.24 | -11.54% |
Increased selling pressure in the second half of the year, particularly in the last quarter, caused XRP to give back most of its gains. XRP ended the year down 11.54%. This demonstrated that Bitcoin offered a more balanced and stable price structure compared to XRP.
BTC-Gold Comparison
One of the clearest divergences emerged between gold and Bitcoin. Gold ended the year with a 66.48% increase in value. This picture showed that investors, seeking to avoid risk amid increasing uncertainty throughout the year, turned primarily to traditional assets.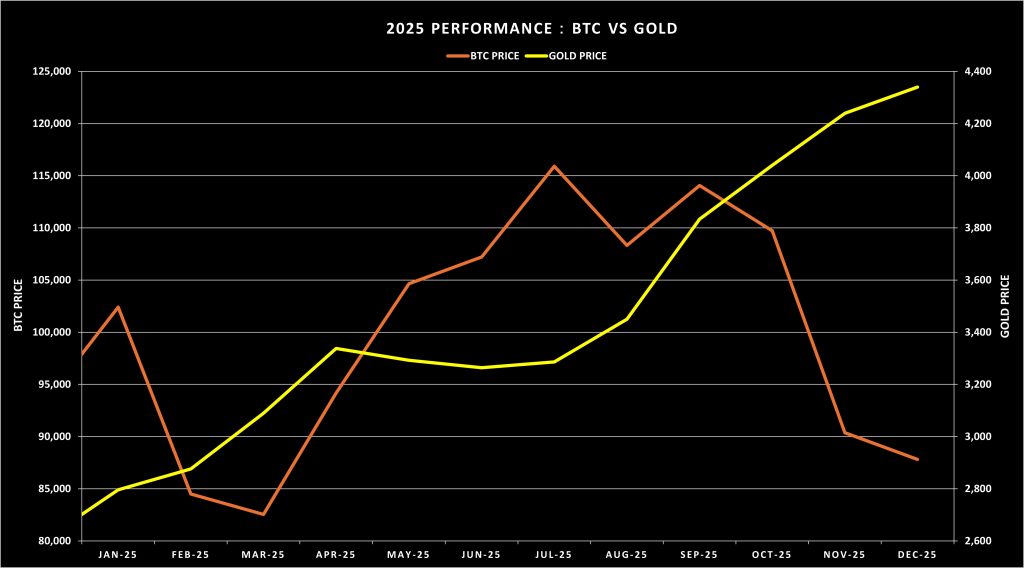
Source: Prepared by Darkex Research Department using data from GoldPrice and CryptoQuant.
Table 5 – 2025 BTC and Gold Performance
| Datetime | BTC Price ($) | BTC Change (%) | Gold Price ($) | Gold Change (%) |
|---|---|---|---|---|
| Jan-25 | 102,416 | 9.67% | 2,796 | 7.27% |
| Feb-25 | 84,501 | -17.49% | 2,876 | 2.85% |
| Mar-25 | 82,535 | -2.33% | 3,090 | 7.43% |
| Apr-25 | 94,180 | 14.11% | 3,338 | 8.04% |
| May-25 | 104,645 | 11.11% | 3,292 | -1.38% |
| Jun-25 | 107,210 | 2.45% | 3,264 | -0.85% |
| Jul-25 | 115,899 | 8.10% | 3,286 | 0.66% |
| Aug-25 | 108,325 | -6.54% | 3,450 | 4.99% |
| Sep-25 | 114,051 | 5.29% | 3,833 | 11.12% |
| Oct-25 | 109,726 | -3.79% | 4,040 | 5.41% |
| Nov-25 | 90,366 | -17.64% | 4,239 | 4.91% |
| Dec-25 | 87,823 | -2.81% | 4,340 | 2.39% |
| 2025 Total Change | -5,562 | -5.96% | 1,733 | 66.48% |
Gold stood out with a more stable demand structure throughout the year and served as a balancing asset for investors in volatile market conditions.
BTC-Silver Comparison
Silver clearly stood out from Bitcoin and many other assets with its strong performance throughout the year. By year-end, the silver price had increased by 159.99%. This table shows that silver saw strong demand throughout the year thanks to both its precious metal qualities and industrial usage expectations.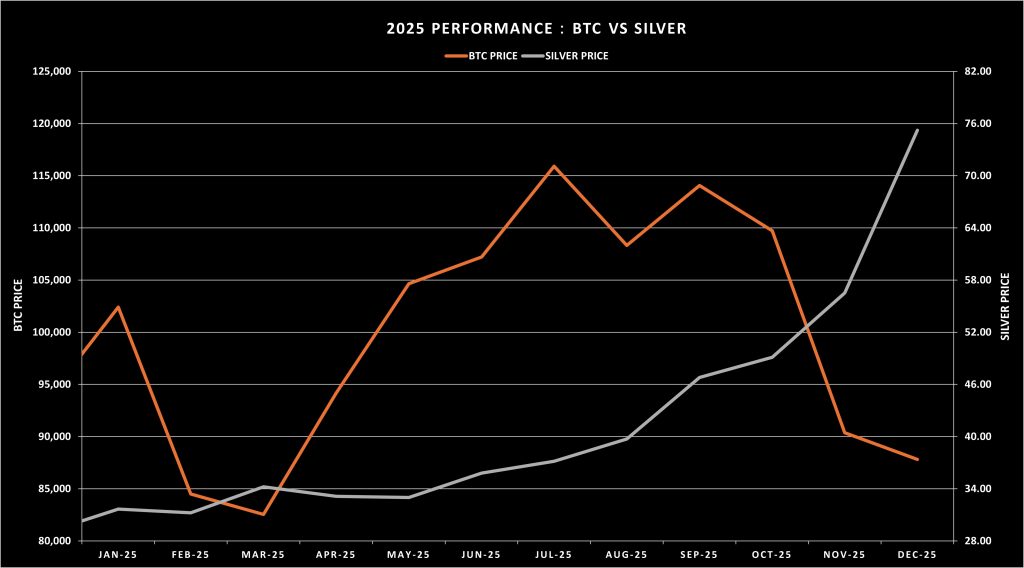
Source: Darkex Research Department – Prepared using data from Gold Price and CryptoQuant.
Table 6 – 2025 BTC and Silver Performance
| Datetime | BTC Price ($) | BTC Change (%) | Silver Price ($) | Silver Change (%) |
|---|---|---|---|---|
| Jan-25 | 102,416 | 9.67% | 32 | 9.43% |
| Feb-25 | 84,501 | -17.49% | 31 | -1.39% |
| Mar-25 | 82,535 | -2.33% | 34 | 9.57% |
| Apr-25 | 94,180 | 14.11% | 33 | -3.21% |
| May-25 | 104,645 | 11.11% | 33 | -0.36% |
| Jun-25 | 107,210 | 2.45% | 36 | 8.45% |
| Jul-25 | 115,899 | 8.10% | 37 | 3.80% |
| Aug-25 | 108,325 | -6.54% | 40 | 6.92% |
| Sep-25 | 114,051 | 5.29% | 47 | 17.85% |
| Oct-25 | 109,726 | -3.79% | 49 | 4.91% |
| Nov-25 | 90,366 | -17.64% | 57 | 15.09% |
| Dec-25 | 87,823 | -2.81% | 75 | 33.12% |
| 2025 Total Change | -5,562 | -5.96% | 46 | 159.99% |
On the Bitcoin side, the peaks seen during the year were not sustainable, and selling pressure intensified, particularly in the last quarter of the year, as risk aversion increased. This process further highlighted the performance gap between Bitcoin and silver.
Silver emerged as one of the leading alternative assets for investors in 2025.
BTC-S&P 500 Comparison
The S&P 500 index ended 2025 with a 16.39% increase in value. With its broad sector distribution, the S&P 500 performed more consistently throughout the year despite volatile market conditions and showed a steady upward trend.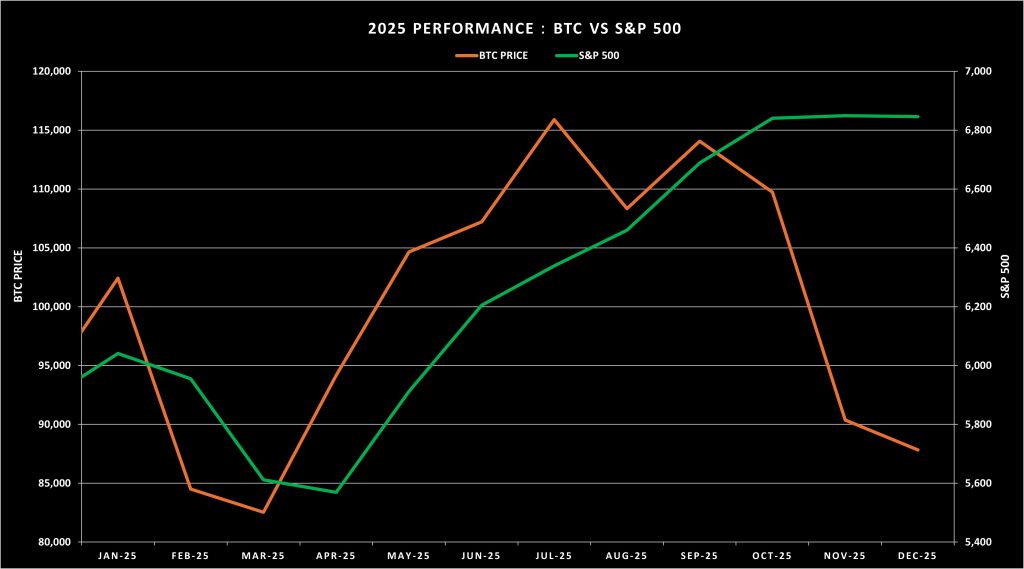
Source: Prepared by Darkex Research Department using data from the Federal Reserve Bank of St. Louis and CryptoQuant.
Table 7 – 2025 BTC and S&P 500 Performance
| Datetime | BTC Price ($) | BTC Change (%) | S&P 500 Level | S&P 500 Change (%) |
|---|---|---|---|---|
| Jan-25 | 102,416 | 9.67% | 6,041 | 2.70% |
| Feb-25 | 84,501 | -17.49% | 5,955 | -1.42% |
| Mar-25 | 82,535 | -2.33% | 5,612 | -5.75% |
| Apr-25 | 94,180 | 14.11% | 5,569 | -0.76% |
| May-25 | 104,645 | 11.11% | 5,912 | 6.15% |
| Jun-25 | 107,210 | 2.45% | 6,205 | 4.96% |
| Jul-25 | 115,899 | 8.10% | 6,339 | 2.17% |
| Aug-25 | 108,325 | -6.54% | 6,460 | 1.91% |
| Sep-25 | 114,051 | 5.29% | 6,688 | 3.53% |
| Oct-25 | 109,726 | -3.79% | 6,840 | 2.27% |
| Nov-25 | 90,366 | -17.64% | 6,849 | 0.13% |
| Dec-25 | 87,823 | -2.81% | 6,846 | -0.05% |
| 2025 Total Change | -5,562 | -5.96% | 964 | 16.39% |
On the Bitcoin side, high volatility caused sharp price movements throughout the year. Losses became more pronounced, especially during periods of decline. In 2025, the S&P 500 offered a more predictable and stable performance compared to Bitcoin.
BTC-Nasdaq 100 Comparison
The Nasdaq 100 index ended 2025 with a 20.17% increase in value, led by technology stocks. Strong growth expectations and demand for technology-focused companies enabled the Nasdaq 100 to show a steady rise throughout the year.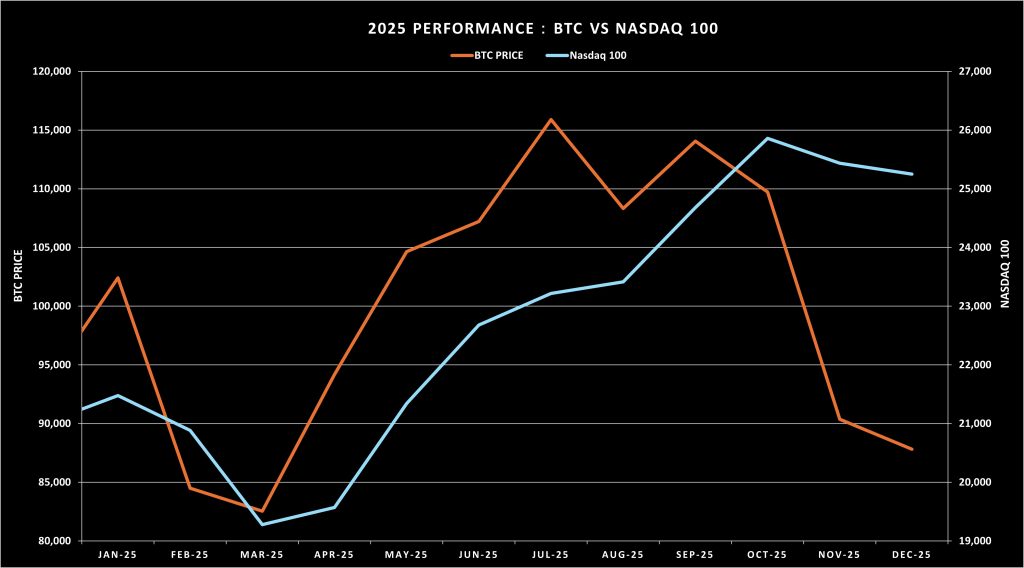
Source: Prepared by Darkex Research Department using data from the Federal Reserve Bank of St. Louis and CryptoQuant.
Table 8 – 2025 BTC and Nasdaq 100 Performance
| Date | BTC Price ($) | BTC Change (%) | Nasdaq 100 Level | Nasdaq 100 Change (%) |
|---|---|---|---|---|
| Jan-25 | 102,416 | 9.67% | 21,478 | 2.22% |
| Feb-25 | 84,501 | -17.49% | 20,884 | -2.76% |
| Mar-25 | 82,535 | -2.33% | 19,278 | -7.69% |
| Apr-25 | 94,180 | 14.11% | 19,571 | 1.52% |
| May-25 | 104,645 | 11.11% | 21,341 | 9.04% |
| Jun-25 | 107,210 | 2.45% | 22,679 | 6.27% |
| Jul-25 | 115,899 | 8.10% | 23,218 | 2.38% |
| Aug-25 | 108,325 | -6.54% | 23,415 | 0.85% |
| Sep-25 | 114,051 | 5.29% | 24,680 | 5.40% |
| Oct-25 | 109,726 | -3.79% | 25,858 | 4.77% |
| Nov-25 | 90,366 | -17.64% | 25,435 | -1.64% |
| Dec-25 | 87,823 | -2.81% | 25,250 | -0.73% |
| 2025 Total Change | -5,562 | -5.96% | 4,238 | 20.17% |
This comparison shows that growth-oriented investment preferences in 2025 created stronger performance in technology stocks compared to Bitcoin.
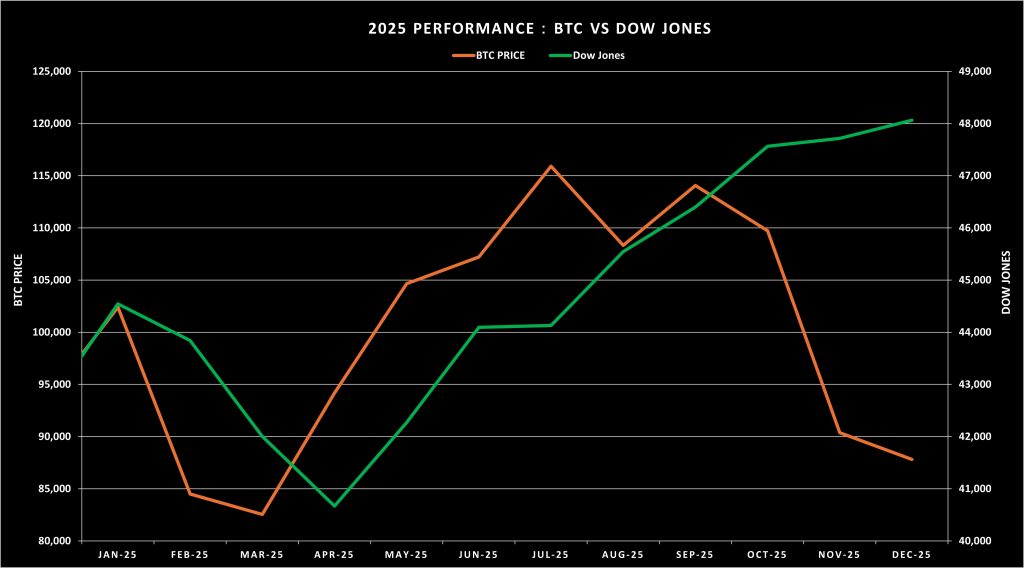
BTC–Dow Jones Comparison
The Dow Jones index, with its structure representing more traditional sectors, ended 2025 with a 12.97% increase in value. The relatively low volatility observed in the Dow Jones throughout the year enabled the index to exhibit a more controlled and stable price movement compared to Bitcoin.
 “
“
Source: Prepared by the Darkex Research Department using data from the Federal Reserve Bank of St. Louis and CryptoQuant.
Table 9 – 2025 BTC and Dow Jones Performance
| Date | BTC Price ($) | BTC Change (%) | Dow Jones Level | Dow Jones Change (%) |
|---|---|---|---|---|
| Jan-25 | 102,416 | 9.67% | 44,545 | 4.70% |
| Feb-25 | 84,501 | -17.49% | 43,841 | -1.58% |
| Mar-25 | 82,535 | -2.33% | 42,002 | -4.20% |
| Apr-25 | 94,180 | 14.11% | 40,669 | -3.17% |
| May-25 | 104,645 | 11.11% | 42,270 | 3.94% |
| Jun-25 | 107,210 | 2.45% | 44,095 | 4.32% |
| Jul-25 | 115,899 | 8.10% | 44,131 | 0.08% |
| Aug-25 | 108,325 | -6.54% | 45,545 | 3.20% |
| Sep-25 | 114,051 | 5.29% | 46,398 | 1.87% |
| Oct-25 | 109,726 | -3.79% | 47,563 | 2.51% |
| Nov-25 | 90,366 | -17.64% | 47,716 | 0.32% |
| Dec-25 | 87,823 | -2.81% | 48,063 | 0.73% |
| 2025 Total Change | -5,562 | -5.96% | 5,519 | 12.97% |
This comparison shows that traditional stock indices offered a more balanced performance compared to Bitcoin in 2025.
Overall Assessment and 2026 Forecast
When evaluating the year as a whole, we see that the strongest gains were in silver. This rise was largely driven by industrial demand, supported by individual investor demand amid increasing geopolitical and political risks. Gold, as always during periods of uncertainty, remained one of the indispensable instruments in investor portfolios.
However, it is important to note the following. Gold is an asset that can be quickly liquidated in times of need or when portfolios are being reshaped. Therefore, if current uncertainties ease and risk appetite increases, it is likely that a significant portion of this liquidity will shift toward relatively riskier assets.
Furthermore, considering the upcoming change in the chairmanship of the US Federal Reserve (Fed) and Donald Trump’s statements, expectations that a more dovish chairman may be appointed regarding interest rate cuts have generated market excitement. This situation strengthens expectations of increased liquidity inflows and supports continued upside potential for financial assets.
However, it should not be forgotten that financial markets are not composed of a single variable. Questions about which asset classes the injected liquidity will flow into and which sectors will benefit most may frequently arise.
As of 2026, market uncertainties have not completely disappeared. The US’s political stance toward Venezuela and ongoing global geopolitical issues may continue to support pricing in precious metals. In this process, continued demand for safe havens will keep upward risks on the agenda, particularly for gold and silver.
On the other hand, when Donald Trump’s rhetoric and economic policies are examined, his pro-technology and industrial manufacturing stance may help maintain positive expectations in stock markets.
In the cryptocurrency market, the main performance drivers will continue to be regulatory clarity, institutional investor interest, and global liquidity conditions.
Disclaimer
This content is for informational purposes only and does not constitute investment, financial, or legal advice. Market views and opinions are general in nature and may not be suitable for all investors. Always conduct your own research and consult qualified professionals before making investment decisions.