Technical Analysis
BTC/USDT
Genius Group announced it will distribute Bitcoin worth $0.10 per share to incentivize long-term investors. To receive the reward, shareholders must transfer their shares to VStock and hold them for six months. CEO Roger Hamilton stated that the plan aims to prevent shares from being lent to short sellers. This week, $60 billion worth of Bitcoin and Ethereum options are expiring. According to Deribit data, the maximum pain point for Bitcoin is at the $114,000 level. State Street reported that investors are overly confident in risky assets and that outflows from bonds are accelerating. MicroStrategy founder Michael Saylor said MetaPlanet will become Japan’s most valuable company with its Bitcoin strategy.
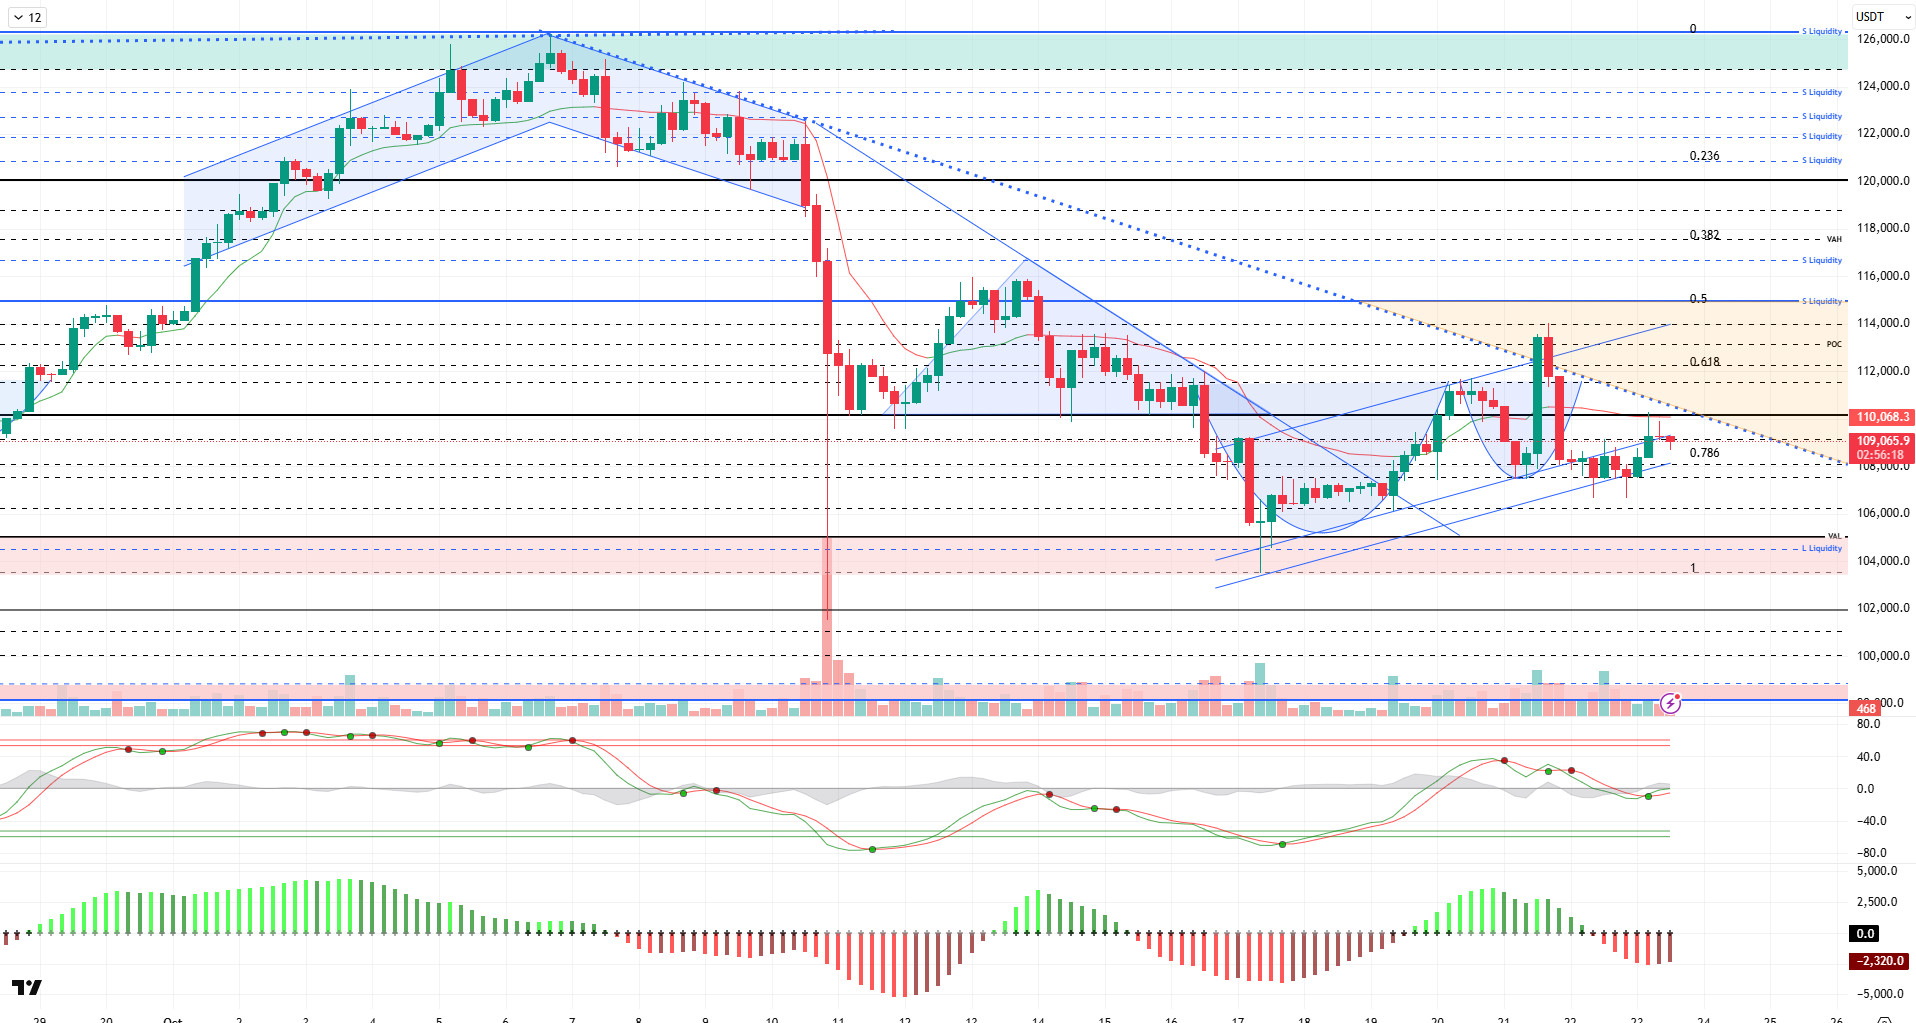
From a technical perspective, although BTC is pushing the 110,000 level compared to the previous analysis, it has not yet managed to break above this region. The price, which remains within the rising minor trend structure, is seeking to regain momentum. At the time of writing, it continues to trade at the 109,000 level.
Technical indicators show that the Wave Trend (WT) oscillator produced a buy signal in the middle band of the channel, signaling a parallel trend reversal to the upside. The Squeeze Momentum (SM) indicator’s histogram is attempting to regain momentum within the negative zone. The Kaufman moving average (KAMA) is currently at $110,093, positioned just above the price.
According to liquidation data, although the 106,600 level has been cleared in the short-term buying range, intensity continues at the 106,000 level. In a broader time frame, another buying range continues to maintain its intensity at the 104,300 level. In contrast, the selling level is recorded at 111,300 in the short term, followed by intensity in the 114,000-115,000 band.
In summary, on the fundamental side, setbacks in the reconciliation process between the US and China are causing continued strong selling pressure in the market. Statements from the Trump camp continue to be decisive for the direction of the markets during this period. The lack of concrete developments regarding the reopening of the US government is another factor that investors are watching closely. On the other hand, the search for a solution on the Russia-Ukraine front, carried out with the support of the EU, stands out as an optimistic development for the markets. Technically, BTC continues to test the 110,000 reference level, while liquidity data shows a decrease in the selling level. In the coming period, the price holding within the minor rising channel stands out as a critical threshold, while closes above the 110,000 level could make the 115,000 level a target. In the event of potential selling pressure, 107,400 has become an important support area.
Supports: 107,400 – 106,600 – 105,000
Resistances: 108,500 – 110,000 – 111,400
ETH/USDT
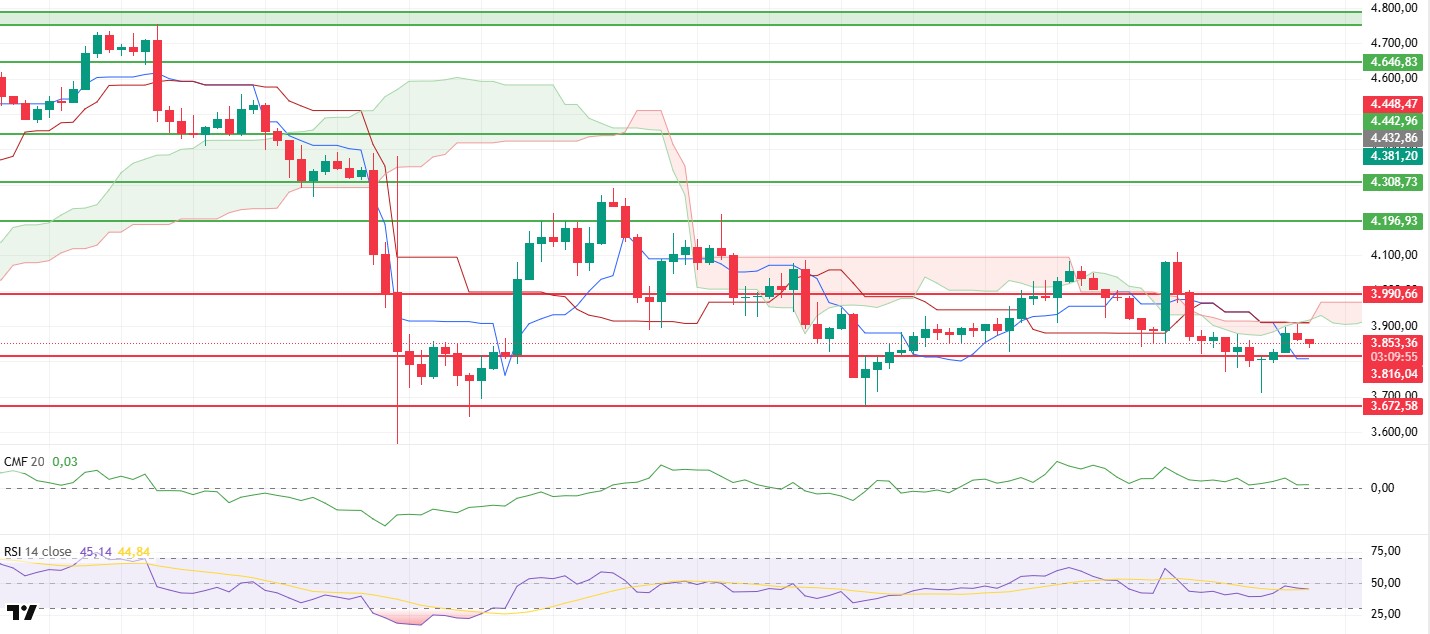
The ETH price encountered resistance during the day at the lower band of the cloud at $3,905 and the intersection of the Kijun line. Selling pressure from this area pushed the price down, causing it to retreat to the $3,840 level. The price holding at this level indicates that buyers are still active in the short term, but selling pressure is regaining strength.
The Chaikin Money Flow (CMF) indicator remains in positive territory and continues its upward trend. The strengthening of the CMF in positive territory indicates that liquidity inflows into the market are still ongoing and capital flows remain buyer-oriented. This structure shows that, despite the downward movement, the market remains generally buyer-supported. As long as the CMF maintains this outlook, the price is likely to hold at current levels.
The Relative Strength Index (RSI) indicator is hovering near the 50 level. This signals that momentum is beginning to stabilize following recent attempts at an uptrend. The RSI remaining above the 50 threshold is important for the price’s chances of recovering. However, a downward movement could cause weak momentum to return in the short term.
According to the Ichimoku indicator, the price is still trading below the cloud’s lower band. Failure to break above the cloud indicates that the downtrend has not yet been fully broken from a technical perspective. The Tenkan line cutting below the Kijun level confirms that the market is in a negative trend.
The overall outlook shows that the market remains in a decision phase. If the ETH price manages to hold around $3,840, we may see another attempt towards the $3,905 resistance. If this level is broken, the uptrend is expected to gain momentum and push the price to the $3,990 level. However, losing the $3,816 support could increase selling pressure again and pull the price down to the $3,740 region. Volatility is likely to remain high in the short term, so closing prices will be decisive in confirming the direction.
Supports: 3,816 – 3,672 – 3,500
Resistances: 3,990 – 4,196 – 4,308
XRP/USDT
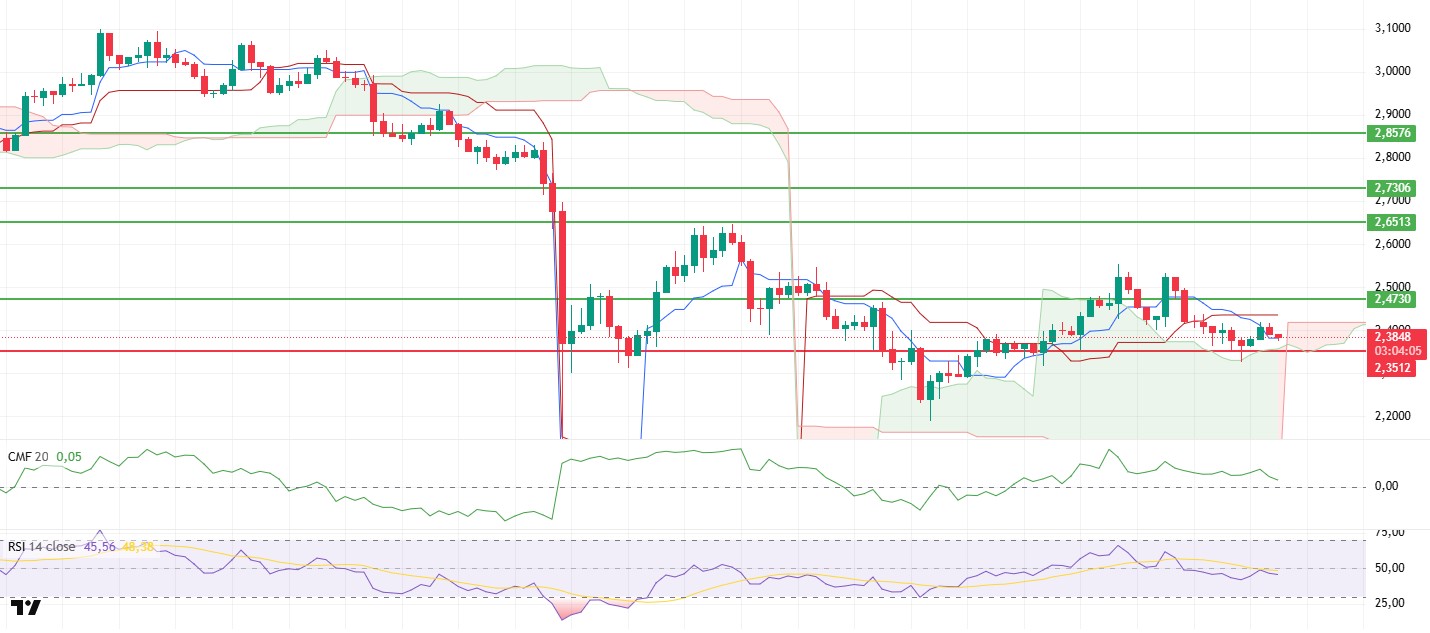
The XRP price experienced a slight pullback during the day, falling to the $2.38 level. Despite the price retreating to this level, the overall structure remains intact, and the short-term outlook is still balanced. Buyers appear to remain active in the market, supported by the cloud.
The Chaikin Money Flow (CMF) indicator continues its movement in positive territory. However, it shows that liquidity outflows are occurring, albeit limited to a slight decline.
The Relative Strength Index (RSI) indicator is currently below 50 and trending slightly downward. This outlook indicates that buying power has weakened somewhat in the short term and that the market is searching for direction. The RSI remaining at this level signals that short-term pressure may continue, but the overall trend structure has not yet been broken.
The overall structure of the Ichimoku indicator remains the same. The fact that the price is still trading above the kumo cloud confirms that the main uptrend continues. The close proximity of the Tenkan and Kijun lines indicates that the squeeze in the market continues, but the potential for an upward breakout is strengthening.
The overall outlook indicates that XRP is maintaining its positive structure in the short term. If the price holds above $2.38, a rebound towards the $2.41 level can be expected. Breaking above this level could accelerate the move towards the $2.47 resistance. On the other hand, the $2.35 level maintains its critical support position. A drop below this region could weaken the short-term bullish outlook.
Supports: 2.3512 – 2.2100 – 2.0768
Resistances: 2.4730 – 2.6513 – 2.7306
SOL/USDT
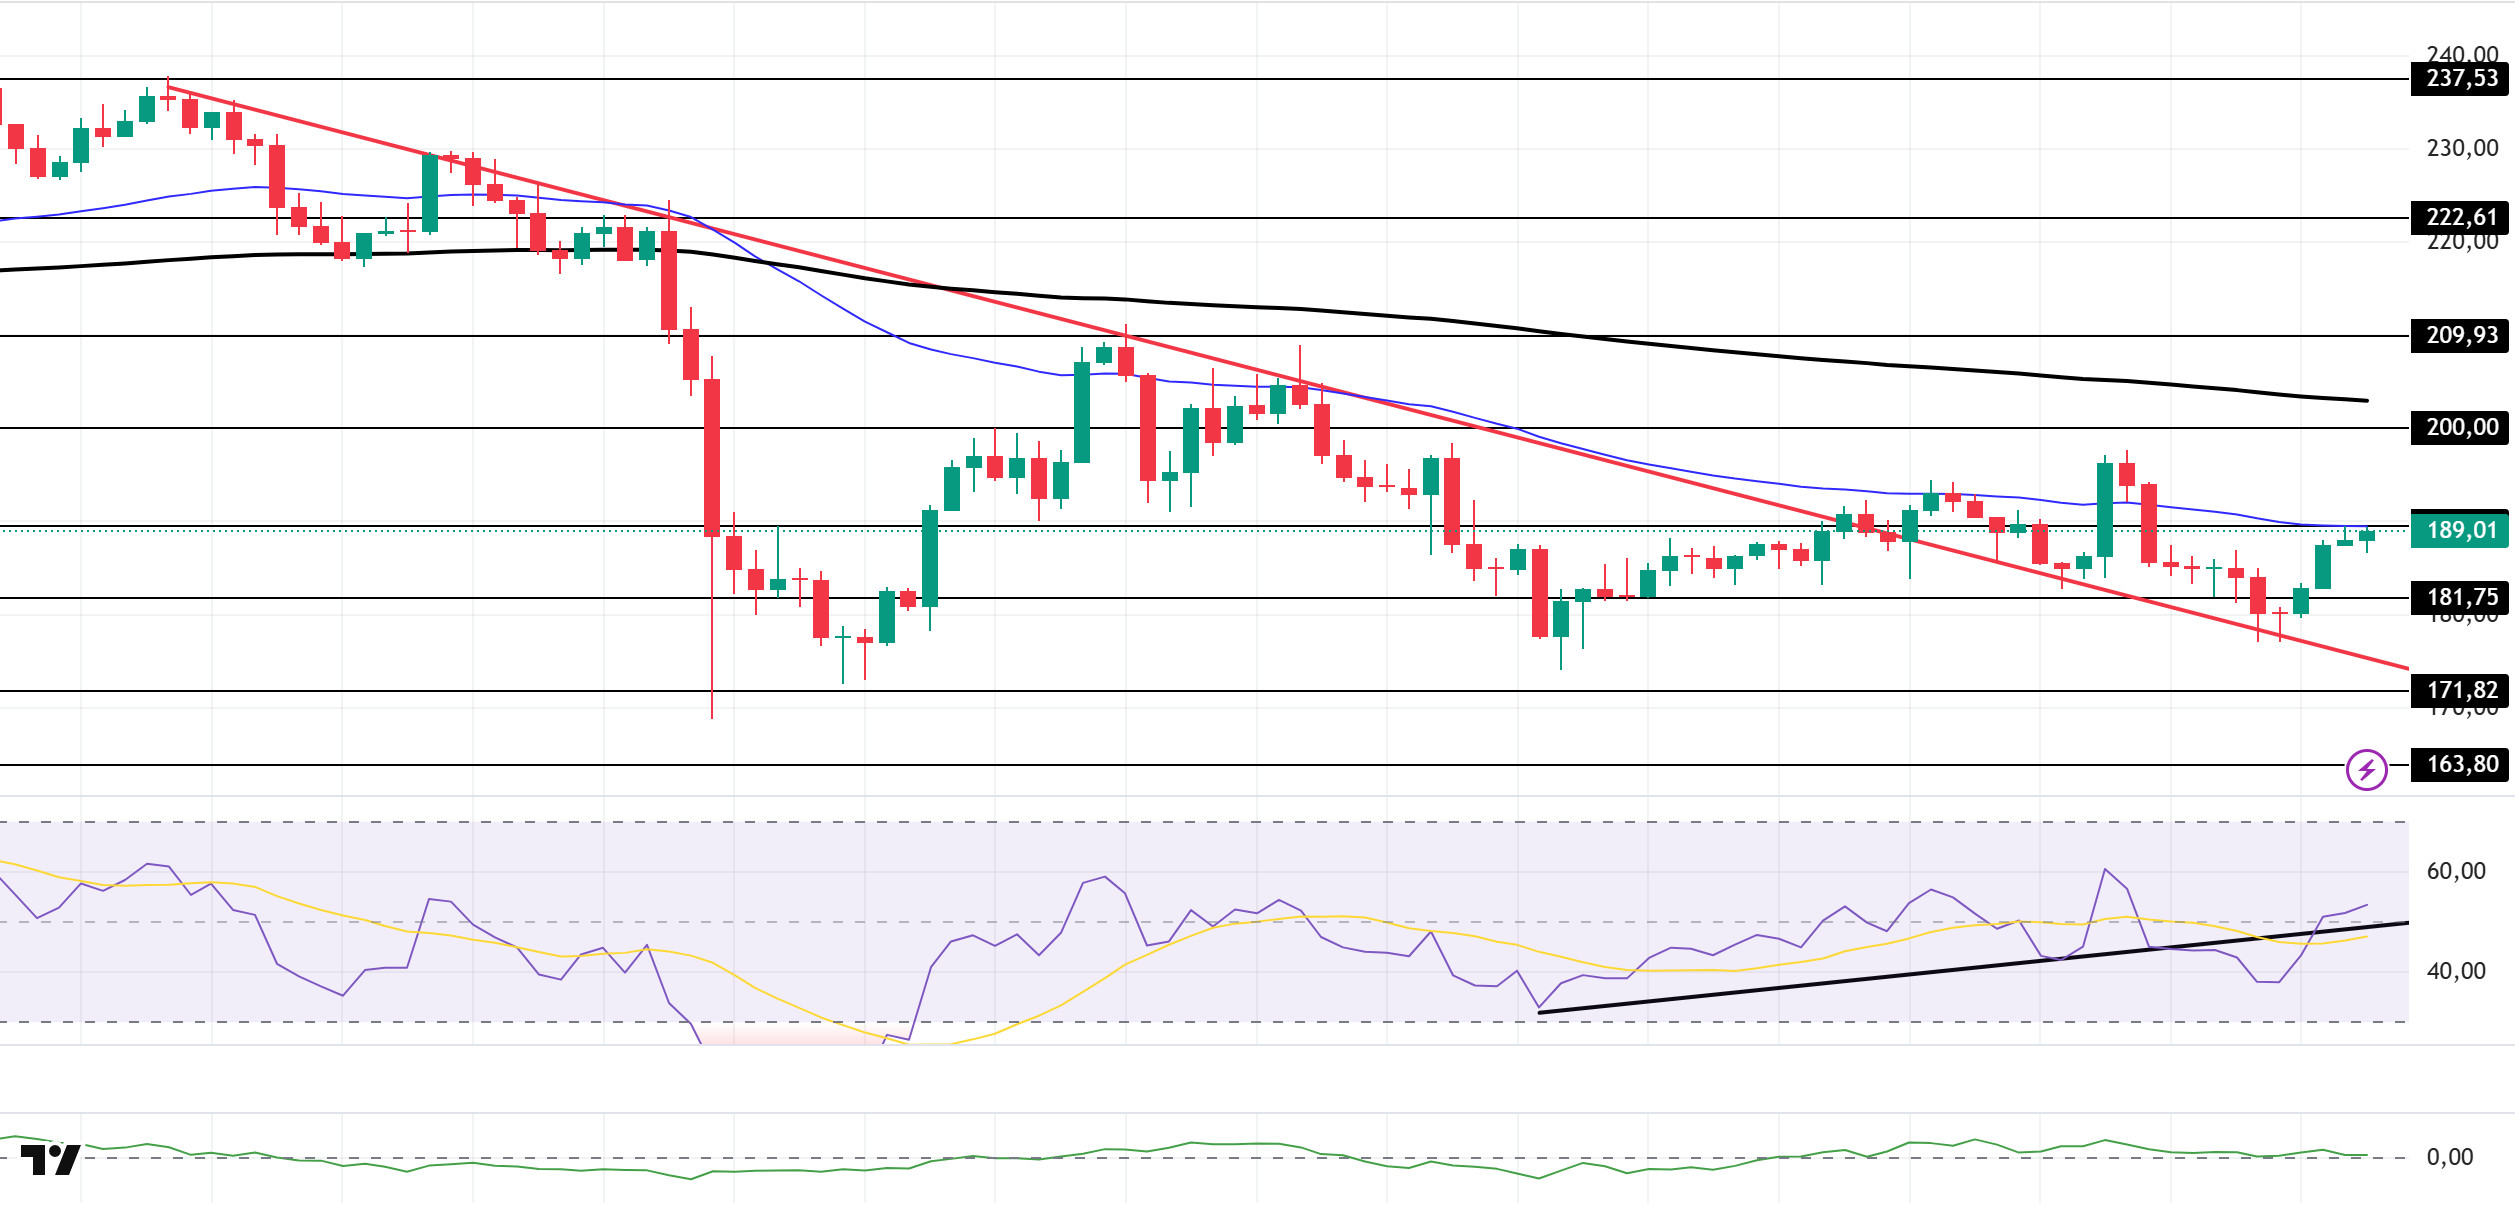
The SOL price traded sideways during the day. The asset tested the descending trend line that began on October 6 as support and gained momentum from there, rising. Currently continuing its upward movement, the price tested the 50 EMA (Blue Line) moving average and experienced a pullback. If the pullback continues, it may retest the downward trend. If the upward movement resumes, the 200 EMA (Black Line) can be monitored.
The price remained below the 50 EMA (Exponential Moving Average – Blue Line) and 200 EMA (Black Line) on the 4-hour chart. This indicates a potential downtrend in the medium term. Additionally, the price being below both moving averages suggests that the asset is in a short-term downtrend. The Chaikin Money Flow (CMF-20) remained in positive territory. However, a decrease in money inflows could push the CMF into negative territory. The Relative Strength Index (RSI-14) moved into positive territory. It also broke above the downward trend that began on October 17. This could increase upward pressure. If there is an uptrend due to macroeconomic data or positive news related to the Solana ecosystem, the $200.00 level stands out as a strong resistance point. If this level is broken upwards, the uptrend is expected to continue. If there are pullbacks due to developments in the opposite direction or profit-taking, the $163.80 level may be tested. A decline to these support levels could increase buying momentum, presenting a potential opportunity for an upward move.
Supports: 181.75 – 171.82 – 163.80
Resistances: 189.54 – 200.00 – 209.93
DOGE/USDT
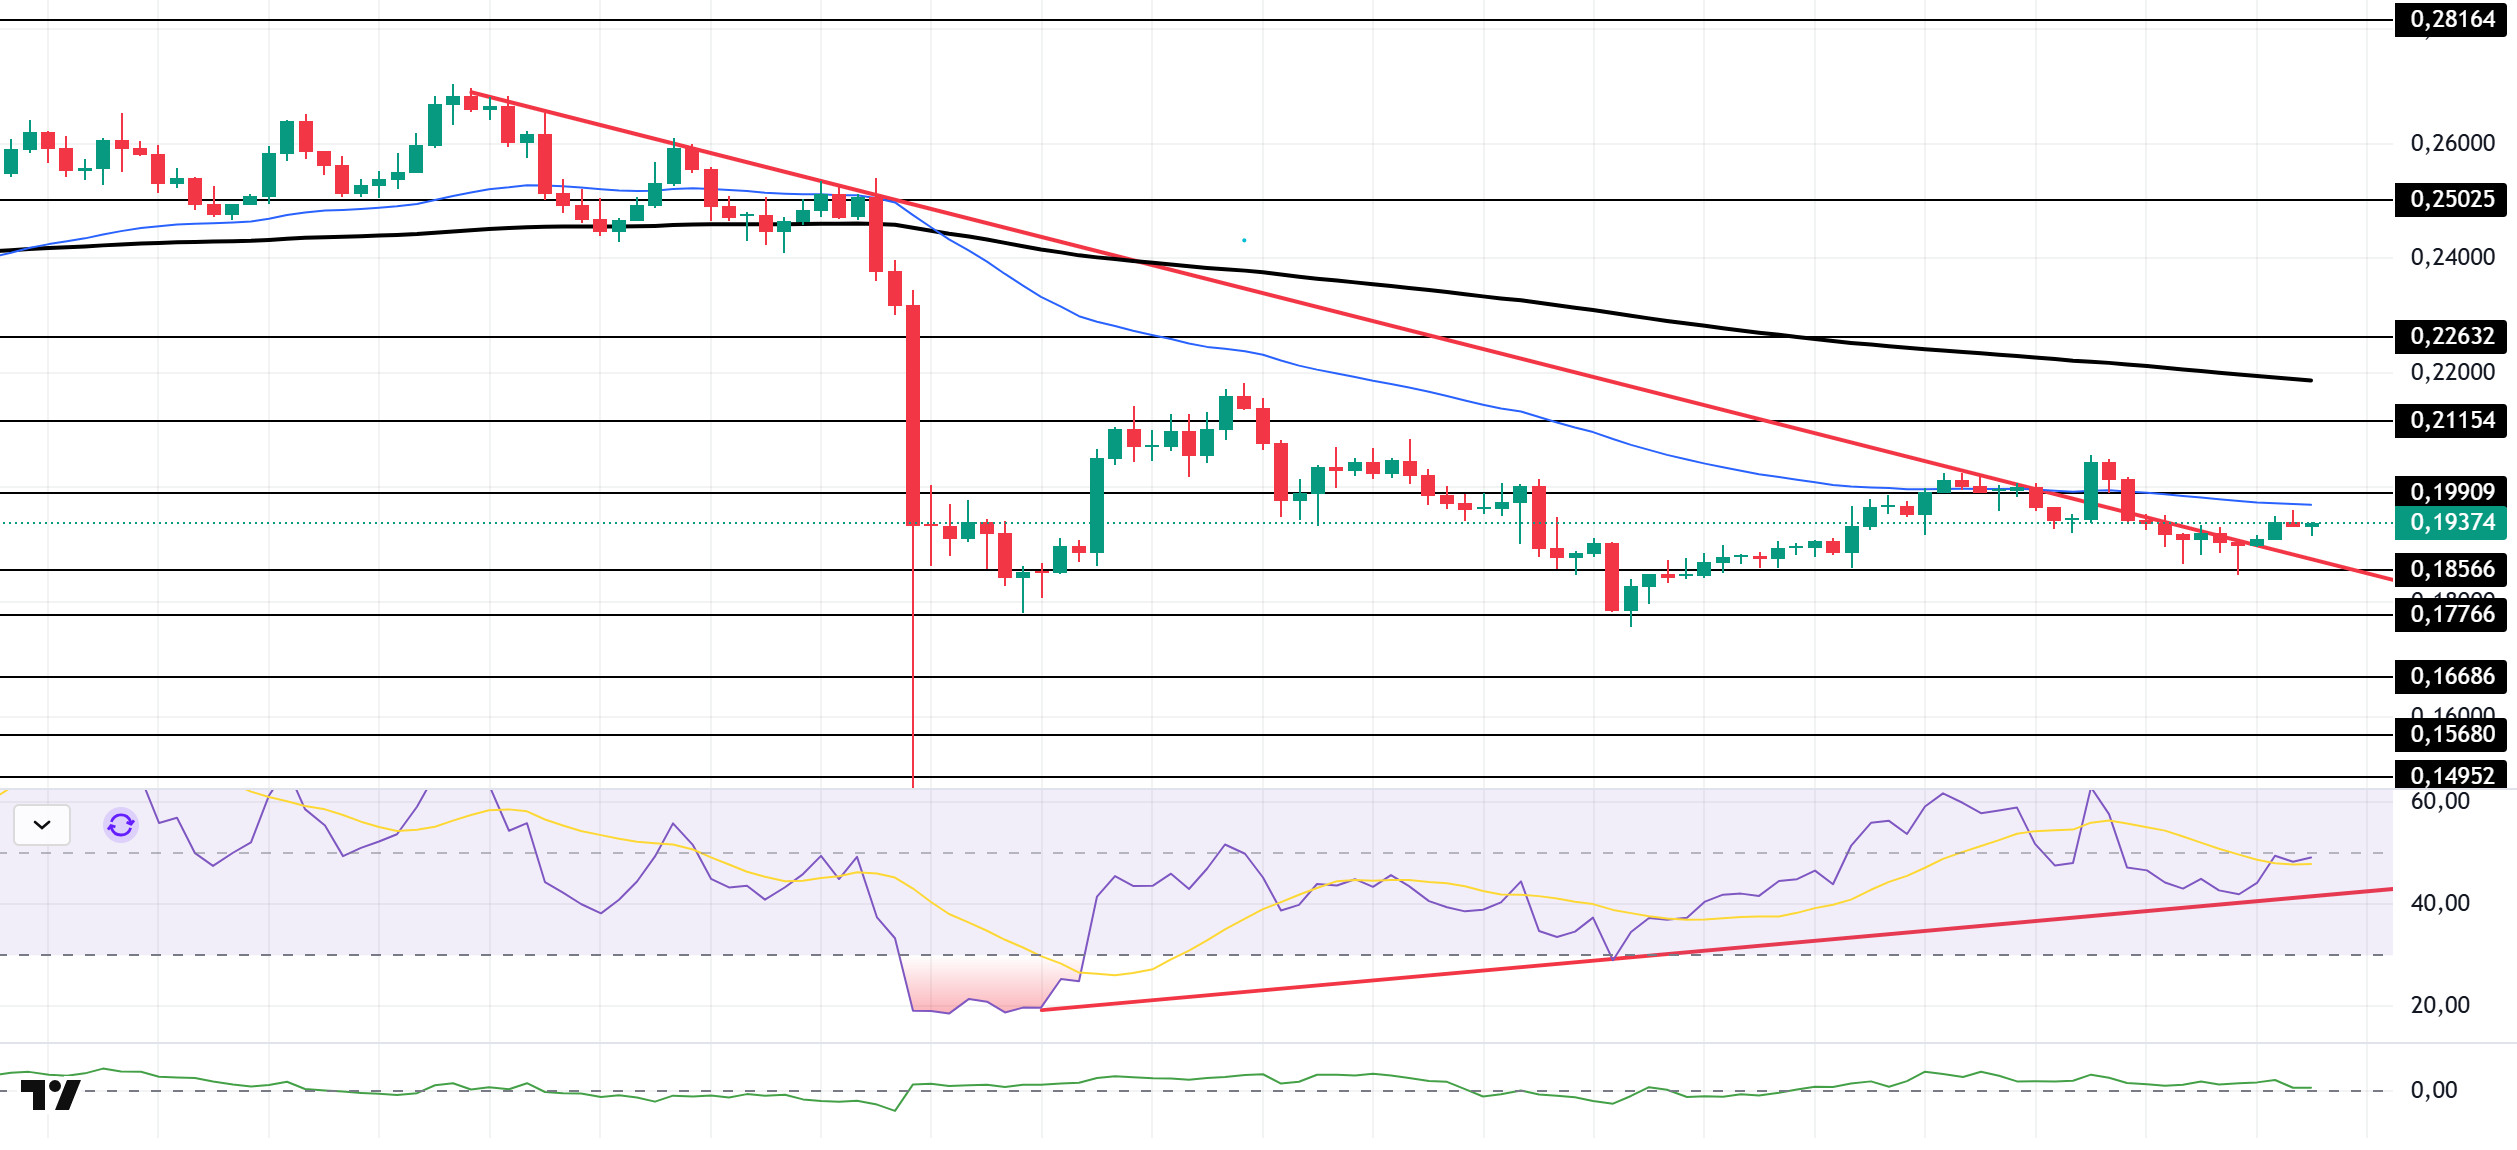
The DOGE price traded sideways during the day. The asset managed to hold on to the upper region of the downtrend that began on October 6. This signaled increased upward pressure. The price tested the 50 EMA (Blue Line) moving average as resistance and experienced a slight pullback from this level. It may test the 200 EMA (Black Line) moving average on candle closes above the 50 EMA. Should a pullback begin, the strong support level at $0.17766 should be monitored.
On the 4-hour chart, the 50 EMA (Exponential Moving Average – Blue Line) remained below the 200 EMA (Black Line). This indicates that a downtrend may begin in the medium term. The price being below both moving averages shows that the price is trending downward in the short term. The Chaikin Money Flow (CMF-20) continues to hold its positive position. Additionally, balanced cash inflows may keep the CMF in positive territory. The Relative Strength Index (RSI-14) continues to hold above the upward trend that began on October 12. However, the indicator has fallen to a negative level. This signals that the downward trend may increase. In the event of an upturn driven by political developments, macroeconomic data, or positive news flow in the DOGE ecosystem, the $0.21154 level stands out as a strong resistance zone. Conversely, in the event of negative news flow, the $0.16686 level could be triggered. A decline to these levels could increase momentum and potentially initiate a new upward wave.
Supports: $0.18566 – $0.17766 – $0.16686
Resistances: 0.19909 – 0.21154 – 0.22632
AVAX/USDT
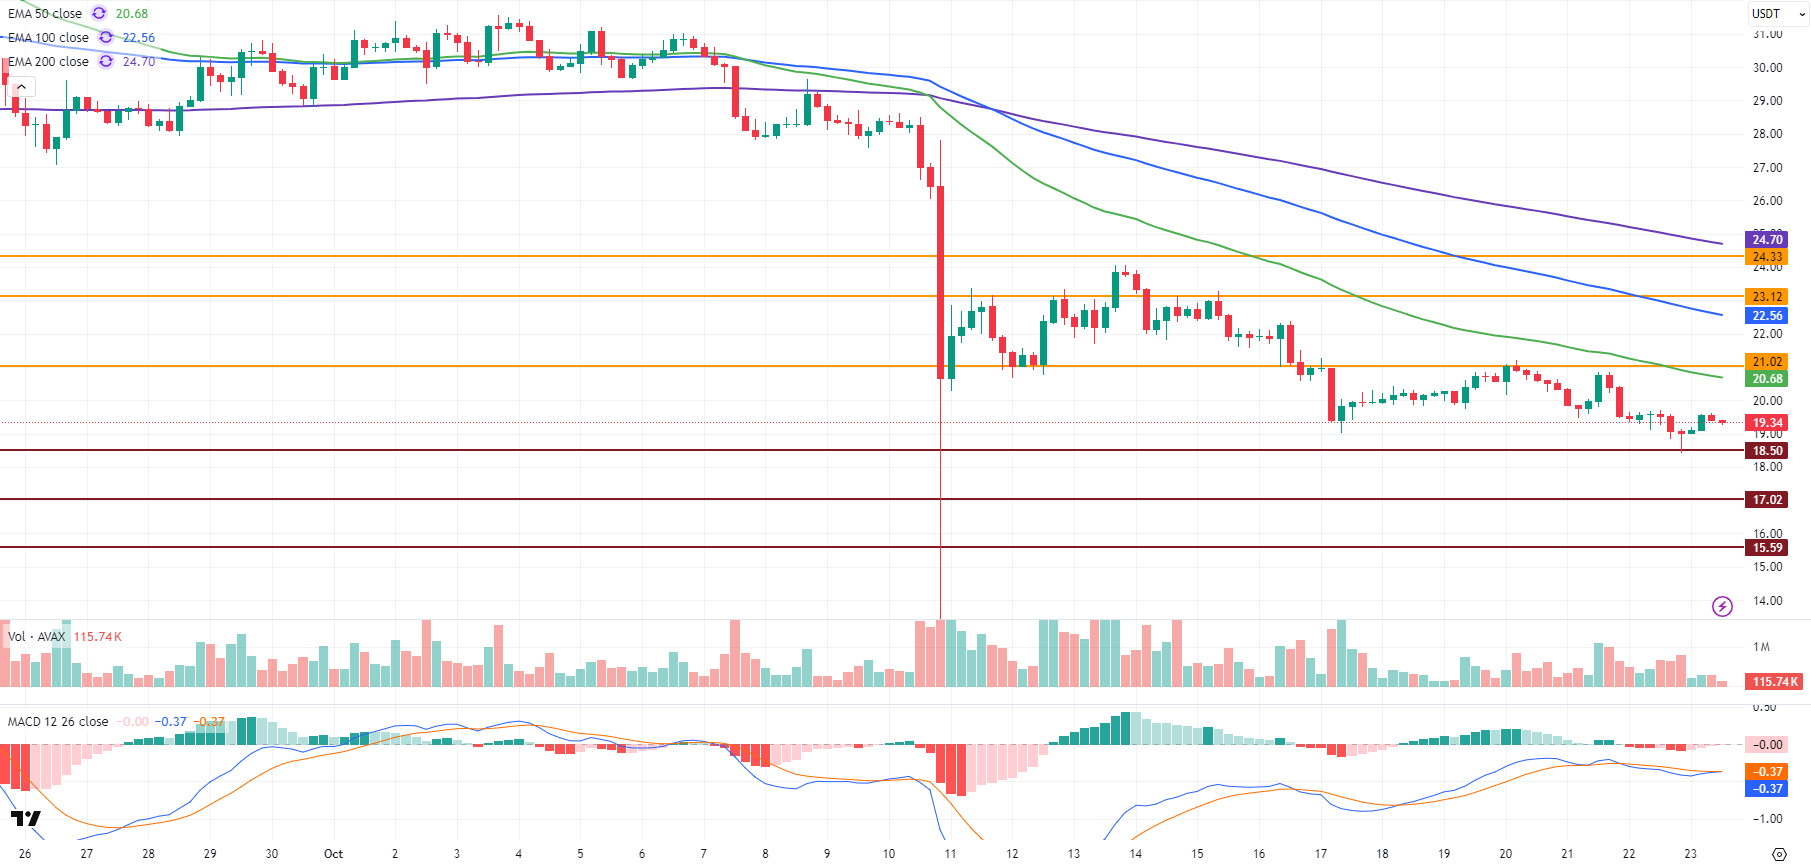
AVAX started the day at $19.02 and rose to $19.58 during the day, then fell back to $19.30 levels due to selling pressure. AVAX, which recorded an approximate 1.68% increase in value on a daily basis, has continued to trade within a horizontal band for the last two days. Due to low trading volumes in the market, volatility remains weak, and no clear direction is emerging in price movements. While uncertainty and low volume persist in the cryptocurrency market overall, the AVAX price continues to be affected by this outlook. Although there have been positive developments in the Avalanche ecosystem, low market volume and weak investor interest mean that these positive developments are not having an impact on the AVAX price.
On the 4-hour chart, the Moving Average Convergence/Divergence (MACD) line has crossed the signal line. This indicates a potential change in momentum direction. If the MACD line crosses the signal line upwards, it could create short-term upward momentum for the AVAX price. However, low trading volume is preventing this potential from being fully supported. AVAX is still trading below critical Exponential Moving Average (EMA) levels. This technical outlook indicates that the trend is still in negative territory, but if the price breaks above these EMA levels, momentum is expected to strengthen.
From a technical perspective, the $21.02 level remains important for AVAX on the upside. If this level is exceeded, the $23.12 and $24.33 levels could come into play. Conversely, in a downward movement, the $18.50 level could be retested. If the price closes below this level, selling pressure could increase, and a pullback to the $17.02 and $15.59 levels could come into play. In the overall picture, a weak recovery signal is observed on the MACD side, while the negative trend structure is maintained on the EMA side. For momentum to strengthen, a significant increase in trading volume is required. Otherwise, AVAX may continue its sideways movement in the $18.50-$19.75 range in the short term.
(EMA50: Green Line, EMA100: Blue Line, EMA200: Purple Line)
Support levels: 18.50 – 17.02 – 15.59
Resistances: 21.02 – 23.12 – 24.33
Legal Notice
The investment information, comments, and recommendations contained herein do not constitute investment advice. Investment advisory services are provided individually by authorized institutions taking into account the risk and return preferences of individuals. The comments and recommendations contained herein are of a general nature. These recommendations may not be suitable for your financial situation and risk and return preferences. Therefore, making an investment decision based solely on the information contained herein may not produce results in line with your expectations.