
Technical Analysis – October 16, 2025 – Evening
BTC/USDT
US Federal Reserve members continue to send mixed messages regarding the interest rate cut process. Fed Board Member Milan stated that she plans to support a 50-basis-point cut at the October 28–29 meeting but that a 25-basis-point move is more likely. Waller expressed a stance in favour of gradual easing, saying, “We can cut by 25 bp and observe the effect,” while Mester also advocated for a 50 bp cut but said she expects three small cuts to be made during the year. Meanwhile, due to the government shutdown in the US, September retail sales, CPI, and Philadelphia Fed index data have been delayed. According to on-chain data, miners transferred 51,000 BTC to a centralized exchange over the past week.
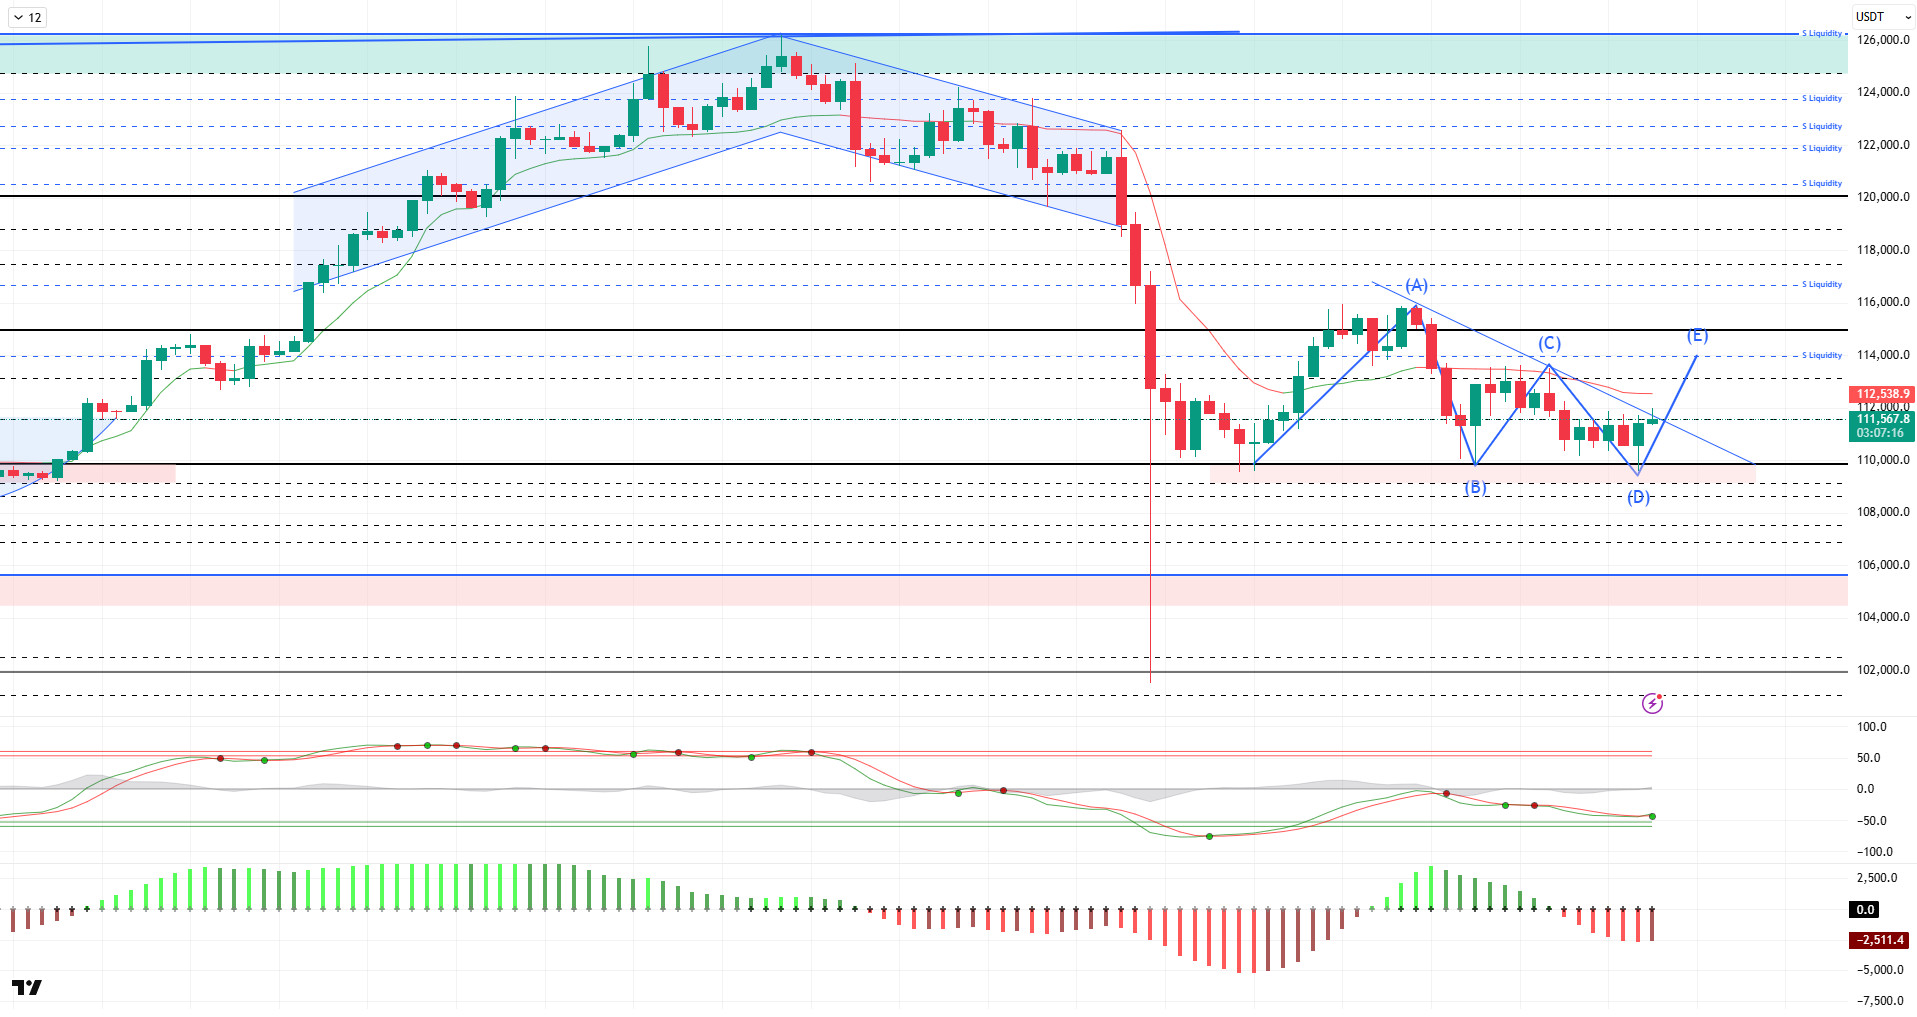
From a technical perspective, BTC showed volatile movements during the day, briefly falling below the 110,000 level. After rebounding, the price became stuck in a narrowing triangle pattern following its third dip. At the time of writing, it continues to test the 111,500 resistance level.
Technical indicators point to a trend reversal, with the Wave Trend (WT) oscillator starting to signal a buy near the oversold zone. The Squeeze Momentum (SM) indicator’s histogram is trying to gain strength in negative territory. The Kaufman Moving Average (KAMA) is currently at $112,500, positioned above the price.
According to liquidation data, the short-term buy order book weakened significantly with the latest decline, while long-term positions above the 109,500 level were also liquidated. In contrast, the sell order book has concentrated in the 113,700–113,900 range and is now the next target.
In summary, on the fundamental side, the renewed tariff tensions between the US and China, coupled with the ongoing US government shutdown, weighed on prices. However, Powell’s openness to interest rate cuts in the coming period in response to labor market deterioration stood out as an optimistic development. BTC, which started the October cycle well and reached a 10% ROI, gave back all its gains and is currently down 2.51%. Technically, BTC reached saturation point by testing its all-time high (ATH) at $126,198. After this level, liquidity data became the main factor triggering the price correction. After a sharp sell-off, BTC recorded some recovery but failed to maintain stability above the $115,000 level and faced renewed selling pressure, falling back to the $110,000 level. After this stage, it is critically important for the price not to lose the 110,000 level for a new upward movement. In this regard, 111,500 stands out as an area of demand accumulation. If demand arises from here, we will follow the 115,000 reference zone and then the liquidity areas.
Supports: 111,500 –110,000 – 109,000
Resistances: 112,600 – 113,000 – 115,000
ETH/USDT
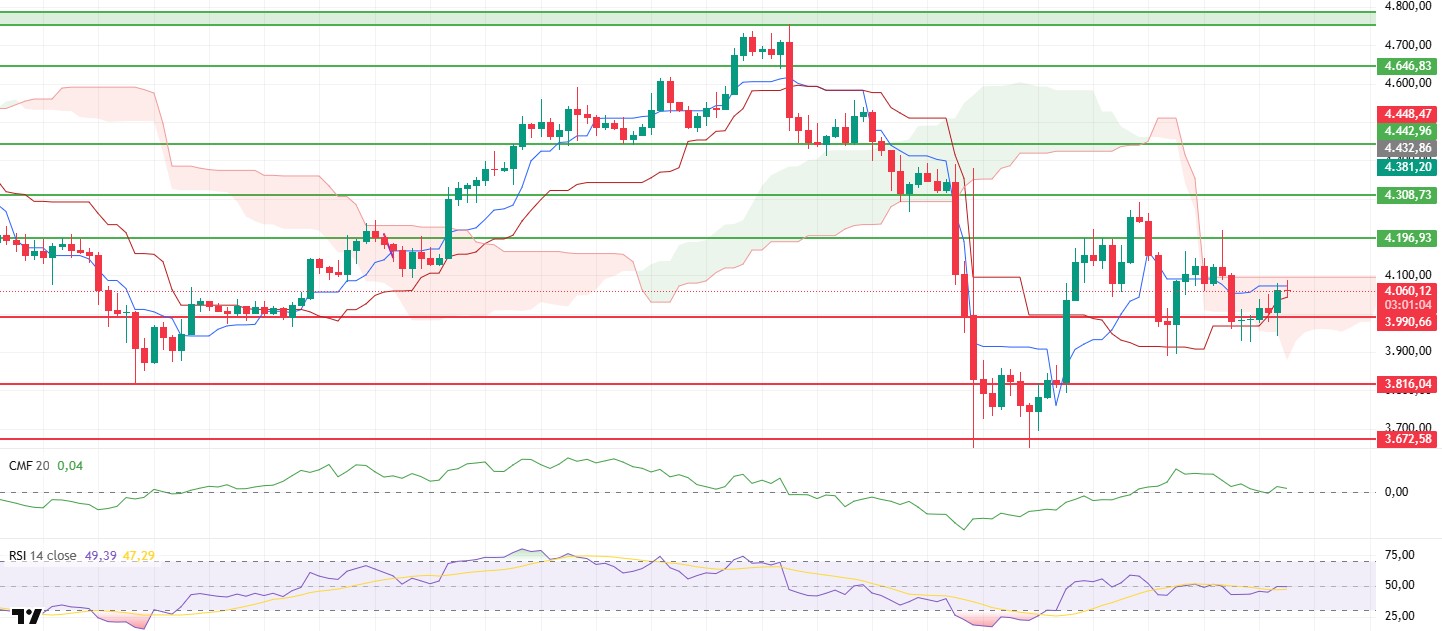
After dipping to $3,940 during the day, the price rebounded strongly and experienced a rapid rise, managing to climb to the upper band of the cloud. This movement indicates that buyers have become active again in the lower support zones and that the market is gaining strength in the short term. However, the selling pressure the price encountered at the upper band of the cloud reveals that there is not yet sufficient volume support for the rally to continue.
The Chaikin Money Flow (CMF) indicator falling back to the zero line signals that the liquidity entering the market remains weak and that the capital flow supporting the rise is limited. This situation indicates that capital inflows need to increase for the price to establish a sustained upward momentum in the short term.
The Relative Strength Index (RSI) indicator remaining below the 50 level reveals that momentum loss is continuing and buyers are struggling to gain strength. The RSI rising above 50 is critical for the current recovery to turn into a more solid uptrend.
In the Ichimoku indicator, the price trading below the Tenkan level technically produces a weak signal in the short term, while the overall structure of the kumo cloud remaining intact indicates that the medium-term upward trend is continuing. If the price breaks above the cloud’s upper band, upward momentum could regain strength.
The $3,990 level remains a critical support level in the overall outlook. If the price continues to hold above this region, a new wave of upward movement could form towards the $4,100 and $4,196 resistance levels, accompanied by rebound buying. However, if the $3,990 support level is lost, the weak outlook in the CMF and RSI could come into play, causing the price to retreat back towards the $3,920 – $3,850 range.
Top of Form
Below the Form
Supports: 3,990 – 3,816 – 3,672
Resistances: 4,196 – 4,308 – 4,442
XRP/USDT
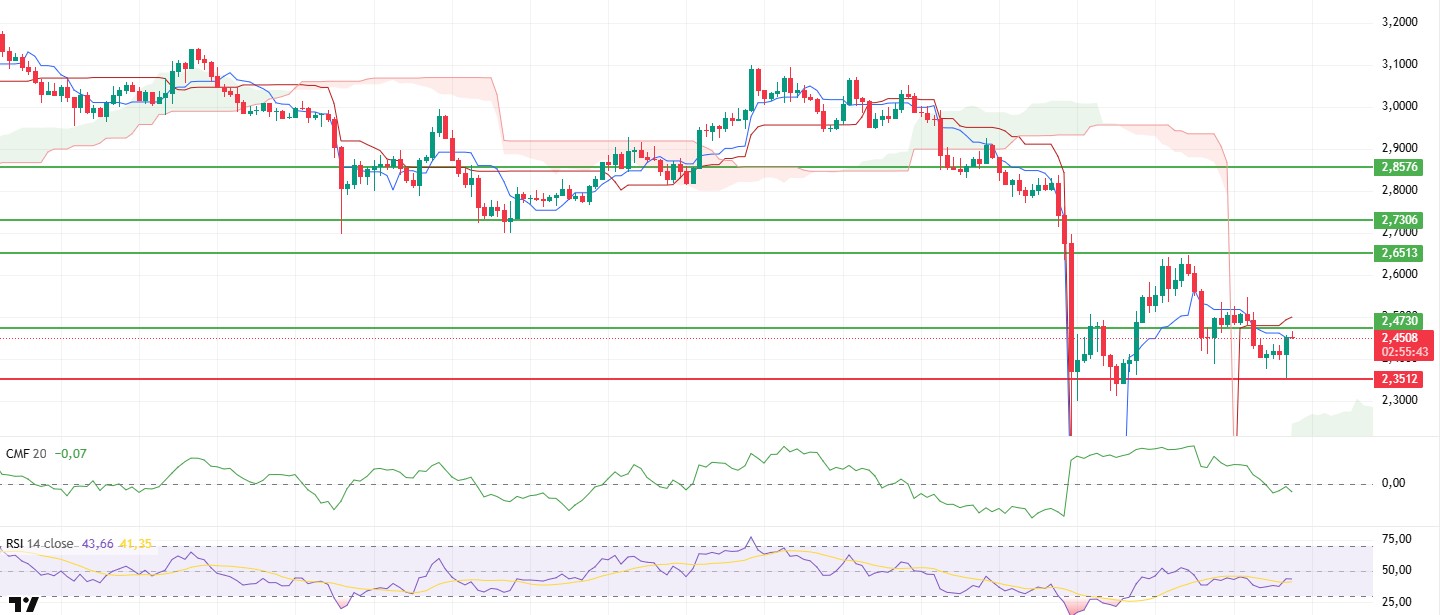
The XRP price fell to the $2.35 support level during the day, but then rebounded from this area with buying pressure, rising to the $2.45 level. This movement indicates that buyers have re-entered the market at the $2.35 level and that the market continues to seek equilibrium in the short term. However, the price remaining below $2.47 suggests that the rebound cannot yet be considered a strong recovery.
The Chaikin Money Flow (CMF) indicator continues to decline in negative territory, signaling continued liquidity outflows from the market and a marked weakness in capital inflows. This pattern indicates that upward movements still lack sufficient support and that buyers are struggling to gain strength.
The Relative Strength Index (RSI) indicator continues to move sideways in the weak momentum zone. This stagnant appearance in the RSI confirms that market momentum remains low in the short term and that buyers have not yet gained the upper hand.
In the Ichimoku indicator, the price losing the kijun and tenkan levels and the tenkan level remaining below the kijun level supports the short-term negative structure. However, with the price remaining above the kumo cloud, it can be said that the overall trend remains positive.
The $2.47 level may be retested in the overall outlook. However, if the price fails to hold in this region, combined with the CMF’s continued negative trend and weak momentum on the RSI, it could pave the way for a new downward movement. A possible drop below $2.38 could increase selling pressure, causing the price to fall below the $2.35 support level and trigger a deeper pullback.
Supports: 2.4730 – 2.3512 – 2.0768
Resistances: 2.6513 – 2.7306 – 2.8576
SOL/USDT
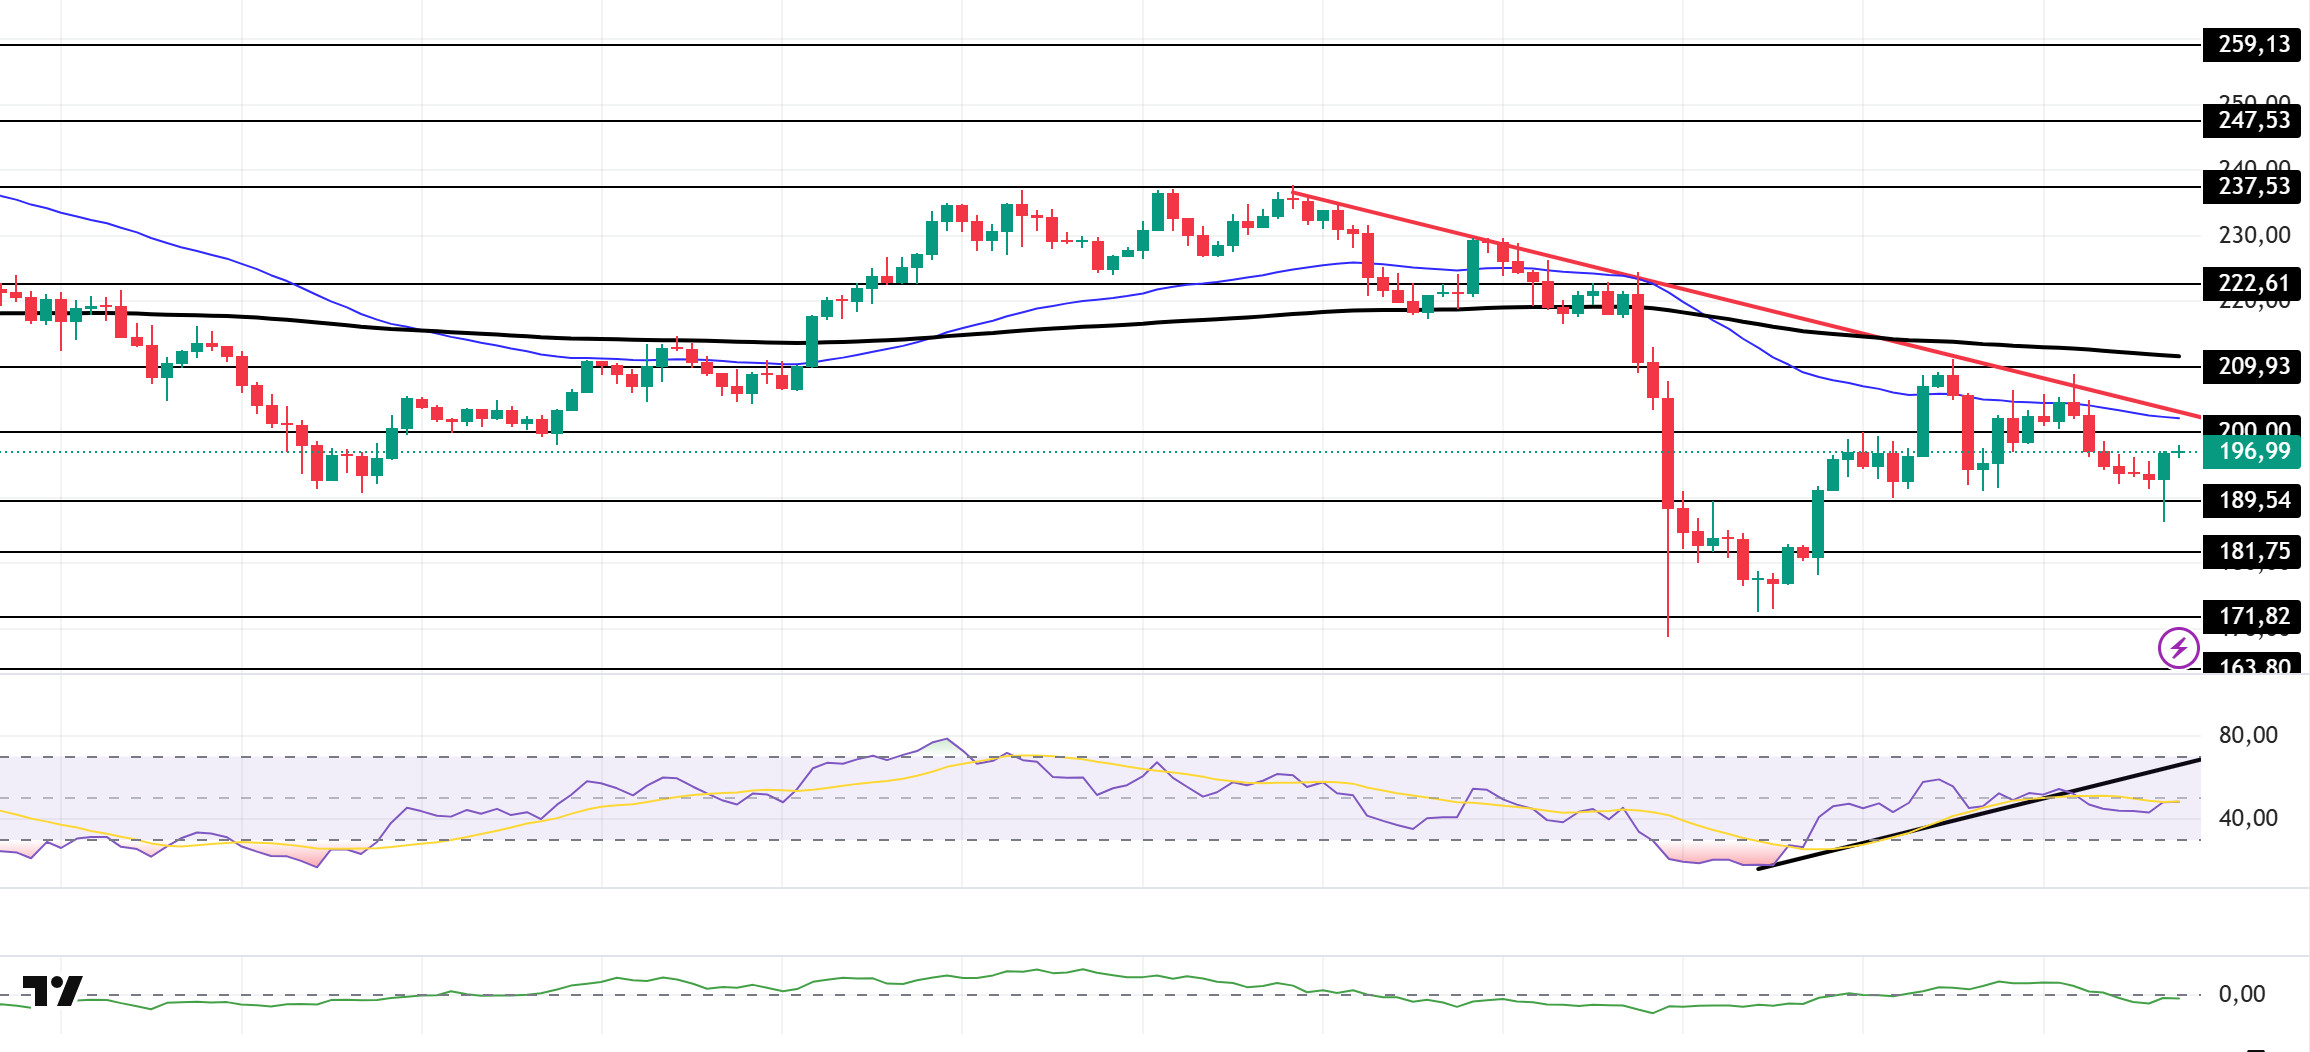
The SOL price showed a slight increase during the day. The asset continues to be in the lower region of the downward trend that began on October 6. Testing the $189.54 level as support, the price accelerated from there and showed a slight increase. If the rise continues, it may test the 50 EMA (Blue Line) and the downward trend line as resistance. In the event of a pullback, the $189.54 level may be triggered once again.
The price remained below the 50 EMA (Exponential Moving Average – Blue Line) and 200 EMA (Black Line) on the 4-hour chart. This indicates a potential downtrend in the medium term. Additionally, the price being below both moving averages suggests that the asset is in a short-term downtrend. The Chaikin Money Flow (CMF-20) remained in negative territory. However, a decrease in money inflows could push the CMF deeper into negative territory. The Relative Strength Index (RSI-14) remained below the upward trend that began on October 12 but showed a slight increase, approaching neutral territory. This signaled a slight decrease in selling pressure. If there is an uptrend due to macroeconomic data or positive news related to the Solana ecosystem, the $209.93 level stands out as a strong resistance point. If this level is broken upwards, the uptrend is expected to continue. In the event of pullbacks due to developments in the opposite direction or profit-taking, the $181.75 level could be tested. A decline to these support levels could increase buying momentum, presenting a potential opportunity for an uptrend.
Supports: 189.54 – 181.75 – 171.82
Resistances: 200.00 – 209.93 – 222.61
DOGE/USDT
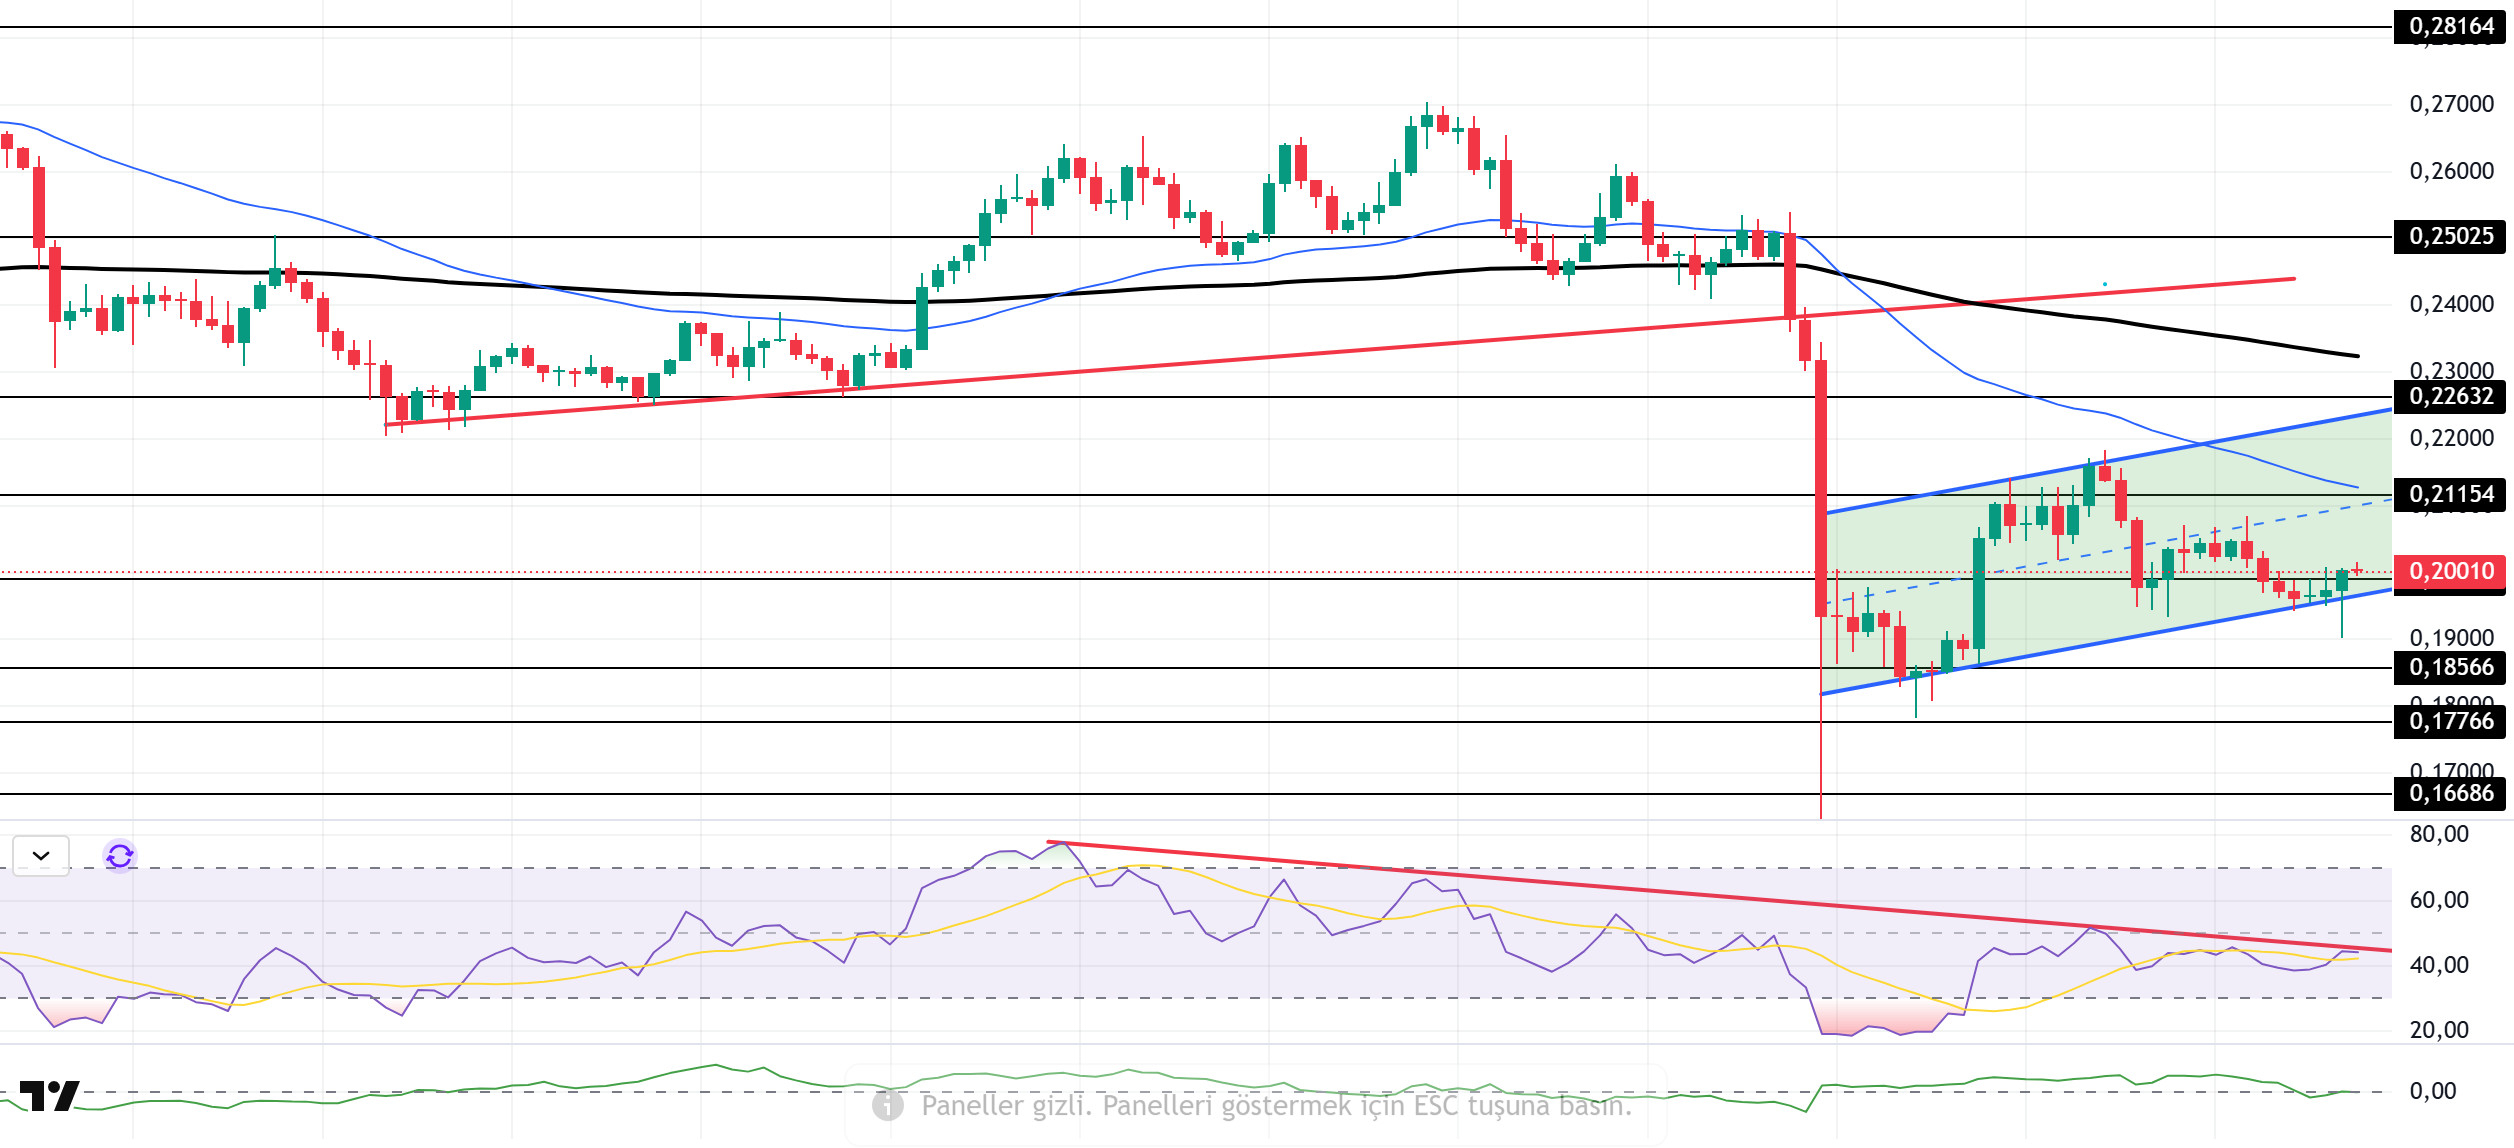
The DOGE price showed a slight increase during the day. The asset continues to be in the lower region of the upward trend that began on September 25. The price, supported by the strong support level at the base of the upward trend, has broken above the strong resistance level of $0.19909 as of now. A pullback may occur in candle closes below the upward trend. If the upward trend continues, the 50 EMA (Blue Line) moving average should be monitored.
On the 4-hour chart, the 50 EMA (Exponential Moving Average – Blue Line) remained below the 200 EMA (Black Line). This indicates that a downtrend may begin in the medium term. The price being below both moving averages shows that the price is trending downward in the short term. The Chaikin Money Flow (CMF-20) has started to remain at a neutral level. Additionally, a decrease in money inflows could push the CMF into negative territory. The Relative Strength Index (RSI-14) is currently testing the resistance level of the downward trend that began on October 2. The metric, which continues to hover around the midpoint of the negative zone, could see buying pressure if it breaks above this trend. In the event of an uptrend driven by political developments, macroeconomic data, or positive news flow within the DOGE ecosystem, the $0.22632 level stands out as a strong resistance zone. Conversely, in the event of negative news flow, the $0.18566 level could be triggered. A decline to these levels could increase momentum and initiate a new wave of growth.
Supports: 0.19909 – 0.18566 – 0.17766
Resistances: 0.21154 – 0.22632 – 0.25025
LTC/USDT
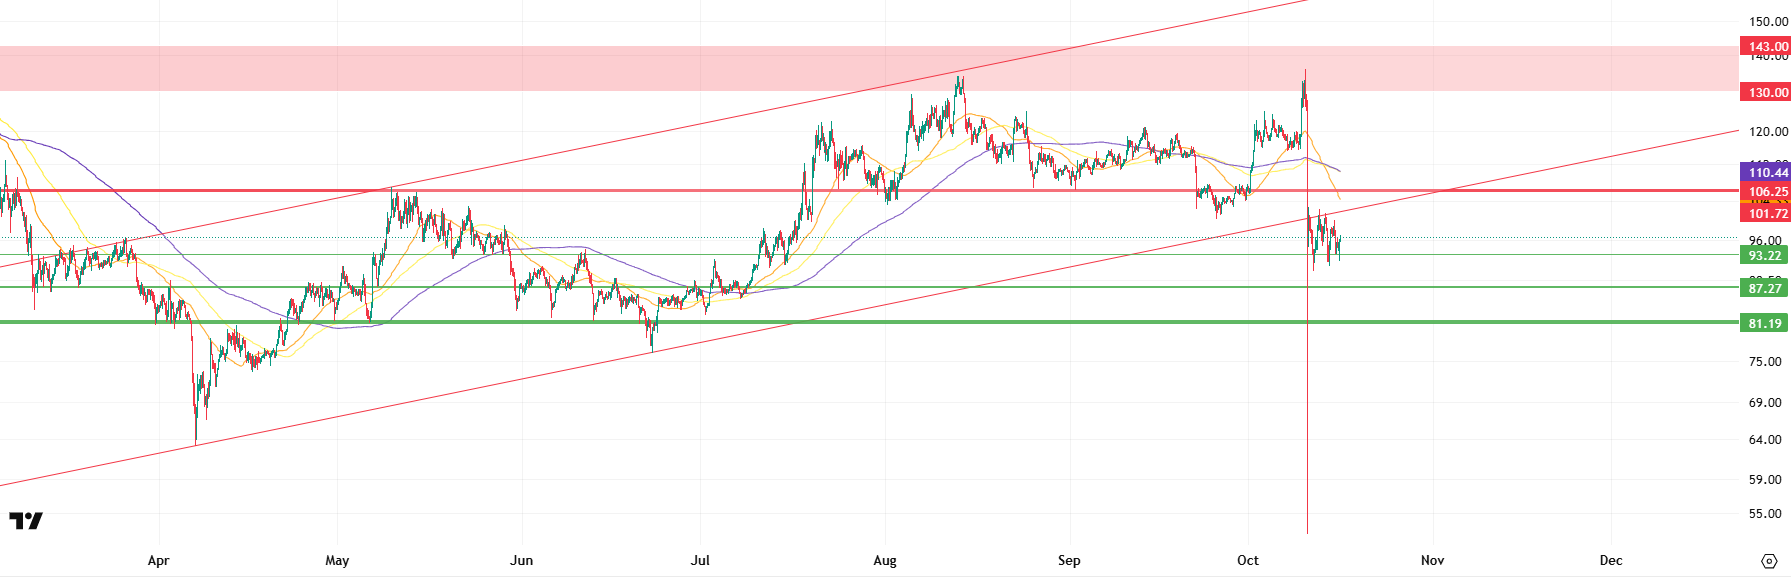
LTC ended the day 1.03% higher against USDT and gained 0.23% against Bitcoin. On the futures side, the long/short position ratio of 0.9066 opened in the last 24 hours shows that derivative market participants continue to reduce their downward expectations, although the downward trend is still ongoing. Funding rates have started to shift from neutral to negative. This picture shows that the unrealized decline expectations in the derivatives markets in the first half of the day continued throughout the rest of the day.
From a technical perspective, the price remaining below all moving averages and the rising trend continues to support expectations of a decline, also influenced by the heavy short positions in the derivatives market. However, the current structure also holds the potential for an upward correction. If this scenario materializes, the level where the price may first encounter selling pressure is the rising trend’s lower band at 102.12. If this region is breached, the horizontal resistance at 106.25 is the next significant barrier that could limit any potential upside. Additionally, the 50-period moving average (orange line), positioned between these two resistance zones, creates an additional hurdle that could complicate any upward price movement. Finally, the 110.44 level, where the 100- and 200-period moving averages (yellow and purple lines) intersect, is another critical stage where selling pressure could regain strength.
In pullback movements that meet the general expectations of derivatives market investors, it may be possible to close or reduce short positions at 93.22, which is a point where the price could initially find support. If the price falls below this level, the decline is likely to accelerate, and the price could potentially retreat to 87.27. If the price falls below this level, the 81.19 region will become a major support level. Breaking this point could be considered a critical threshold, suggesting that the market is not just undergoing a short-term correction but that the medium-term trend is beginning to shift in favor of the bears.
Supports: 93.22 – 87.27 – 81.19
Resistances: 102.12 – 106.25 – 110.44
Legal Notice
The investment information, comments, and recommendations contained herein do not constitute investment advice. Investment advisory services are provided individually by authorized institutions taking into account the risk and return preferences of individuals. The comments and recommendations contained herein are of a general nature. These recommendations may not be suitable for your financial situation and risk and return preferences. Therefore, making an investment decision based solely on the information contained herein may not produce results in line with your expectations.