
October 6-13, 2025 – Darkex Weekly Technical Analysis Report
BTC/USDT
Last week saw unusual developments, with the US government shutdown halting the flow of economic data and the announcement that the September non-farm payrolls (NFP) report would not be released. Weak ADP data confirmed the slowdown in the employment market, while the Trump administration is considering distributing the revenue from tariffs as cash payments to the public during the shutdown. Meanwhile, China is reportedly preparing to offer investment commitments to the US in exchange for easing trade restrictions, while in Japan, Sanae Takaichi is poised to become the country’s first female prime minister. On the global geopolitical front, tensions between Russia and Ukraine are escalating again, while in the crypto market, Tether’s $1 billion purchase of Bitcoin and Strategy’s BTC assets exceeding the market value of major banks attracted attention.
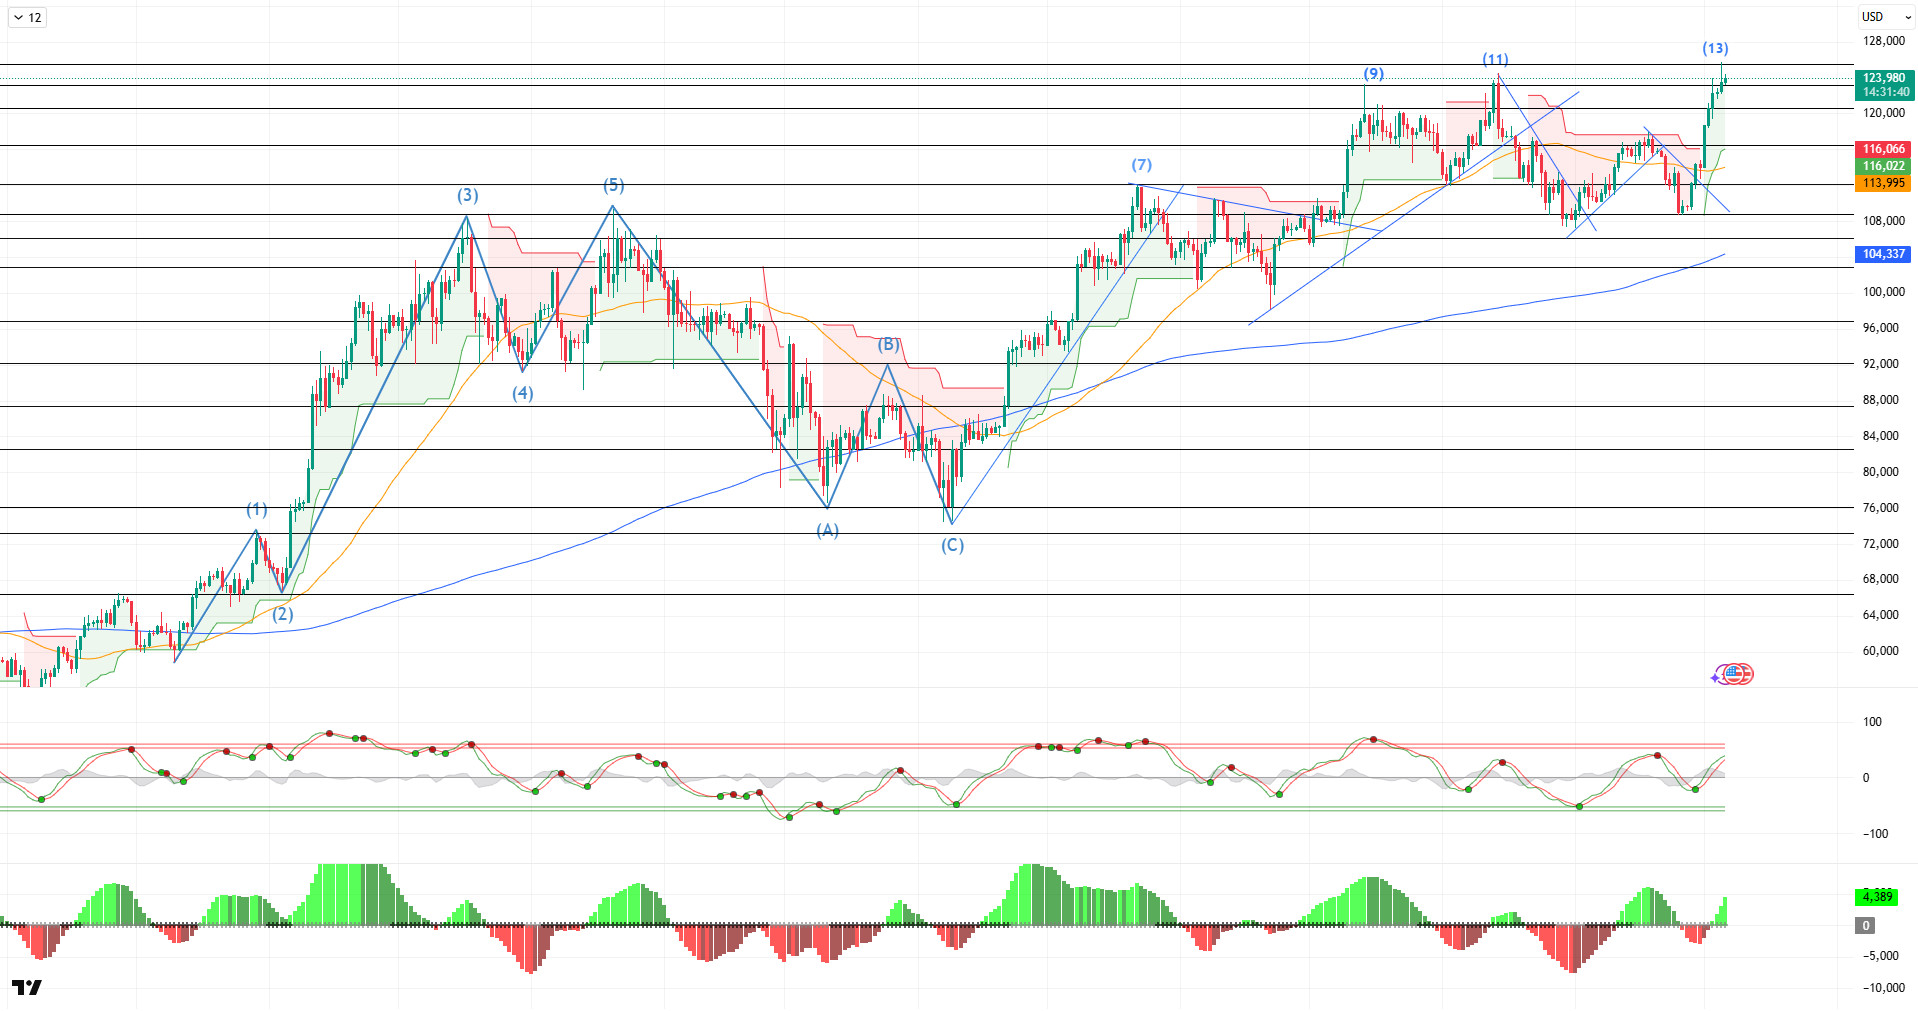
Following all these developments, looking at the daily technical outlook, BTC reached its 13th point with a golden cross formation and carried its ATH level to 125,500. BTC, which started its rally from the 109,000 level with the breakout of the downward trend structure at the end of September, continued in October, recording an increase of approximately 15%. Having managed to move the 9 and 11 levels it had previously tested upwards, BTC continues to maintain its major upward trend, stepping towards new peaks.
Looking at technical indicators, the Wave Trend (WT) oscillator crossed the middle band of the parallel channel, approaching the overbought zone, in line with the buy signal it gave on a daily basis. While the Squeeze Momentum (SM) indicator is still moving within the negative zone, the golden cross pattern continues in the moving averages with the 50-day SMA crossing above the 200-day SMA.
When examining weekly liquidity data, the intensity of buy-side transactions continues at the 112,000 and 117,000 levels, and following the recent rise, this band has expanded to the 120,000 level. In contrast, sell-side transactions continue to maintain their frequency.
In summary, looking at fundamental developments, the decline in recession risk due to US macro data, along with the increase in interest rate cut expectations, emerged as a positive development for the market. Furthermore, the reduced importance of tariffs in the equation, combined with optimistic pricing in October, enabled BTC to test its new ATH level. On the technical side, BTC recorded a “W” type recovery with its double bottom, while liquidity data set a precedent by failing to hinder the rise. In the coming period, psychological resistance points will be monitored as the price moves towards new ATH levels. On the other hand, in the event of potential selling pressure, 120,000 emerges as a new reference zone for maintaining a positive position.
Supports: 123,000 – 120,500 – 116,600
Resistances: 125,500 – 128,000 – 130,000
ETH/USDT
Within the Ethereum ecosystem, protocol and ecosystem developments continue to play a decisive role in price dynamics. The rapid progress of the Fusaka upgrade through its testnet phases and the developer roadmap pointing towards November holds significant potential as a catalyst for network efficiency and costs. Information shared in industry sources about the testnet schedule and recent progress with Fusaka indicates that the upgrade could be deployed to the mainnet soon. Second, on-chain liquidity and institutional demand data are strengthening price fundamentals. Ethereum Total Value Staked (TVS) rose to 36.1 million after a short-term decline, signaling a renewed strengthening of the long-term staking trend. ETF inflows, indicating accelerated institutional demand, are also providing net capital flows to the ecosystem. Looking at these two factors together, a strong recovery in strategic investor confidence can be observed.
Looking at the relationship between price movements and liquidity, the price’s rise towards the $4,600 level occurred alongside a relatively low open interest of $27.1 billion. However, for a healthy rise, spot liquidity needs to come into play permanently. The fact that the rise with relatively low open interest reduces the risk of a short squeeze is a positive sign for the sustainability of the movement, but if there is insufficient spot liquidity underneath, fragility may increase.
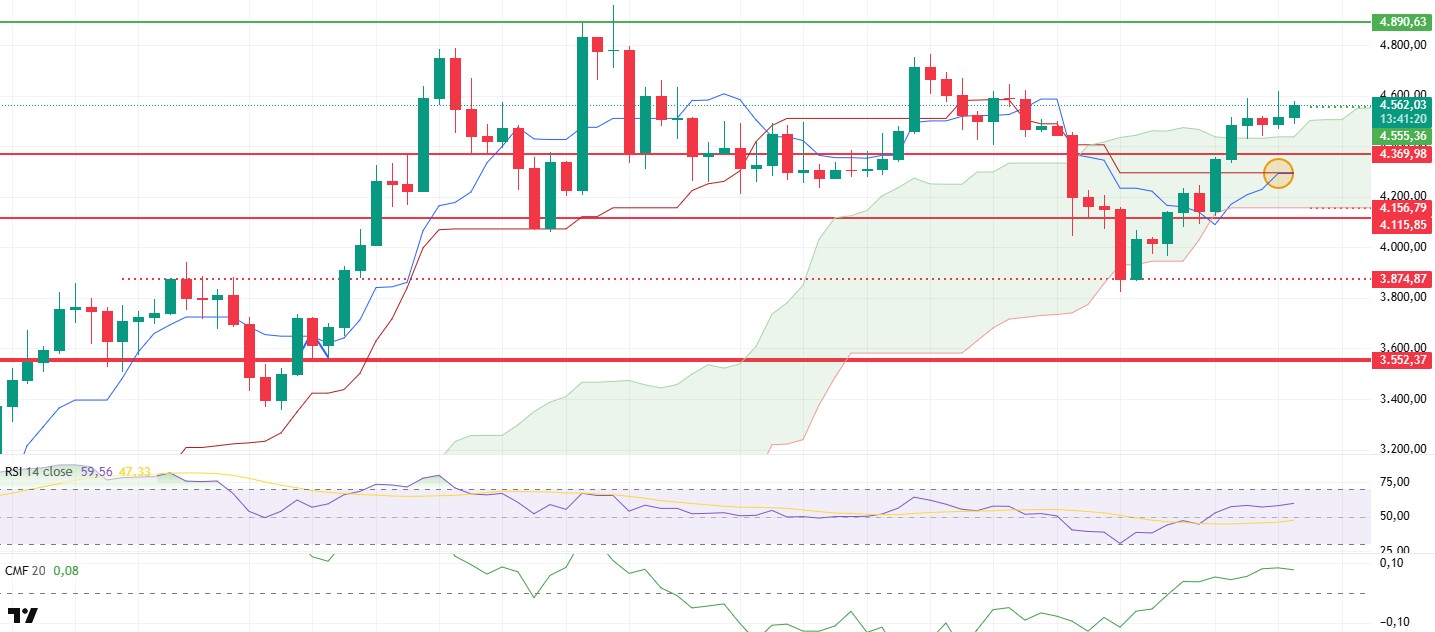
Therefore, examining liquidity indicators clarifies the technical perspective. The Chaikin Money Flow (CMF) indicator clearly entering positive territory with the recent rise indicates increased net liquidity inflows and an active buyer side. On the other hand, the previously observed weak spot support associated with the Cumulative Volume Delta (CVD) suggested that some rally legs remained futures-heavy. The recent recovery partially closes this gap.
From the Ichimoku indicator perspective, the main trend appears to have turned positive. The price breaking above the kumo cloud and the Tenkan level crossing above the Kijun level support the shift of the main trend to positive. This technical structure is a strong finding confirming medium-term buyer dominance. However, the requirement for the price to settle permanently above the kumo cloud for confirmation of the remains valid. These levels are the first critical areas to monitor in the short term.
The Relative Strength Index (RSI) momentum indicator is around 60 levels and provides sufficient technical room for upward movement. The RSI’s recovery from around 50 to climb to 60 is a technical confirmation of strengthening momentum, and if momentum is maintained, continued upward movement in the short to medium term is possible.
In terms of risk management and the main scenario, the weekly outlook remains positive, but important price thresholds must be maintained. As long as sustainable closes above the $4,369 level are achieved, a retest of the $4,890 key resistance level is highly probable. Otherwise, closes below $4,369 could lead to a retest of the $4,158 level, the lower band of the kumo cloud, and cause short-term momentum to weaken. While the increase in on-chain staking and accelerating ETF inflows provide a structurally positive backdrop, whether spot liquidity will strengthen and the technical/community alignment of the Fusaka process are the two main topics to watch in terms of rally sustainability.
Supports: 4,369 – 4,115 – 3,552
Resistances: 4,650 – 4,890 – 5,250
XRP/USDT
Notable news over the past week included roadmaps from the Ripple team focused on corporate compliance and privacy, with XRP trading above $3.00 around October 5. Ripple engineers emphasized privacy and compliance enhancements on the XRP Ledger for corporate use.
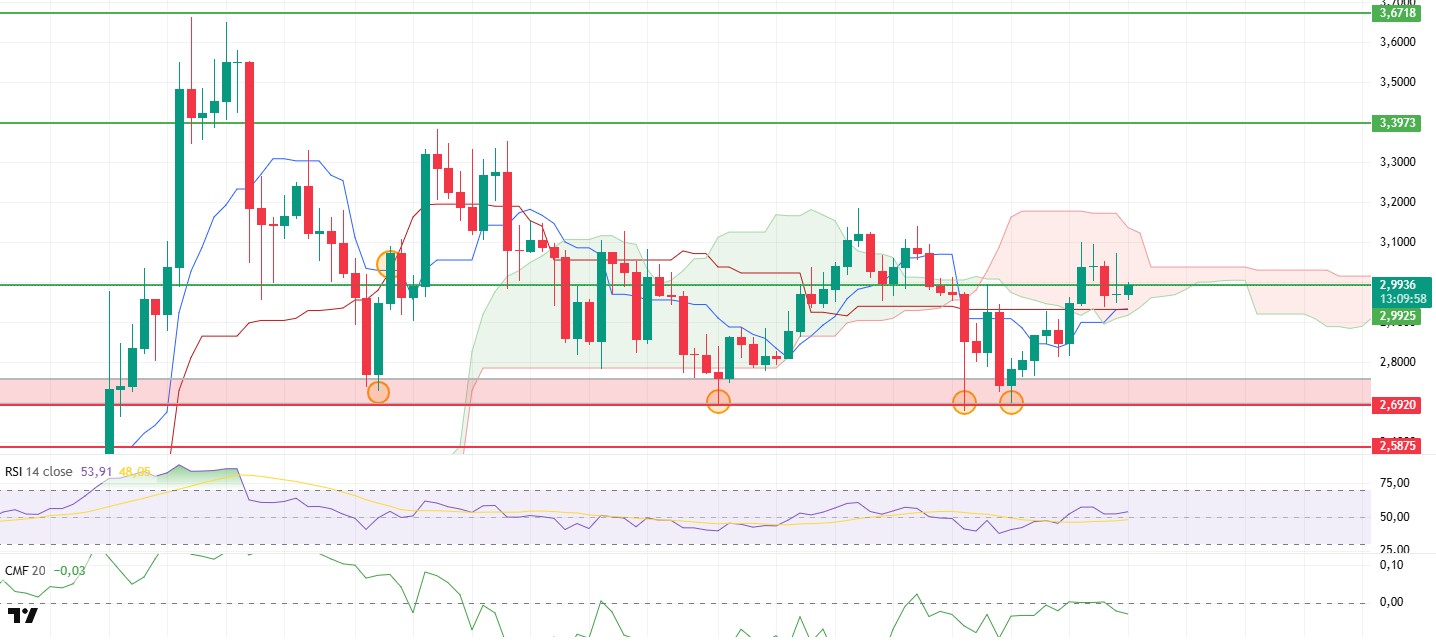
Looking at XRP price movements, despite briefly breaking through the $2.99 resistance last week, the price failed to remain above this level. After the volatility over the weekend, selling pressure reasserted itself, and technical indicators generally maintain a neutral outlook. While the price reacting at the resistance zone indicates that buyers are still active, profit-taking is limiting price movements.
Liquidity indicators have signaled a critical weakness. The Chaikin Money Flow (CMF) failed to hold onto positive territory and reverted to downward movement. The CMF’s shift to a negative trend indicates insufficient spot liquidity flow and immediate selling pressure. This structure makes it difficult for the uptrend to be sustainable in the short term, as most of the buying appears to be driven by seasonal or futures sources rather than sustained spot demand.
From the Ichimoku indicator perspective, the price remains within the kumo cloud boundaries, continuing its search for direction. The kumo upper band and Tenkan Kijun axes stand out as critical thresholds. The price settling permanently above the kumo upper band and the Tenkan level clearly settling above Kijun will provide the necessary technical confirmation for the medium-term trend to turn positive.
Daily closes above the $2.99 resistance and the $3.03 level, which is the upper band of the kumo cloud, will be an important signal confirming the positive movement. Otherwise, the neutrality in the indicators and the weakness in the CMF will strengthen the possibility of a continued downward movement. For short-term risk management, it should be remembered that a loss of $2.99 could strengthen the sellers’ hand. Ultimately, news flow and developments in spot/institutional demand could have a catalytic effect on the market. The technical outlook is currently oscillating between neutral and slightly negative. For confirmation of an upward scenario, sustained closes above $2.99 and $3.03 should be monitored.
Supports: 2.9925 – 2.6920 – 2.5875
Resistances: 3.3973 – 3.6718 – 4.1848
SOL/USDT
Last week in the Solana ecosystem.
- Franklin, Fidelity, CoinShares, Bitwise, Grayscale, VanEck, and Canary submitted S-1 amendments that include staking features.
- Solana developers are considering removing block limits after the Alpenglow update.
- VisionSys AI entered into a special agreement with Marinade Finance. Under the agreement, a Solana-based treasury program with a maximum value of $2 billion was launched.
- Solana treasury company Sharps Technology announced a $100 million share buyback.
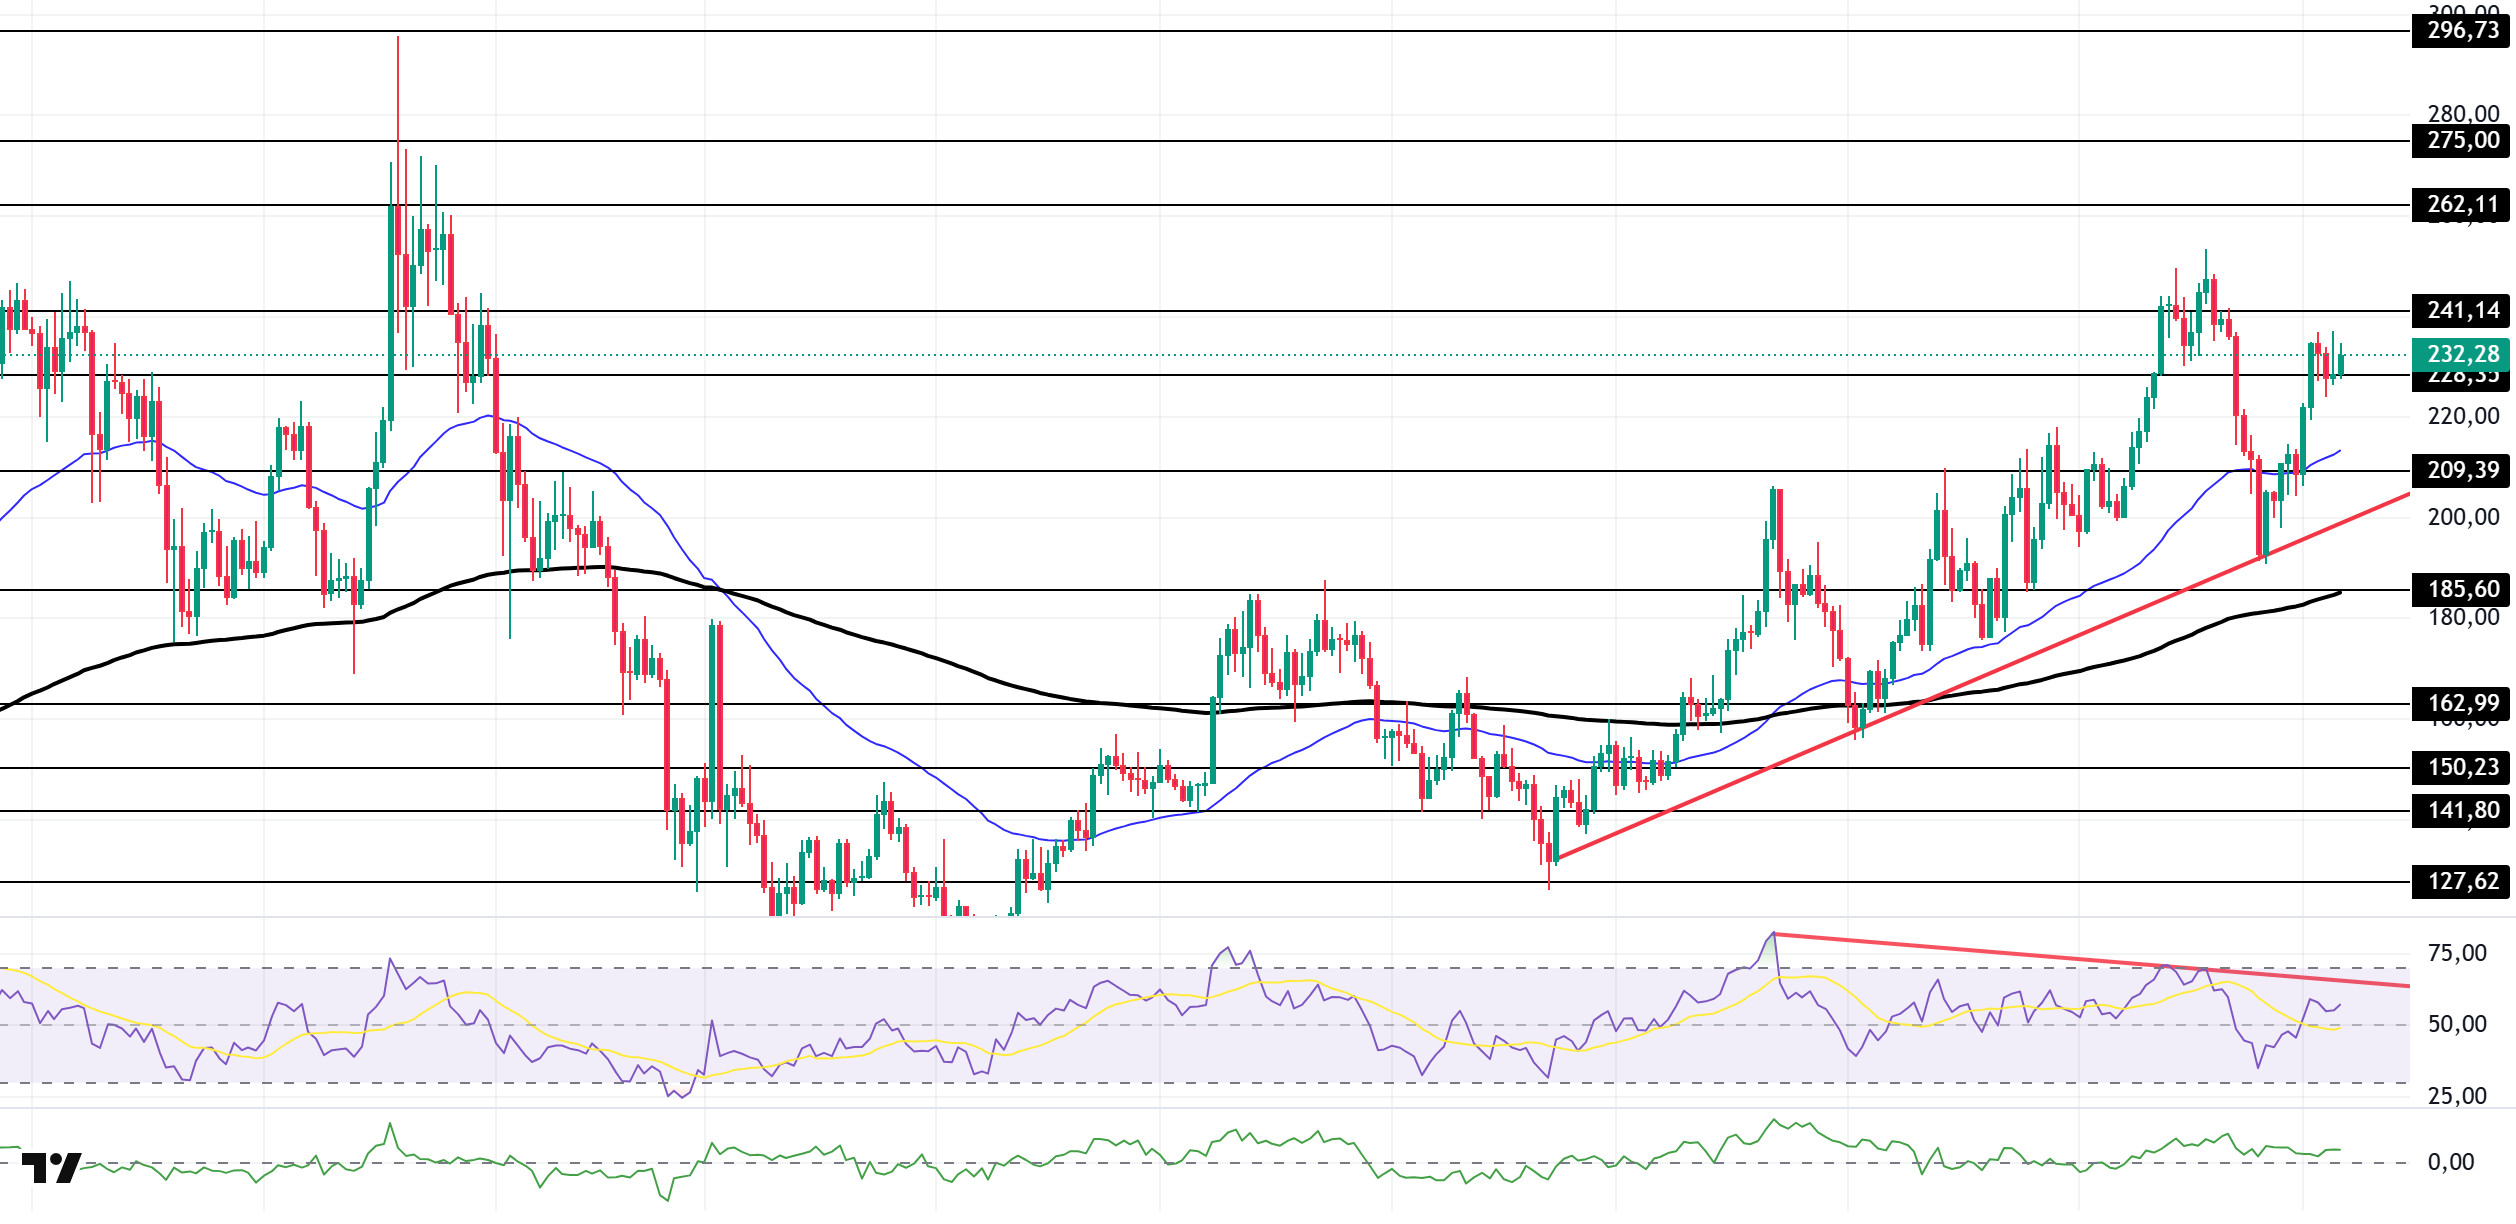
The SOL price showed an approximately 11% increase on the daily chart this week. The asset managed to stay in the upper region of the rising line that began on June 23. The price, supported by the base level of the rising line, maintained its momentum and broke above the 50 EMA (Blue Line) moving average, which is a strong resistance level. Currently testing the strong support level of $228.35 and continuing its upward movement, the price could rise to the level of $262.11, seen on January 20, and form a cup pattern if it maintains its upward momentum.
The asset is trading above the 50 EMA (Exponential Moving Average – Blue Line) and 200 EMA (Black Line) moving averages, indicating that the asset is in an uptrend. Furthermore, the 50 EMA remaining above the 200 EMA indicates the continuation of a technical “golden cross” formation. This shows that the medium-term upside potential continues. The RSI (14) has risen from negative to positive territory. At the same time, the indicator remained below the downward trend line that began on July 22. This indicates that selling pressure continues. The Chaikin Money Flow (CMF-20) remains in positive territory; at the same time, the increase in cash inflows could push the CMF-20 indicator to the upper levels of the positive zone. If macroeconomic data remains positive and developments in the ecosystem continue to be favorable, the first major resistance level of $262.11 could be retested. Conversely, in the event of potential negative news flow or deterioration in macro data, the $185.60 level could be monitored as a potential buying opportunity.
Supports: 228.35 – 209.39 – 185.60
Resistances: 241.14 – 262.11 – 275.00
DOGE/USDT
Thumzup Media provided Doge Hash with a $2.5 million loan to help expand its Dogecoin mining fleet. Buenos Aires now accepts Dogecoin for municipal taxes through the BA Crypto program.
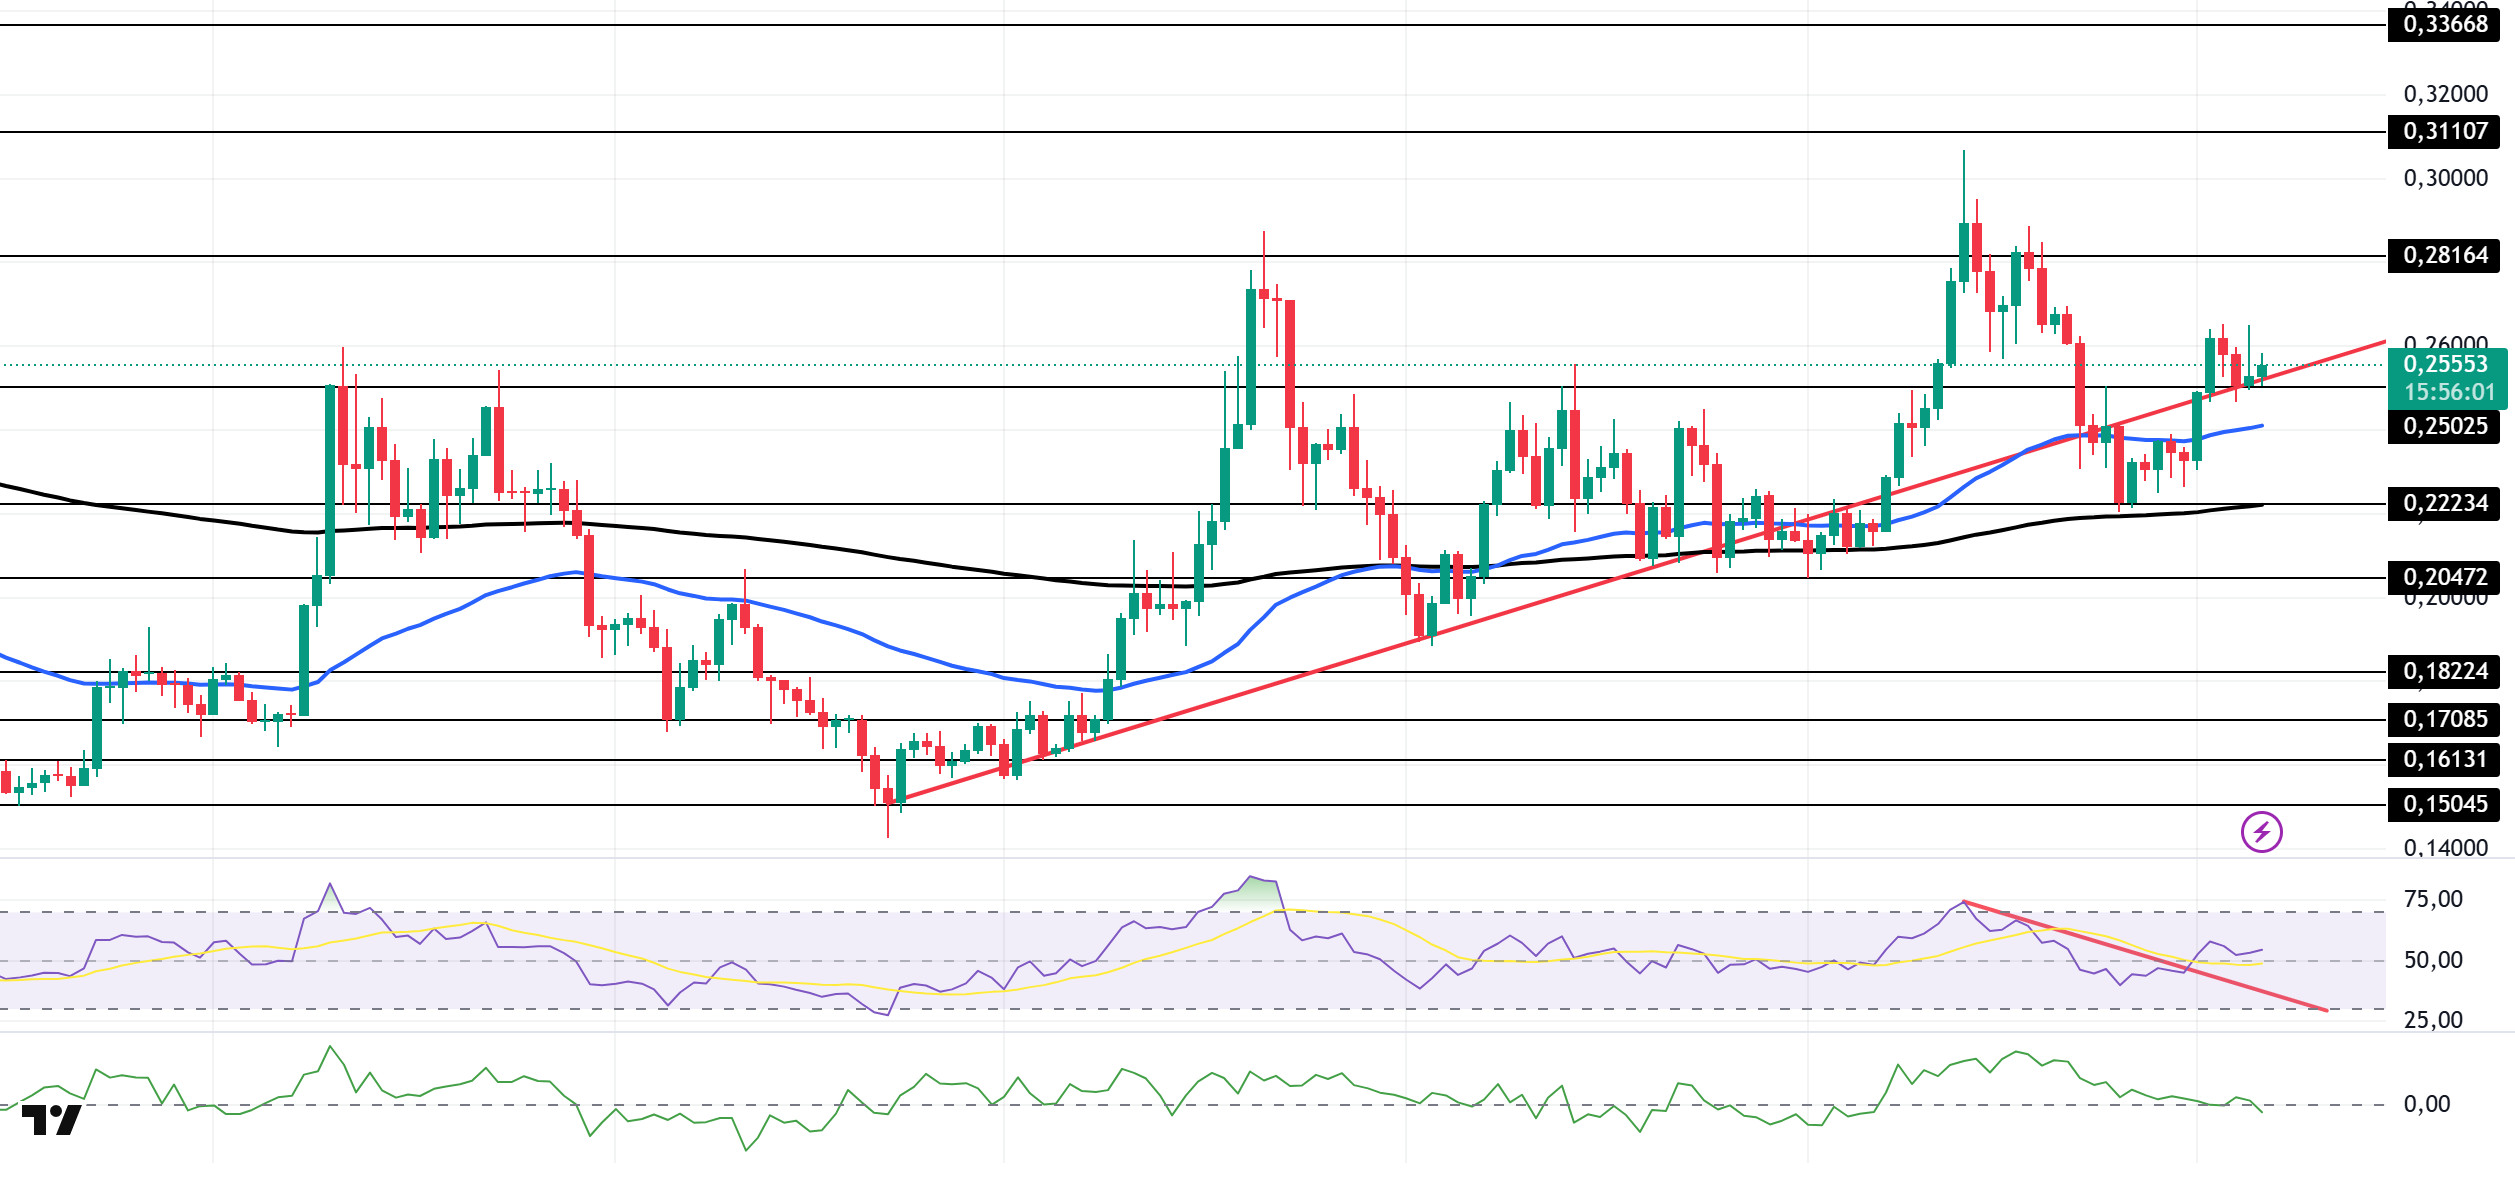
On the daily chart, DOGE has risen approximately 11% since last week. Testing the strong resistance level of $0.25025 and the rising trend that began on June 22 as resistance, the price broke through this level, maintained its momentum, and continued to stay above this level. Currently, the price is supported by the upward trend that began on June 22 and could retest the $0.28164 level if the uptrend continues. In case of a pullback, the 50 EMA (Blue Line) moving average can be monitored.
The asset is trading above the 50 EMA (Blue Line) and 200 EMA (Exponential Moving Average – Black Line) moving averages. This indicates that the asset is trending upward. On the other hand, the 50 EMA continues to be above the 200 EMA, indicating that the “golden cross” formation is continuing. This also signals that upward pressure may continue in the medium term. The Chaikin Money Flow (CMF–20) indicator has moved into negative territory. Money inflows continue to decline. This could push the CMF-20 deeper into negative territory. Looking at the Relative Strength Index (RSI-14) indicator, it has rebounded from negative to positive territory, moving towards the upper region of the downtrend that has been ongoing since September 13. This indicates that buying pressure is building. In the event of macroeconomic risks or negative news from the ecosystem, the $0.22234 level can be monitored as a strong support. On the other hand, if the upward movement gains strength, the $0.28164 level comes to the fore as the first strong resistance level.
Supports: 0.25025 – 0.22234 – 0.20472
Resistances: 0.28164 – 0.31107 – 0.33668
TRX/USDT
Sun Perp, a futures-focused decentralized exchange built on the TRON network, recorded a total trading volume of $433 million last week, marking a remarkable growth in derivatives market activity on the network.
The TRON network generated a total of $54.9 million in revenue last week. It increased its revenue by $1.1 million compared to the previous week and continues to be the ecosystem generating the most revenue among all blockchain networks. The continued steady increase in network revenues will contribute to TRON maintaining its leading position in the DeFi and stablecoin markets.
During the week of September 29 – October 5, 2025, a total of 26.8 million TRX were burned on the TRON network. Despite this, the circulating supply increased by 616,000. The increase in circulating supply creates inflationary pressure on TRX. Additionally, the total number of addresses also increased by 1.6 million to reach 336.7 million during the same week.
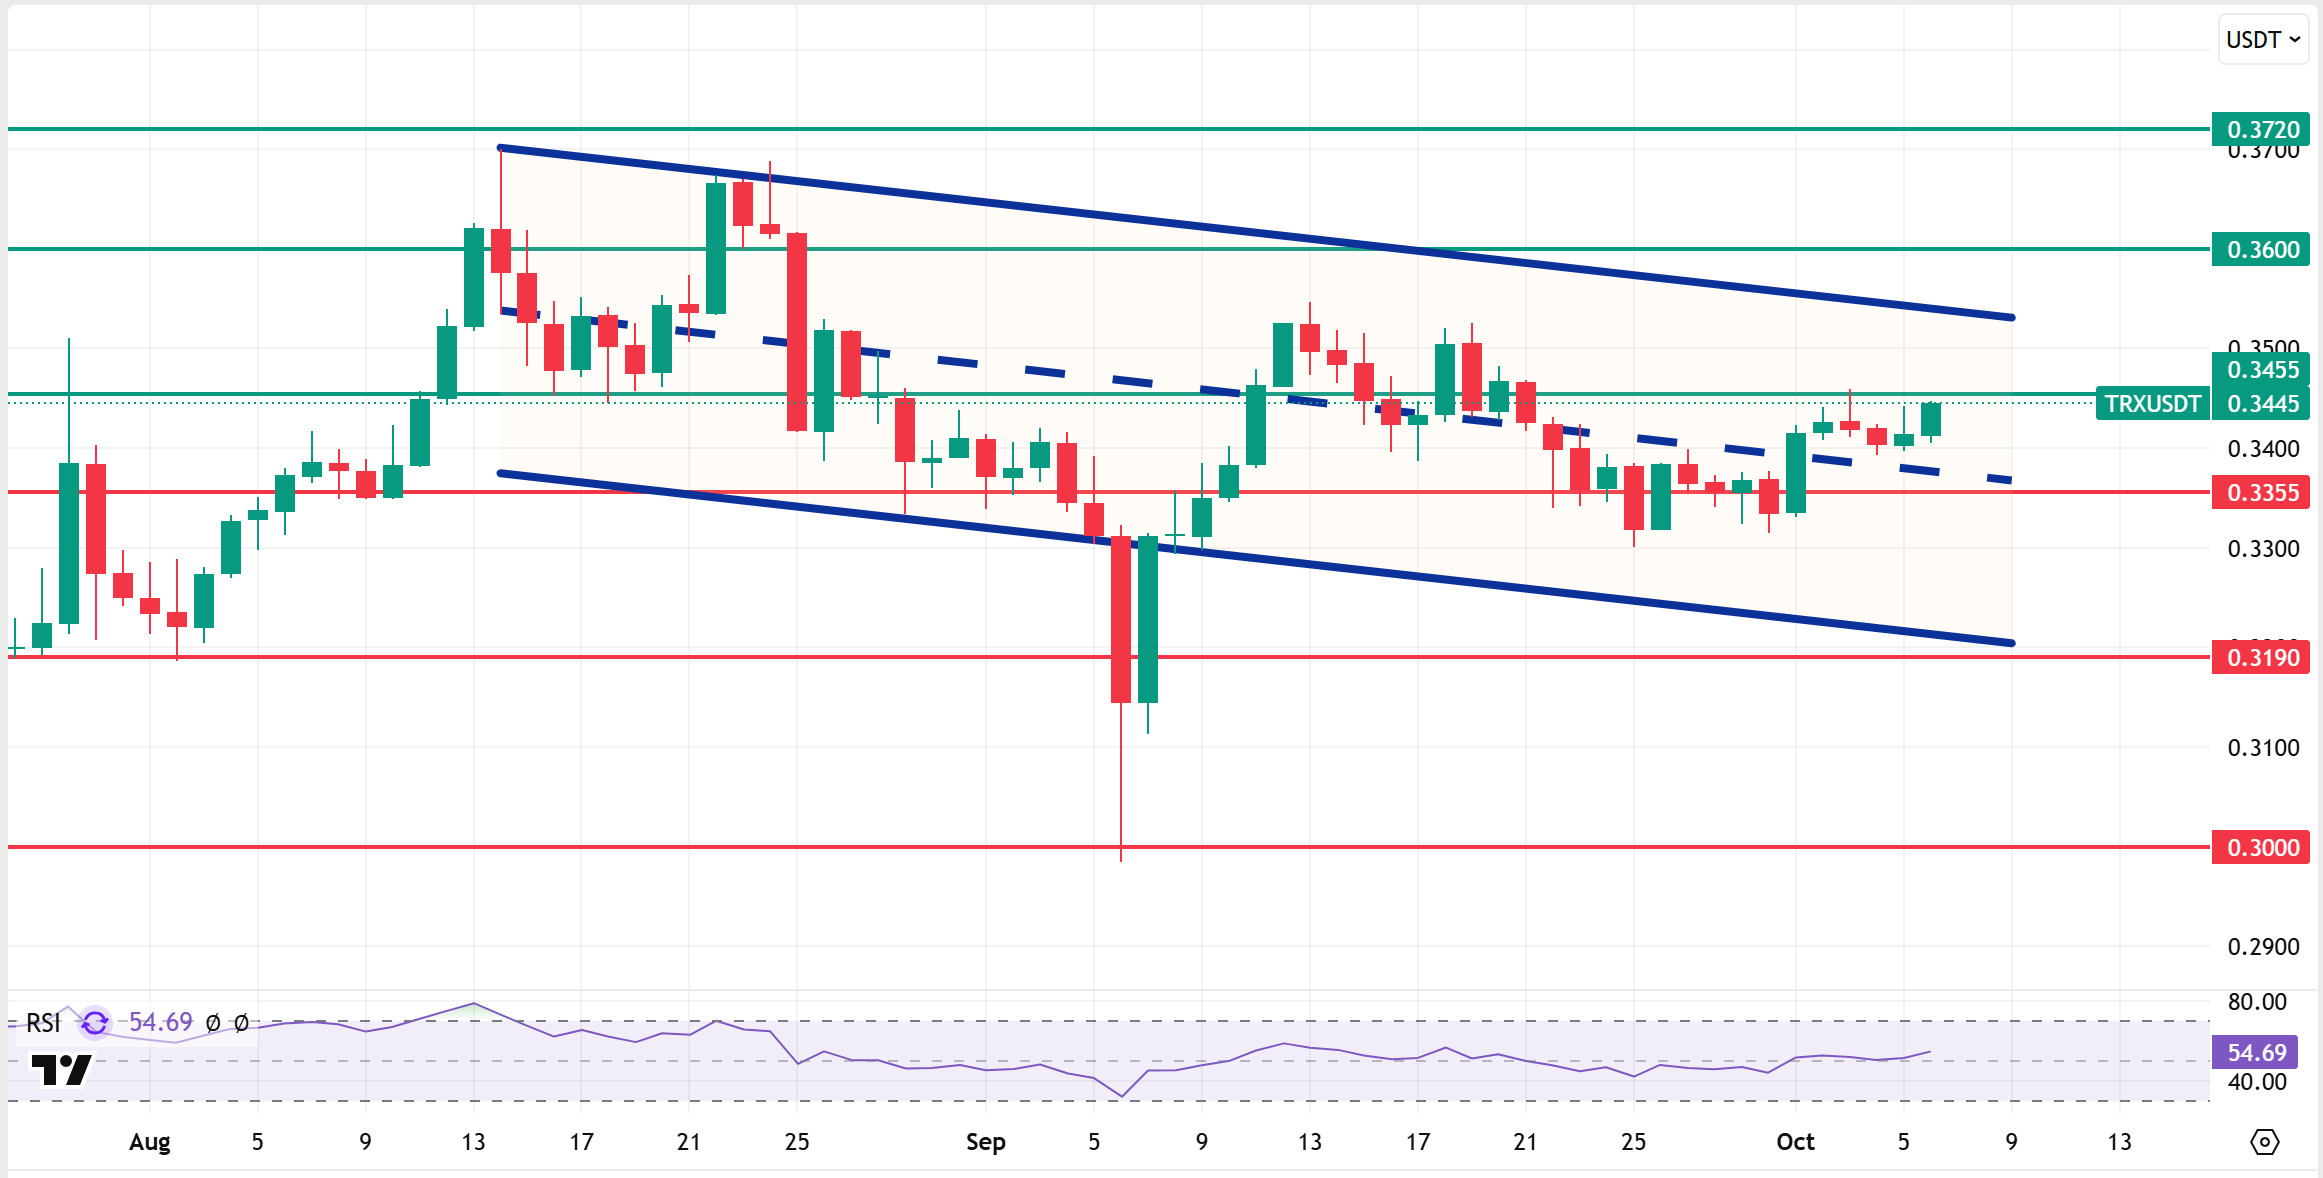
Technically speaking, TRX started the week at 0.3356 and rose approximately 2% throughout the week, closing at 0.3414. Thus, it ended the week with an increase, ending two consecutive weeks of decline, and its market value reached $32.3 billion. Currently trading at 0.3445, TRX is just above the middle band of the bearish channel on the daily chart and is attempting to break through the 0.3455 resistance level. The Relative Strength Index (RSI) value is observed to be in the buy zone at 54. Considering its position within the bearish channel and the RSI indicator, the TRX price may rise slightly. This indicates that it may move towards the upper band of the channel. In such a case, it may test the 0.3455 resistance level. If it closes above the 0.3455 resistance level, it may test the 0.3600 resistance level. If it fails to close above the 0.3455 resistance level and selling pressure increases in the market, it may decline due to potential selling from this area. In such a case, it may move towards the middle band of the bearish channel and test the 0.3355 support level. The 0.3000 level is being monitored as a critical support point on the daily chart. Staying above this level could maintain the upward trend, while closes below it could lead to increased selling pressure and deeper downward price movements.
Supports: 0.3355 – 0.3190 – 0.3000
Resistances: 0.3455 – 0.3600 – 0.3720
AVAX/USDT
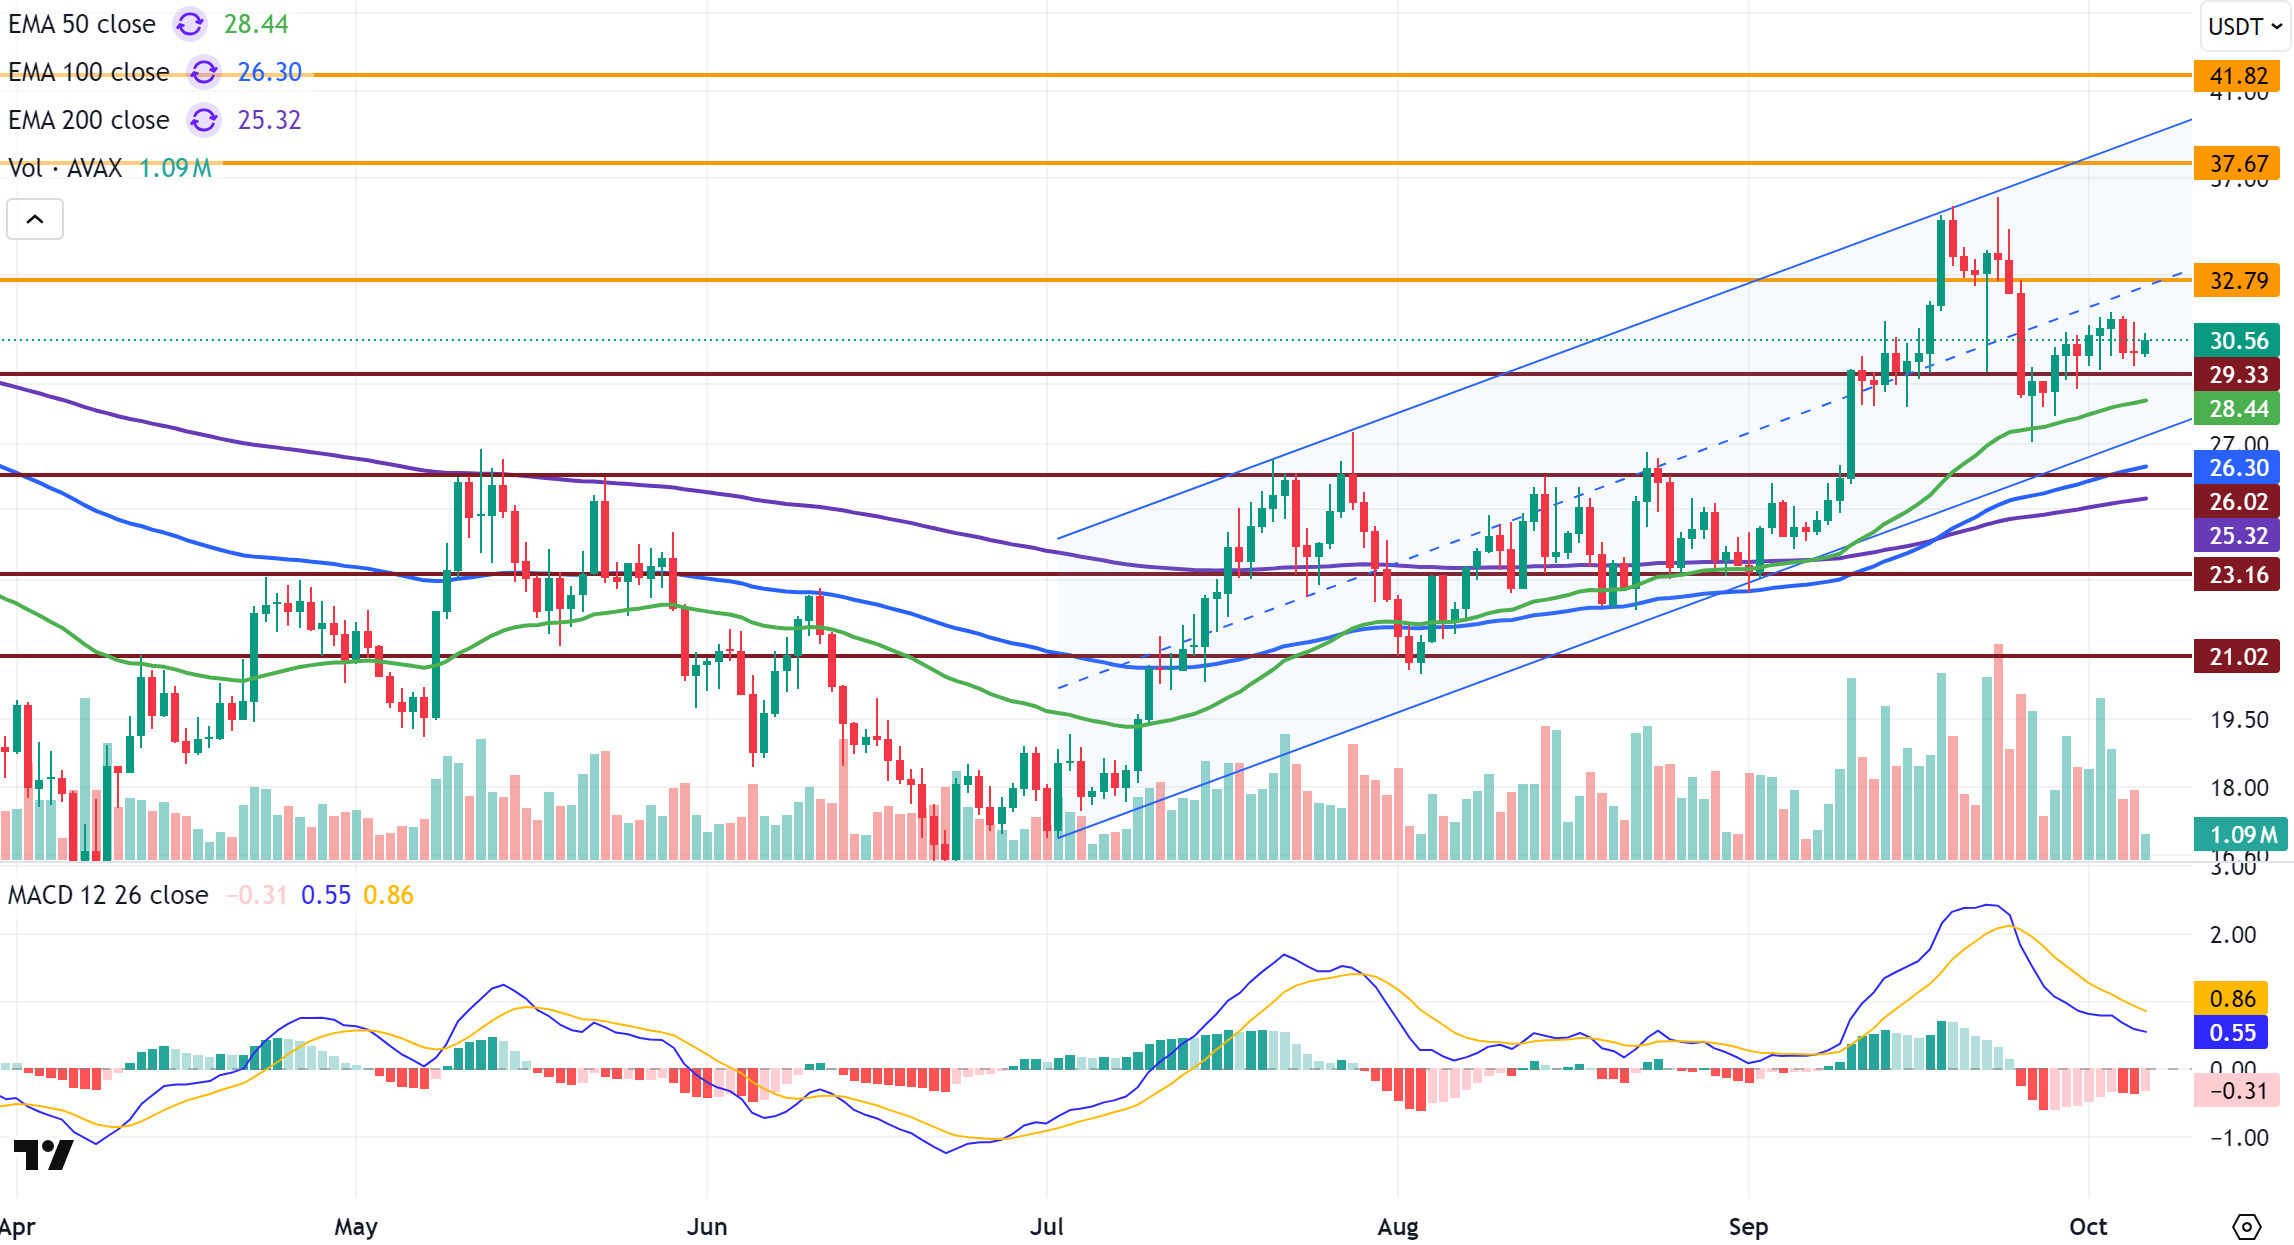
Starting last week at $30.01, AVAX traded within a narrow range throughout the week and closed at $30.07. Thus, a limited increase of approximately 0.20% was recorded on a weekly basis. While the price movement was generally flat, the bullish channel structure that has continued since July remained intact. AVAX is still priced in the middle of this channel. On the ecosystem side, institutional interest was clearly prominent last week as well. Although this has not had a significant impact on the AVAX price in the short term, new integrations and projects on the network are gaining momentum, and the ecosystem is gradually moving towards a more mature structure. Increased institutional demand and active moves by the Foundation could pave the way for positive price movements for AVAX in the medium and long term.
On the daily chart, AVAX tested the $29.33 support level during its decline last week and managed to hold above this area. However, sufficient momentum for an upward breakout has not yet formed. The Moving Average Convergence/Divergence (MACD) indicator continues to trade below the signal line, maintaining a negative outlook. The continued weakness of momentum is limiting gains in the short term. However, AVAX continues to trade above critical Exponential Moving Average (EMA) levels, indicating that the positive technical structure remains intact in the medium term.
In the coming period, if the MACD line crosses above the signal line and AVAX closes above the $32.79 level, the uptrend could regain strength. In this case, the $37.67 and $41.82 levels could come into play as the next resistance zones. In the opposite scenario, if it falls below the $29.33 support level, selling pressure could deepen and AVAX could retreat to the $26.02 and then $23.16 levels. In the overall picture, the MACD side is negative, while the EMA side continues to produce positive signals. This situation indicates that AVAX has not yet found its clear direction. Maintaining stability above $30 and confirming positive momentum are critical for the resumption of the uptrend. Otherwise, the sideways movement may continue for a while longer.
(EMA50: Green Line, EMA100: Blue Line, EMA200: Purple Line)
Supports: 29.33 – 26.02 – 23.16
Resistances: 32.79 – 37.67 – 41.82
SHIB/USDT
This week, the Shiba Inu ecosystem stood out in terms of security enhancements, infrastructure improvements, and tightening supply dynamics. The Shibarium network resumed operations on October 4, following a roughly 10-day outage after the September 12 bridge exploit. All validator keys were rotated, over 100 critical contracts were moved to multi-signature wallets, and the withdrawal waiting period was extended to approximately 24 hours to detect potential exploits. Developer Kaal Dhairya reported that the exploit combined a fake checkpoint injection with an unauthorized delegation of 4.6 million BONE, that the assets were recovered, that record integrity was ensured with StakeManager fixes, and that the Plasma/PoS bridges are being prepared for a phased reopening with additional precautions. A limited and phased compensation plan for affected users is being developed. During the same period, the decline in Shibarium daily transactions to 7,500 signaled a temporary dip in adoption, while marketing lead Lucie emphasized the strengthened security framework with the message “wounded but not broken.”
On the infrastructure side, the official RPC endpoint was consolidated into a single address (rpc.shibarium.shib.io) with the integration of dRPC.org, simplifying validator setup documentation. On the supply front, the SHIB burn rate reached 5.7 million burns with a 2033% increase in 24 hours, showing a 438% weekly rebound, while on the LEASH side, the completed LEASH v2 transition plans to permanently fix the total supply at 107,000 and burn the unclaimed tokens remaining in v1. While “Uptober”-themed solidarity campaigns continue within the community, the overall picture points to medium- to long-term confidence and supply tightness, driven by a combination of strengthened security architecture, consolidated infrastructure, increased burn momentum, and LEASH supply discipline.
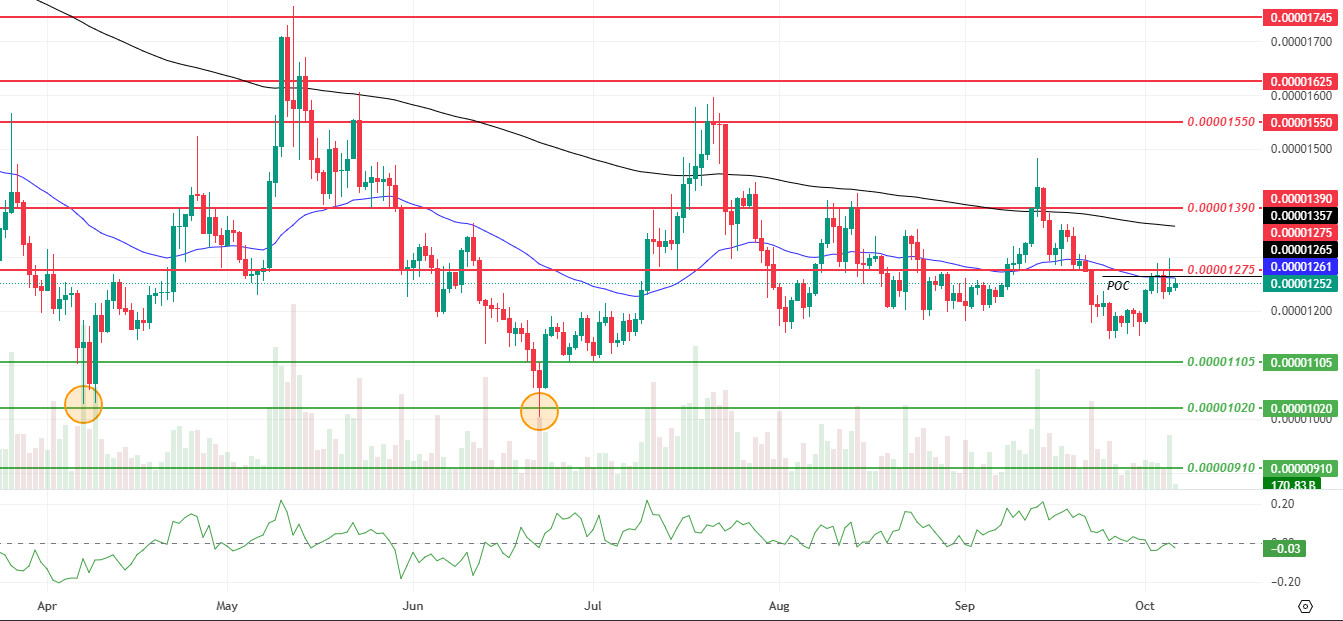
The short-term technical picture is mixed. Increased momentum and trading volume support a reactive rebound, while declining volatility keeps price action within a narrow range. The Chaikin Money Flow (CMF) moving into negative territory signals weakening capital inflows accompanying upward attempts, calling into question the sustainability of the rebound. Although last week closed above the Point of Control (POC) level of selling pressure became apparent at the first resistance level of $0.00001275, and the price fell below this week’s POC level of $0.00001265.
Currently hovering around the $0.00001250 level, for the bullish scenario to gain strength, it is necessary to close above the 50-day Exponential Moving Average (EMA) at $0.00001260 and then retake the $0.00001265 POC and $0.00001275 resistance band with volume. If sustainability is achieved above this threshold, the $0.00001320 and $0.00001390 levels remain on track as incremental targets. Conversely, if weakness persists below the $0.00001250 level, the $0.00001224 level acts as an intermediate support, and below that, the $0.00001190 and $0.00001170 levels as a band, and in the broader picture, the $0.00001105 and $0.00001020 levels as a defense line. In summary, we can say that the upward movement is likely to remain corrective in nature without confirmation of a close above the EMA 50 and persistence above the POC. The CMF’s movement in the negative zone also supports this cautious outlook. (EMA200: Black line, EMA50: Blue line)
Supports: 0.00001105 – 0.00001020 – 0.00000910
Resistances: 0.00001275 – 0.00001390 – 0.00001550
LTC/USDT
Litecoin (LTC) ended last week with an 11.20% increase, starting the new week at $118.85. Gaining 1.05% against Bitcoin during the same period, LTC’s market value reached approximately $9.2 billion. Thus, it moved up one spot in the market cap rankings to 19th place. In the futures market, open positions increased by 1% on a weekly basis, while funding rates remained in positive territory.
Looking at the liquidation map, it is seen that the positions of investors trading on centralized exchanges (CEX) are largely bullish (long). A significant portion of these positions can be liquidated at the $116.4 level. On the other hand, long positions opened on decentralized exchange (DeFi) platforms can be liquidated at the $91.22 level. This table shows that both CEX and DeFi users generally maintain their upward expectations, but CEX investors have a higher risk appetite in terms of leverage ratio. Finally, the fact that Litecoin’s trading volume is largely concentrated on centralized exchanges reveals that CEXs play a more effective role in Litecoin’s price in terms of total position size.
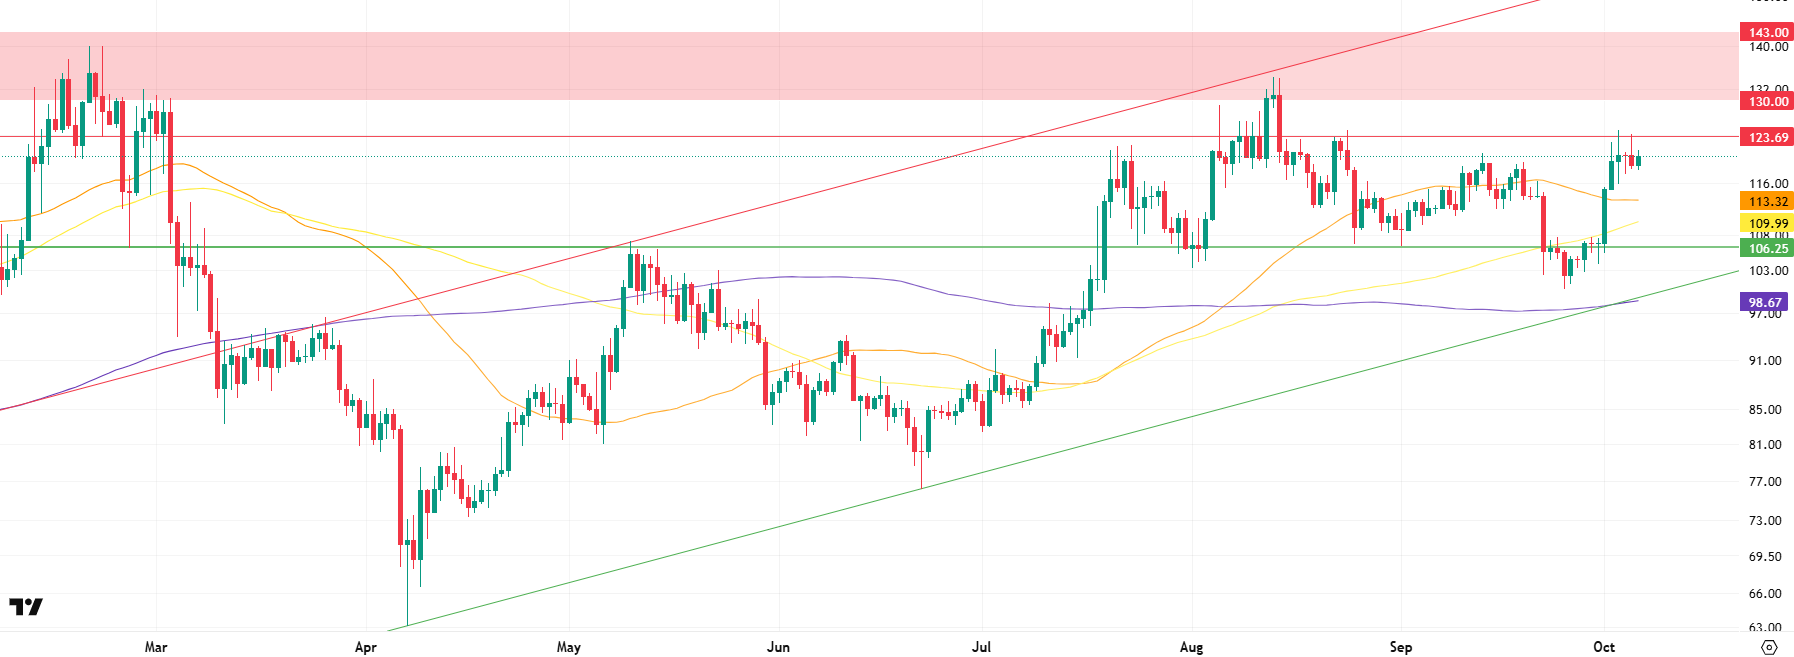
Litecoin is currently trading above all major moving averages, indicating that the uptrend is technically intact. The price appears to have lost momentum at the horizontal resistance line at $123.69. If daily closes occur above this level, the price is expected to move towards the $130.00 – $143.00 band. $130.00 is initially a horizontal resistance level, while the $130.00 – $143.00 range is a risky and wide band for trading due to high volatility. On the other hand, closes above the $143.00 level could support the price accelerating towards the upper band of the rising channel. In this scenario, Litecoin’s technical structure shows a strengthening medium-term uptrend.
In potential pullbacks, the $113.32 level, where the 50-period moving average (orange line) passes, stands out as Litecoin’s first strong support. This area, having been a zone where the price has reacted several times recently, represents the first line of defense where short-term buyers could re-enter. In the event of a decline below this level, the horizontal support at $106.25 could act as a second key area to limit the downtrend. Notably, this level has historically stood out both in terms of volume intensity and price reactions. Therefore, increased buyer pressure in this region is a likely scenario. In the event of a deeper pullback, the $98.67 level emerges as a critical threshold. This level forms a technically strong support area, as it is both the lower band of the rising channel and the intersection of the 200-period moving average (purple line). Should the price retreat to these levels, it could present an attractive buying opportunity for investors. Overall, Litecoin is expected to encounter gradual buyer interest across these three support levels. However, sustained pricing below $113.32 would signal the first technical indication of weakening medium-term momentum.
Supports: 113.32 – 106.25 – 98.67
Resistances: 123.69 – 130.00 – 143.00
BNB/USDT
Looking at the key developments this week, the 2Z and MORPHO projects in the BNB ecosystem have been listed on Binance Launchpool. These listings are expected to increase demand for BNB, which is used for transaction fees, and reduce the circulating supply through users staking BNB. This situation is expected to have a generally positive impact on the price of BNB.
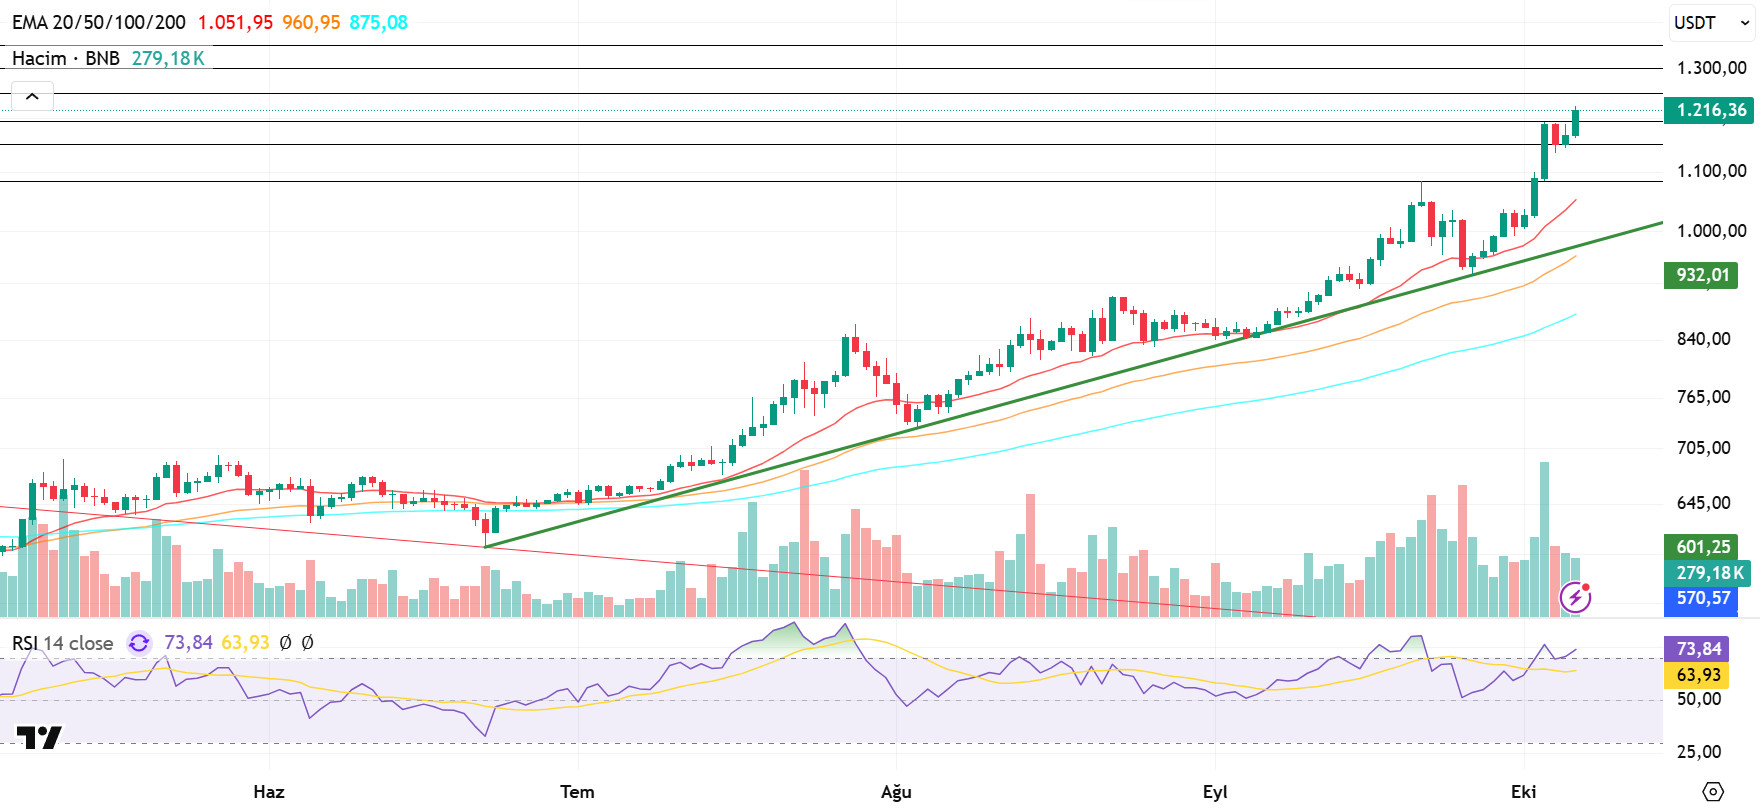
From a technical perspective, BNB/USDT, which ended its correction movement starting from the previous all-time high (ATH) of $1,083 at the $940 level, continued its rise with strong support from this region and reached new ATH levels.
Technical indicators for BNB/USDT, currently trading in the $1,200–1,250 range, show that the recent increase in trading volume has supported buying. This picture indicates that the positive outlook in the market is gaining strength. Furthermore, the Relative Strength Index (RSI) fell to the 50 level following recent pullbacks; however, it found support at these levels and resumed its upward trajectory. This technical structure indicates that positive momentum in BNB is strengthening.
Within the current outlook, if buying appetite is maintained, BNB is expected to test the $1,250 resistance level in the first stage. If this level is broken, the price could move towards the $1,300 and $1,350 levels, respectively. On the other hand, if selling pressure increases, the price may retreat back to the $1,200 support level. If this level is broken downward, the $1,150 and $1,085 levels emerge as critical areas to monitor.
Supports: 1,200 – 1,150 – 1,085
Resistances: 1,250 – 1,300 – 1,350
LINK/USDT
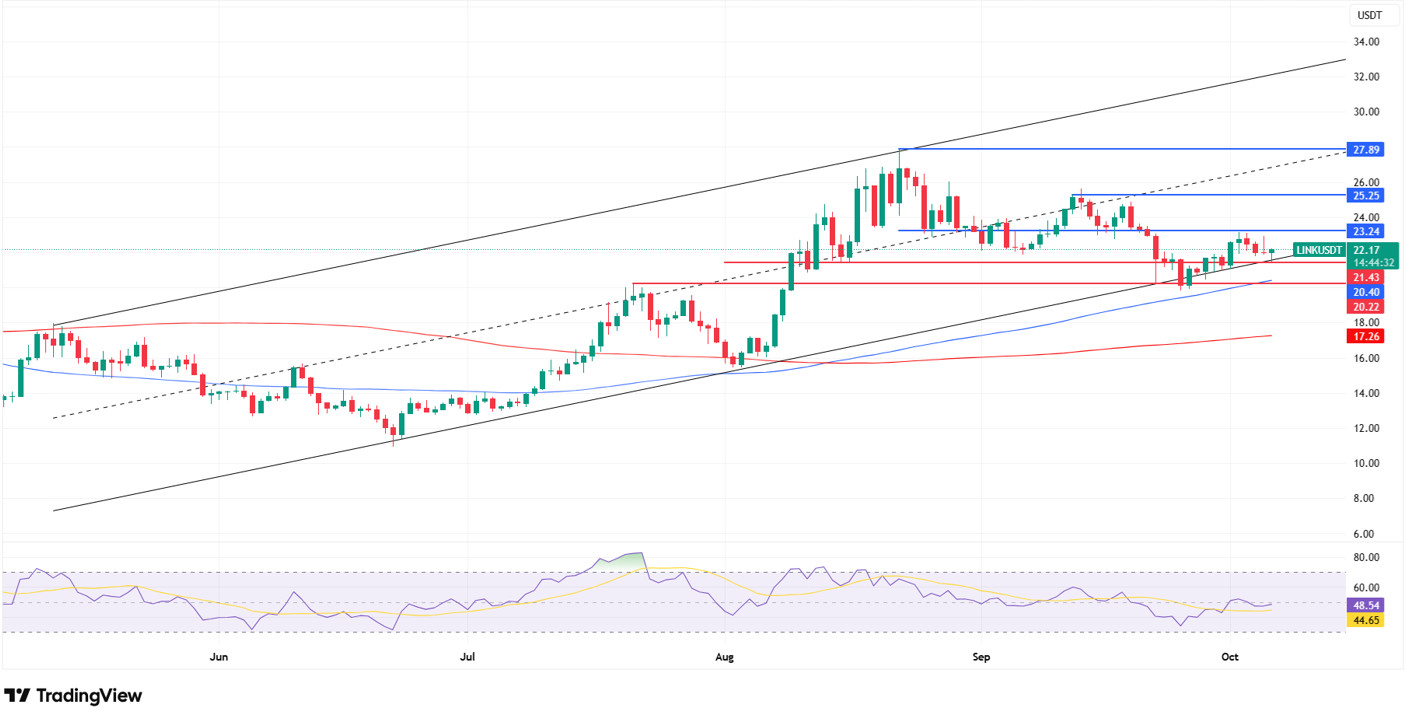
LINK has been trying to maintain its ascending channel structure since June 22, and with the recent pullbacks, the importance of the critical support levels we mentioned last week has increased. Especially after failing to hold above 21.85 in recent days, retreated to the 20.22 level, and with buyer reaction from this zone, upward attempts began again.
Currently, the price appears to be stabilizing around the 22.17 level, supported by the lower band of the channel. However, we see that this recovery remains limited, as it did in the previous period. Another noteworthy point on the chart is the weakening momentum in upward movements after the price lost the middle band of the channel. This indicates that the lower band of the channel, and especially the 20.22 level, has become quite critical in the medium term. If this support is retested and broken downward, the price risks retreating to the 18.00–17.26 band. This area is crucial for maintaining the main trend, as it is both a channel support and a strong demand zone.
On the upside, the 23.24 levels emerge as the nearest resistance area in the short term. If sustainability is achieved here, the possibility of a stronger upward wave towards the 25.25 and 27.80 levels will come to the fore. Daily closes supported by volume, especially in the 24.00–25.20 zone, could confirm the sustainability of the uptrend. On the Relative Strength Index (RSI) side, the indicator is at 48. While this points to a weak recovery effort, the RSI needs to rise above at least 55 to indicate strong momentum. Otherwise, the current upward movements may remain limited as reactionary rallies.
Supports: 21.43 – 20.22 – 17.26
Resistances: 23.24 – 25.25 – 27.89
SUI/USDT
This week, there were significant and noteworthy developments in the Sui (SUI) ecosystem. In particular, Sui’s collaboration with Threshold Network resonated in the cryptocurrency market. Thanks to this integration, tBTC (a decentralized token tied to Bitcoin) was brought to the Sui network. This is a major step towards expanding Sui’s DeFi capabilities. Additionally, the Sui team launched a $10 million program to enhance chain security, detect malicious dApps , and improve infrastructure, while some protocol upgrades and consensus mechanism improvements are planned at the infrastructure level.
Furthermore, a new $10 million security and innovation fund announced by the Sui Foundation is another important development in the ecosystem. Under this fund, support is planned for various projects to increase network security, detect malicious applications, and reduce risks on the chain. The fund also aims to help developers build more robust infrastructures.
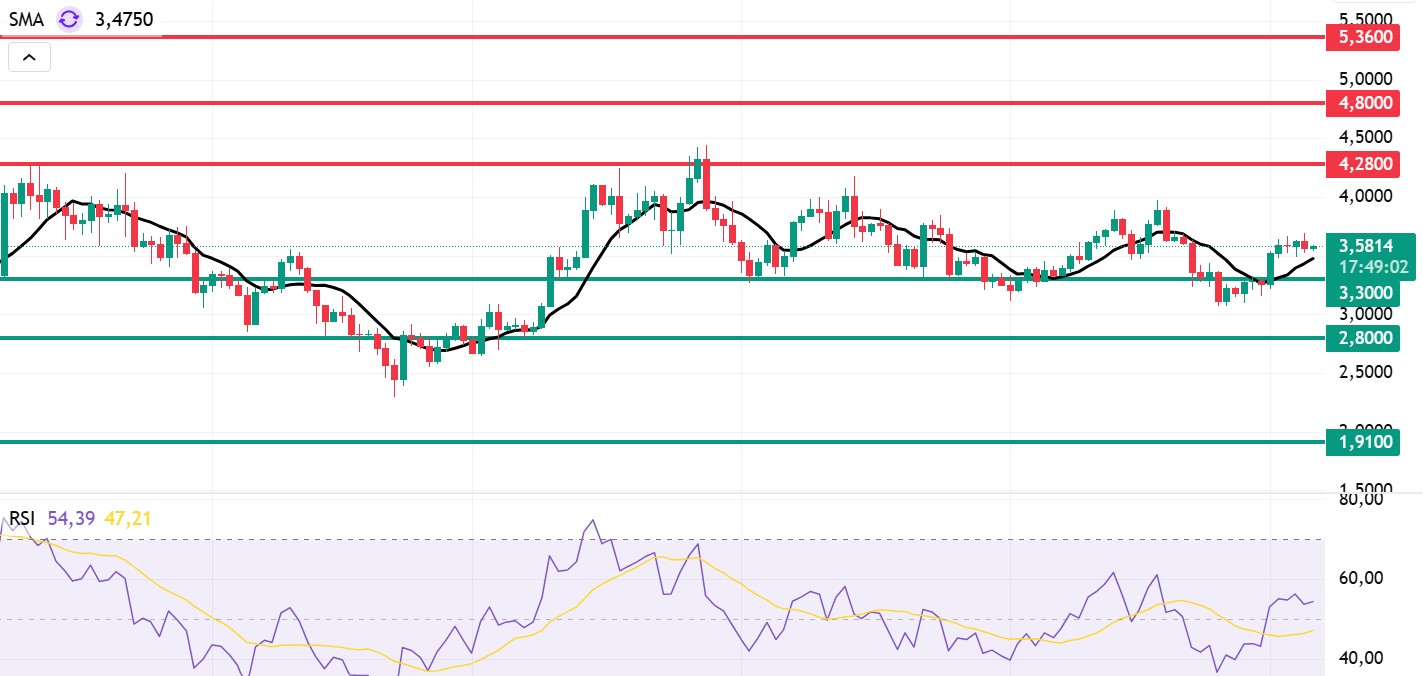
Looking at Sui’s technical outlook following recent developments, we see that the price has been moving sideways at around $3.58 on a weekly basis, influenced by fundamental developments. The Relative Strength Index (RSI) is currently in the range of 54.39 – 47.21. This range indicates that the market is trading close to the sell zone; however, if the RSI weakens and falls to the 35.00 – 40.00 range, it could signal a potential buying point. If the price moves upward, the resistance levels of $4.28, $4.80, and $5.36 can be monitored. However, if the price falls to new lows, it could indicate that selling pressure is intensifying. In this case, the support levels of $3.30, $2.80, and $1.91 come to the fore. Based on the trend line, a pullback to $2.80 appears technically possible. According to Simple Moving Averages (SMA) data, Sui’s average price is currently at $3.47. The price remaining above this level indicates that the current uptrend could technically continue.
Supports: 1.91 – 2.80 – 3.30
Resistances: 4.28 – 4.80 – 5.36
ADA/USDT
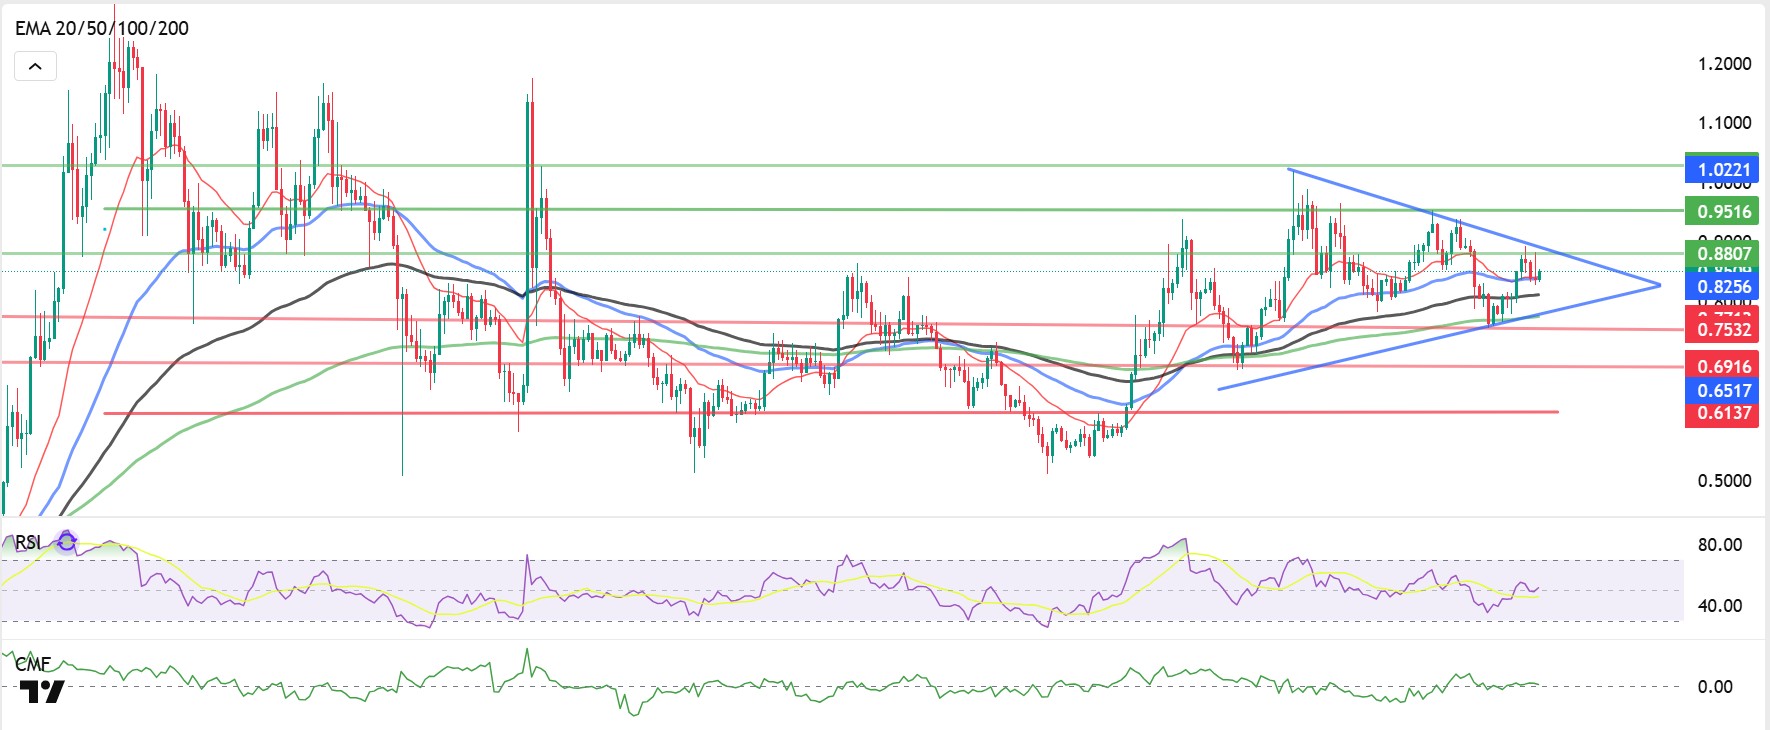
The Cardano price started the week with bullish signals, rising to the 0.8807 level. One of the most significant news items driving the rise was Google Cloud’s announcement that it would join Cardano by running a Validator Node. This partnership is not only about supporting transactions; Google Cloud also stated that it would host Cardano ecosystem tokens such as NIGHT. This move strengthens Cardano’s credibility and bolsters its network with the support of one of the world’s leading cloud providers. Looking at chain data, it reveals that over 15 billion ADA have been held in wallets without movement for over a year. Derivative data indicates that the vast majority of investors’ positions on are long, reaching up to 79.04%. This shows that a significant portion of the circulating supply is held by long-term investors and that selling pressure has decreased. This situation significantly increases the upward confidence among market participants.
Technically, ADA continues to move within a tight symmetrical triangle channel band. The price may head towards the first resistance level of $0.9176 during the week, accompanied by rebound buying. If this level is broken, it is likely to reach the $0.9280 level, which is the peak of the rising channel within the major trend. The fact that the price is currently trading above all moving averages indicates that the uptrend is strengthening. Remaining above the 20-day exponential moving average (EMA-20, Red Line) and 50-day exponential moving average (EMA-50, Blue Line) levels is critical for the sustainability of the uptrend. The Relative Strength Index (RSI) has fallen to 49, approaching negative territory. On the other hand, the Chaikin Money Flow (CMF-20) indicator has fallen to 0.01, indicating continued selling potential in the market. The decline in cash inflows supports the CMF remaining in negative territory and creates a downward correlation with the RSI. From a technical perspective, confirmation signals for a buying effect have not yet emerged.
From a fundamental perspective, this week’s expected NFP data and other macroeconomic data, possible statements by FED members, or potential corporate/strategic purchases in the Cardano ecosystem are among the factors that could support the price moving towards the strong resistance level of $0.9280. However, in the event of potential selling pressure in the markets, the $0.7851 level should be monitored as a critical support point.
Supports: $0.7851 – $0.7566 – $0.7170
Resistances: 0.9982 – 0.9636 – 0.9280
Legal Notice
The investment information, comments, and recommendations contained in this document do not constitute investment advisory services. Investment advisory services are provided by authorized institutions on a personal basis, taking into account the risk and return preferences of individuals. The comments and recommendations contained in this document are of a general nature. These recommendations may not be suitable for your financial situation and risk and return preferences. Therefore, making an investment decision based solely on the information contained in this document may not result in outcomes that align with your expectations.