Technical Analysis
BTC/USDT
As the December meeting approaches, Fed members’ divided stance on interest rate cuts is clouding the policy outlook, while data gaps caused by the government shutdown are further complicating employment and inflation assessments. On the geopolitical front, the US increasing pressure for a ceasefire in Ukraine and the China-Japan tension escalating with economic sanctions negatively impact risk sentiment, while Nvidia’s strong balance sheet was one of the rare positive developments supporting tech stocks.
From a technical perspective, BTC deepened its low level following the sharp selling pressure it encountered after the previous analysis and fell back to the 88,500 level. The price, which reacted from this region for the second time, gained momentum in the upward direction and reached the 93,000 level. Continuing to move within a downward trend structure, the price was trading at the 92,200 level at the time of writing the analysis.
Technical indicators reflect uncertainty, with the Wave Trend (WT) oscillator generating buy/sell signals in the oversold zone, while the histogram on the Momentum (SM) indicator is attempting to regain strength after reaching maximum weakness in the negative zone. The Kaufman Moving Average (KAMA) is currently positioned above the price at the $92,700 level.
According to liquidation data, the buy level occasionally attempts to establish density around 89,000, but this results in liquidation due to the price’s volatile movements. In contrast, the sell levels maintain their density at the 94,000 level, while intense accumulation continues within the 97,000–98,000 band.
In summary, while disagreements over December rate cut expectations in the Fed minutes and pressure from geopolitical developments stand out, Nvidia’s strong earnings report was the key factor driving the price. Technically, the price continued its downward momentum, pulling the new low to 88,500. Liquidity data shows that selling-heavy positions continue to dominate.Going forward, closing above the 90,000 level again will be critical for the price to gain momentum, and the 93,700 resistance level will be monitored once more in an upward movement. In the event of potential selling pressure, the 90,000 level will emerge as a critical reference area, and the 88,500 bottom zone will be monitored in case of a breakout.
Supports: 90,000 – 89,000 – 88,100
Resistances: 91,400 – 92,600 – 93,700

ETH/USDT
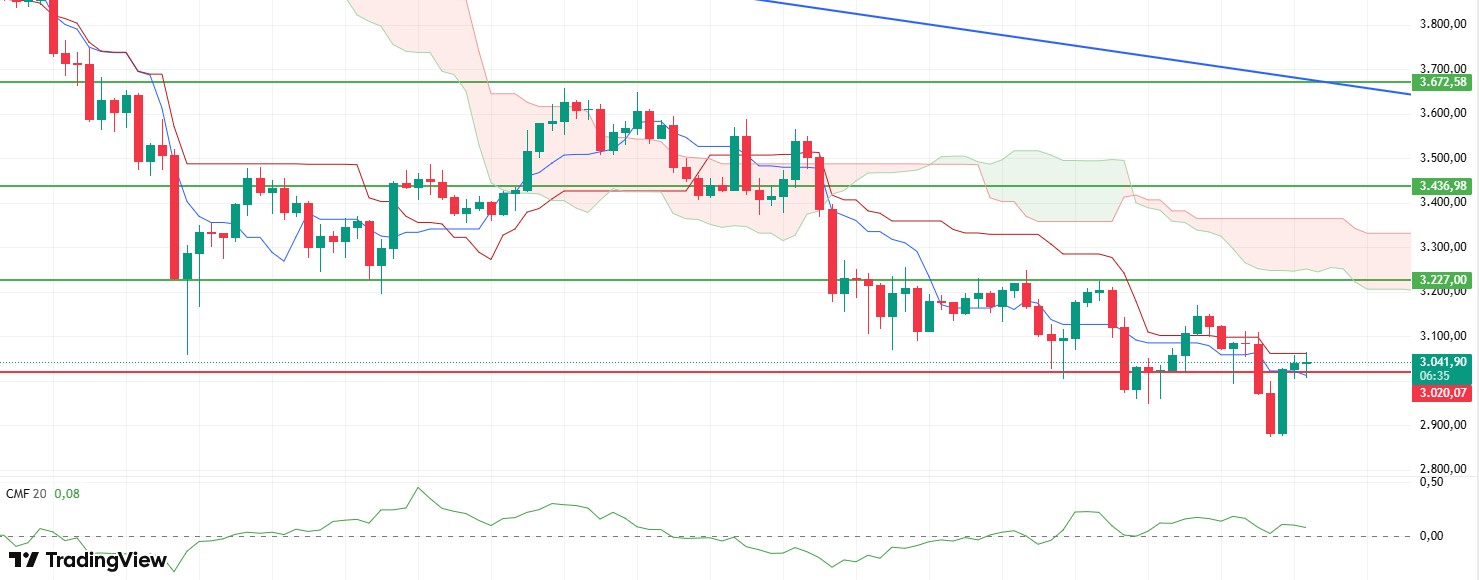
ETH fell to $2,875 after losing its $3,020 support late yesterday evening as selling pressure accelerated. Buying interest from this area in the morning pushed the price back above the $3,020 level. This rebound shows that buyers are still active in critical areas and that the market has not completely weakened.
The Cumulative Volume Delta (CVD) indicator reveals that the recent movement was primarily driven by sales in the futures market, while buying interest remained strong on the spot side. Strong spot buying emerged as the most important factor enabling the price to recover quickly despite the declines.
The Chaikin Money Flow (CMF) indicator remaining in positive territory confirms that liquidity flow is still buyer-dominated. This pattern carries significant signal value, particularly indicating that upward movements may continue in the short term. This resilience on the liquidity side helps limit downward price movements.
In the Ichimoku indicator, the price being squeezed between Tenkan and Kijun reveals a structure that supports short-term directional search. A closing price above the Kijun level of $3.062 could strengthen the price and make the short-term positive structure more pronounced. Conversely, the price failing to break above the lower band of the kumo cloud at $3.248 indicates that the overall trend remains weak.
Breaking above the $3,062 level during the day could fuel further upward attempts and pave the way for the price to retest the $3,170 and $3,227 zones. A decline below the $3,020 level, however, could increase selling pressure and bring a pullback towards the $2,950 and $2,875 regions back into focus. Therefore, whether these critical levels are maintained or not should be closely monitored for the short-term direction.
Below the Form
Supports: 3,020 – 2,760 – 2,550
Resistances: 3,227 – 3,436 – 3,672
XRP/USDT
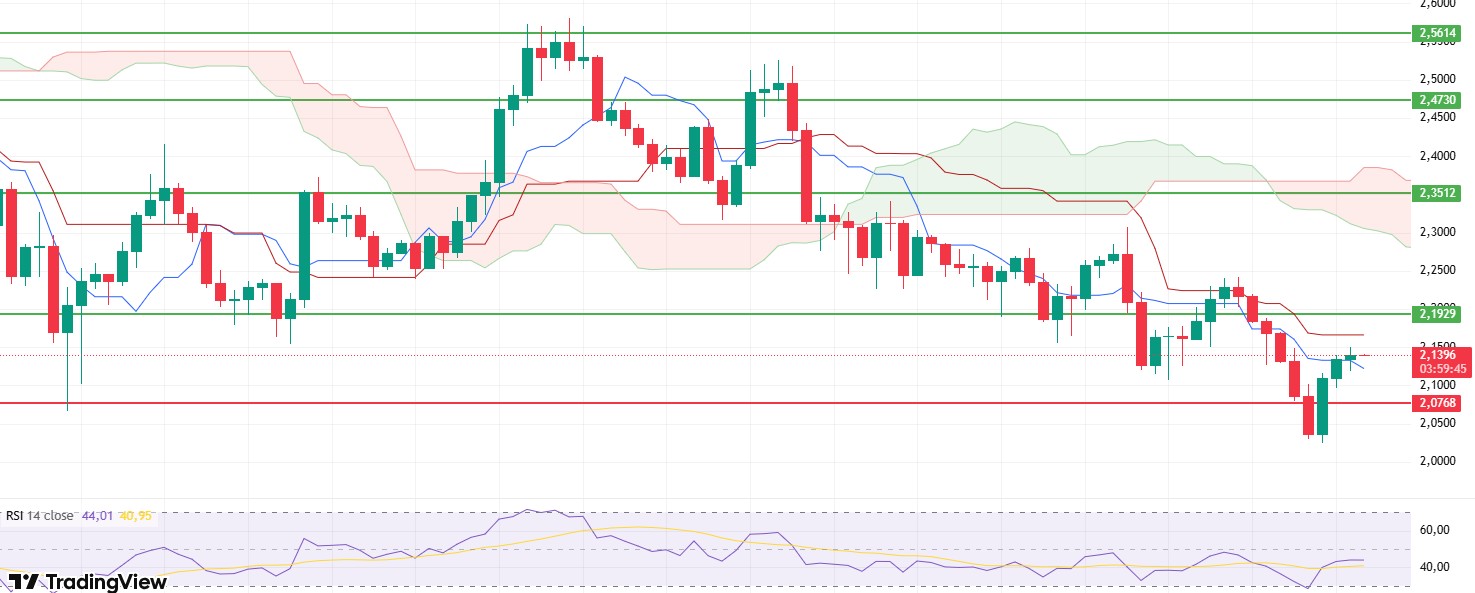
XRP experienced a sharp decline below expected levels yesterday, then quickly recovered to form a highly volatile pattern. After losing the $2.07 support level, the price dropped to $2.02 and then surged to $2.14 on strong buying pressure, creating a fake breakout. This price behavior indicates that sellers are still active, but buyers are also aggressively stepping in at certain levels.
The Chaikin Money Flow (CMF) indicator’s recovery to the zero line after falling into negative territory signals that liquidity flow has stabilized. With no strong entry or exit forming, the price continues to search for direction.
Although the Relative Strength Index (RSI) indicator’s rapid rebound to the 45 level after retreating to the overbought zone increases the risk of negative divergence in the short term, the momentum turning positive stands out as an important factor supporting upward movement.
The price breaking above the Tenkan level on the Ichimoku indicator maintains the short-term positive outlook. However, remaining below the Kijun and Kumo cloud levels indicates that the main trend has not yet turned positive. Even if there is a short-term rebound, the medium-term structure remains weak.
The focus for intraday pricing is clear. As long as the $2.07 level is maintained, upward movements are expected to continue. Losing this level could pave the way for renewed downward pressure and a retest of the $2.02 region.
Supports: 2.0768 – 1.9092 – 1.7729
Resistances: 2.1929 – 2.3512 – 2.4730
SOL/USDT
Solflare and Mastercard launched Solana’s first self-custody bank card.
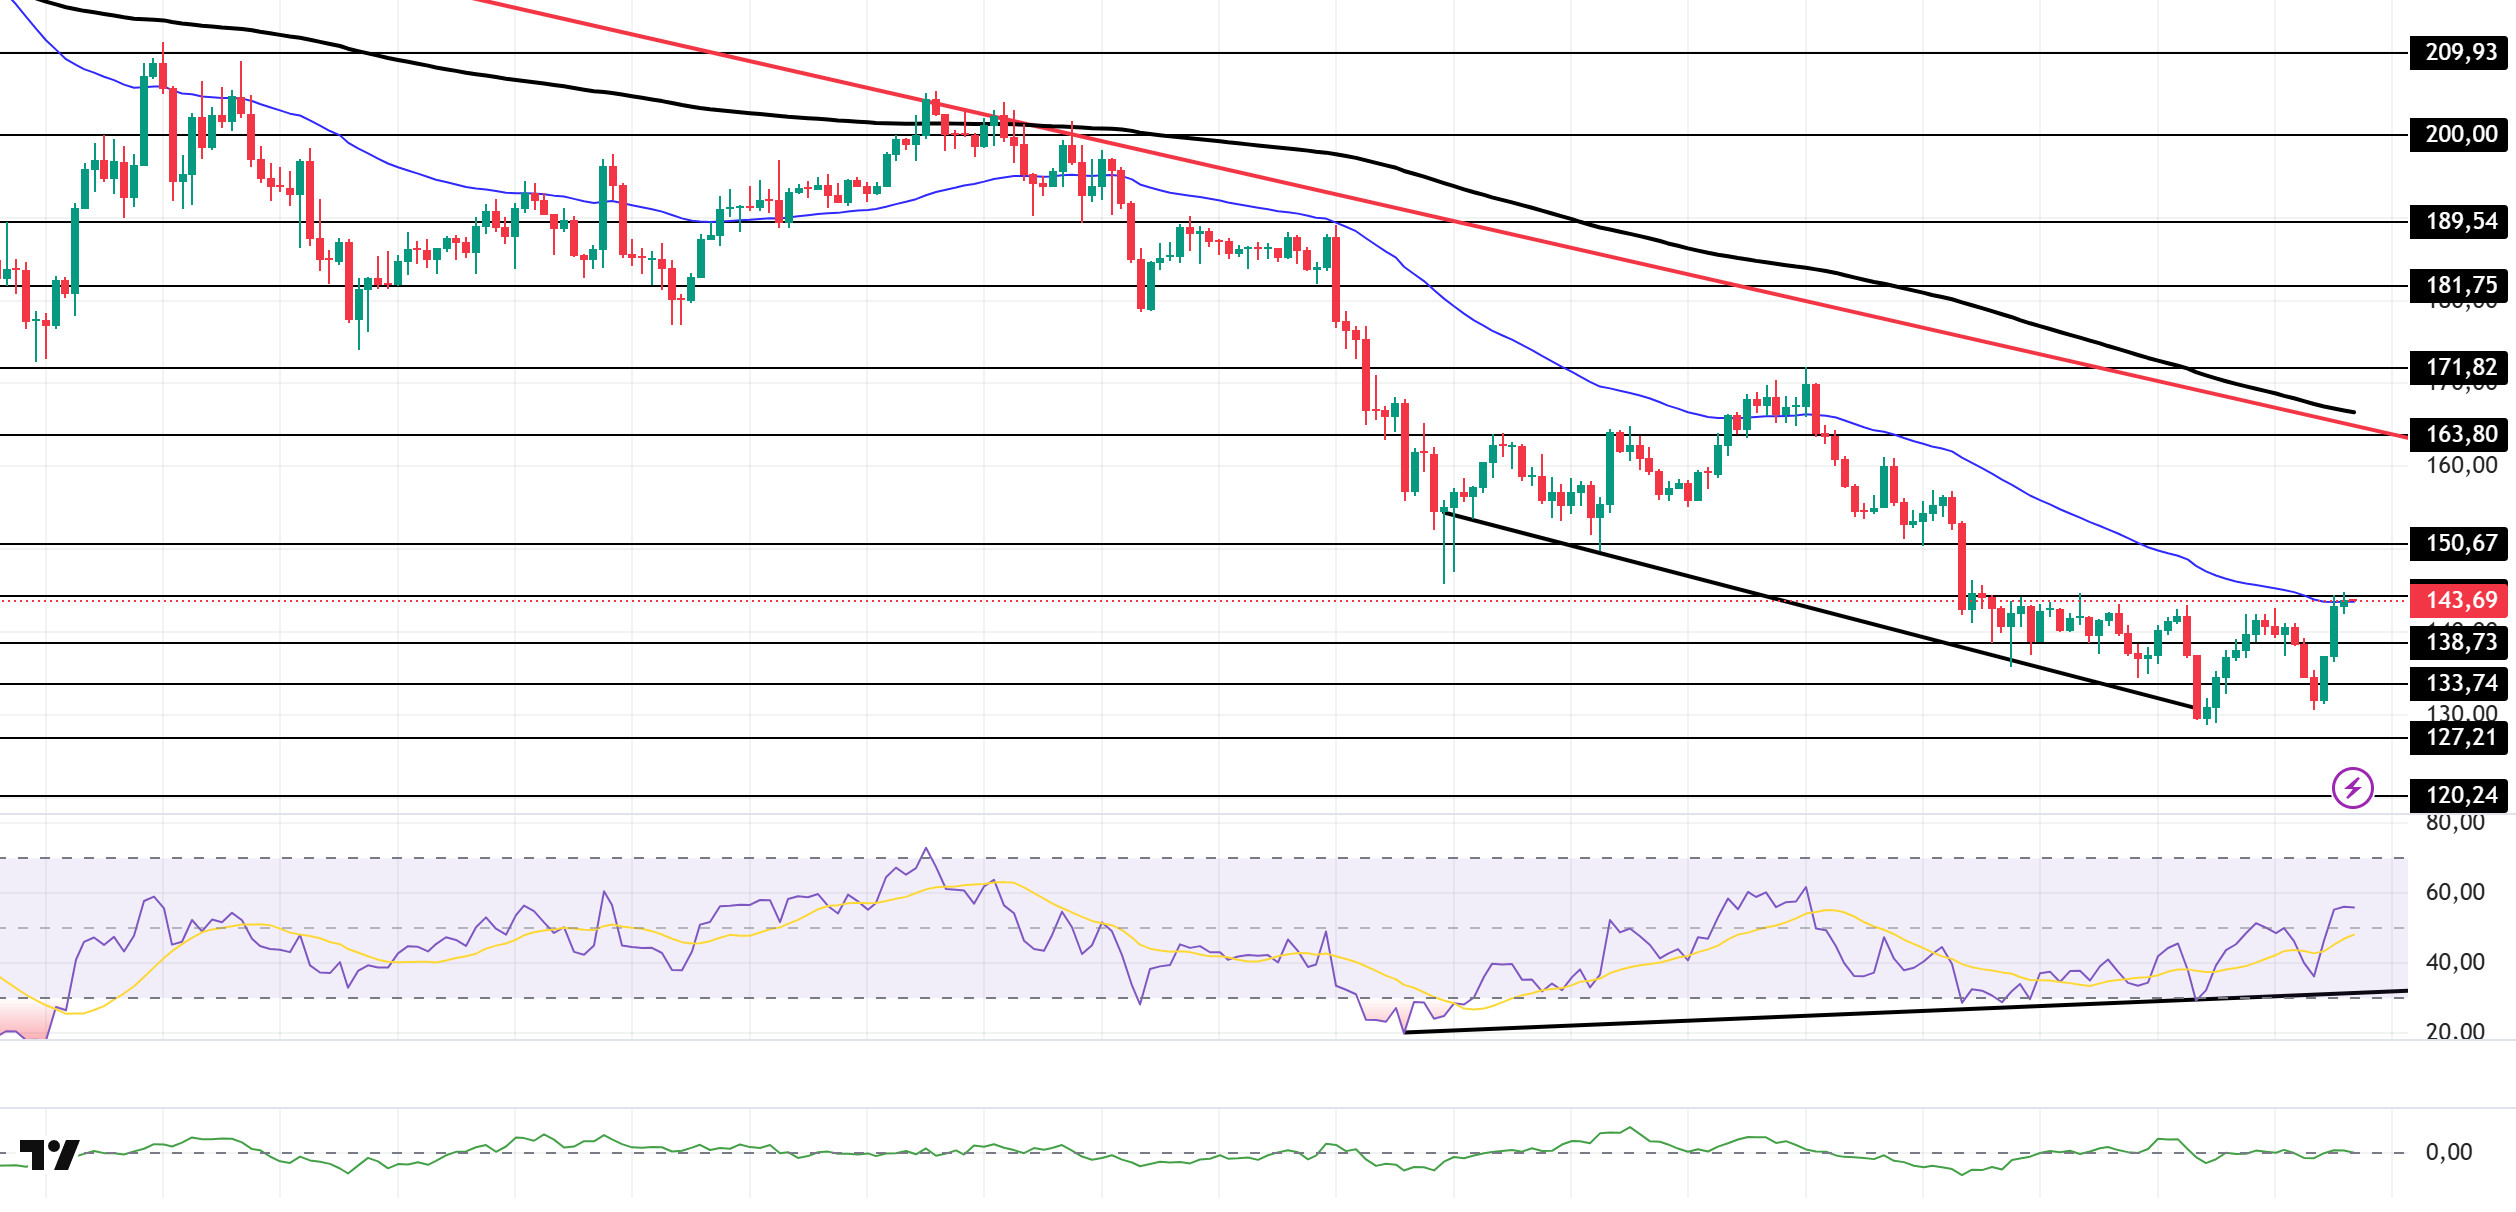
The SOL price experienced an uptrend. The asset remained in the lower region of the downtrend that began on October 6. Gaining momentum from the strong support level of $133.74, the asset is currently testing the 50 EMA (Blue Line) moving average as resistance. If the upward trend continues, it may test the downward trend line. In the event of a pullback, the $127.21 level could act as support.
On the 4-hour chart, it continued to remain below the 50 EMA (Exponential Moving Average – Blue Line) and 200 EMA (Black Line). This indicates that it may be in a downtrend in the medium term. At the same time, the price being below both moving averages shows us that the asset is in a downward trend in the short term. On the other hand, the gap between the two moving averages shows that the asset may experience a sideways or upward movement. Chaikin Money Flow (CMF-20) is at a neutral level. However, the balance in cash inflows may continue to keep the CMF at a neutral level. The Relative Strength Index (RSI-14) has accelerated into positive territory. It is also above the upward trend that began on November 4. This indicates that buying pressure continues. If there is an uptrend due to macroeconomic data or positive news related to the Solana ecosystem, the $163.80 level stands out as a strong resistance point. If this level is broken upwards, the rise is expected to continue. If there are pullbacks due to developments in the opposite direction or profit-taking, the $127.21 level may be tested. A decline to these support levels could increase buying momentum, presenting a potential upside opportunity.
Supports: 138.73 – 133.74 – 127.21
Resistances: 144.35 – 150.67 – 163.80
DOGE/USDT
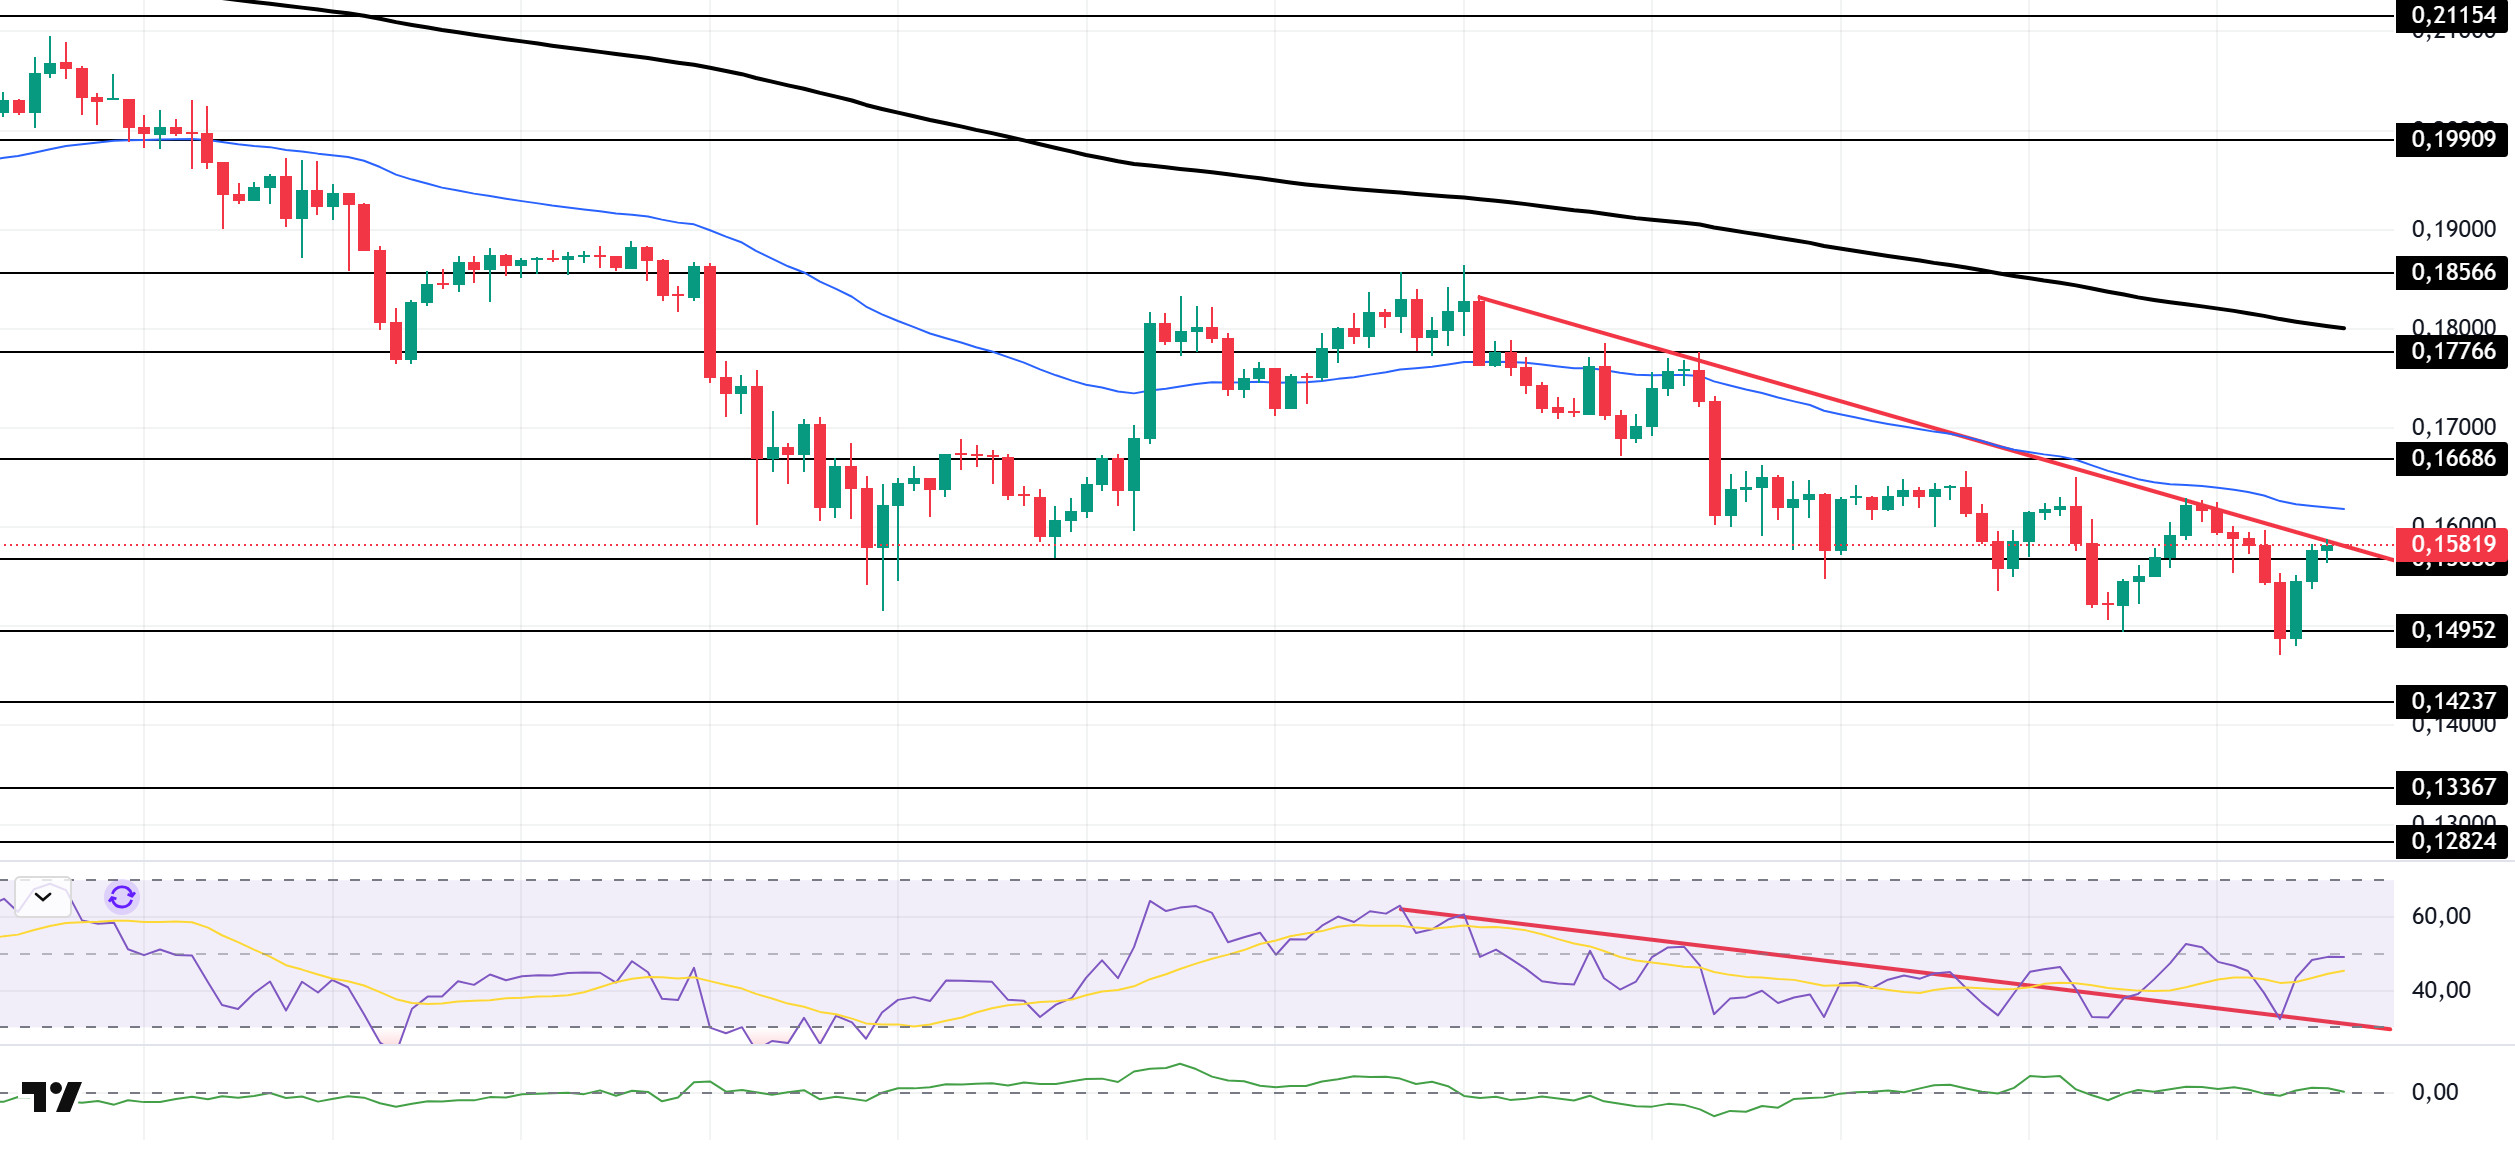
The DOGE price showed an upward trend. The asset remained in the lower region of the downward trend that began on November 11. As of now, the price is testing the downward trend line as resistance. If the upward trend continues, it may test the 50 EMA (Blue Line) moving average and the $0.16686 level as resistance. If it experiences a pullback, it may retest the $0.14952 level.
On the 4-hour chart, the 50 EMA (Exponential Moving Average – Blue Line) remained below the 200 EMA (Black Line). This indicates that a downtrend may begin in the medium term. The price being between the two moving averages indicates that the price is in a decision phase in the short term. On the other hand, the large difference between the two moving averages increases the potential for the asset to move sideways or upward. The Chaikin Money Flow (CMF-20) is at a neutral level. Additionally, balanced cash inflows and outflows may cause the CMF to remain at a neutral level. The Relative Strength Index (RSI-14) is near the neutral level in the negative zone. At the same time, it continued to remain above the downward trend that began on November 10. This indicated that buying pressure continued. In the event of potential increases driven by political developments, macroeconomic data, or positive news flow within the DOGE ecosystem, the $0.17766 level stands out as a strong resistance zone. Conversely, in the event of negative news flow, the $0.14237 level could be triggered. A decline to these levels could increase momentum and initiate a new wave of growth.
Supports: 0.15680 – 0.14952 – 0.14237
Resistances: 0.16686 – 0.17766 – 0.18566
SUI/USDT
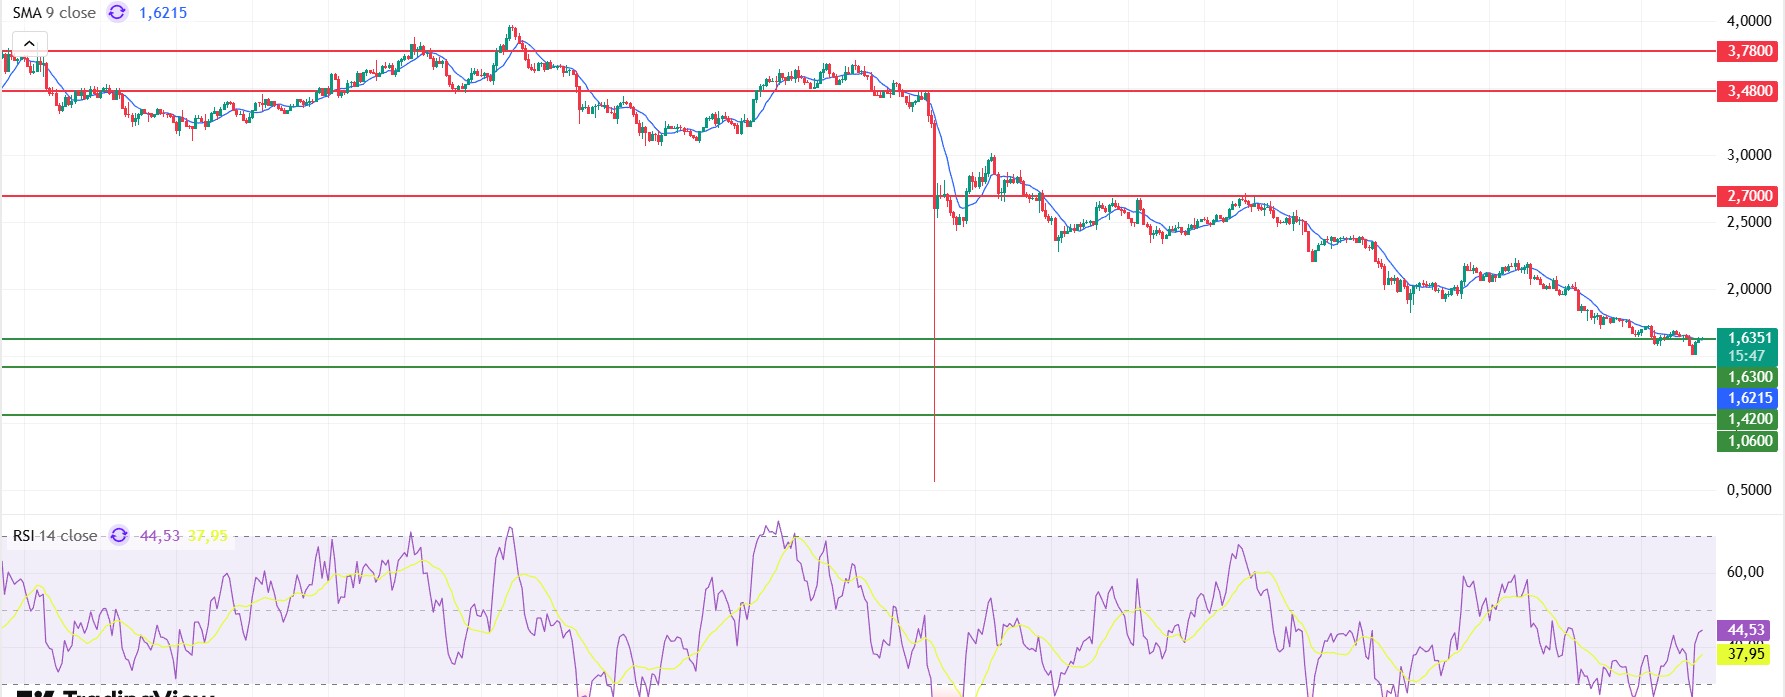
Looking at Sui’s technical outlook, we see that the price has been moving sideways around the $1.63 level on a 4-hour basis, influenced by fundamental developments. The Relative Strength Index (RSI) is currently in the range of 44.51 – 37.95. This range indicates that the market is trading close to the buy zone; a drop in the RSI to the 40.00 – 35.00 range could signal a potential buying point. If the price moves upward, the resistance levels of $2.70, $3.48, and $3.78 can be monitored. However, if the price falls to new lows, it could indicate that selling pressure is intensifying. In this case, the support levels of $1.63, $1.42, and $1.06 come to the fore. Based on the trend line, a pullback to $1.42 appears technically possible. According to Simple Moving Averages (SMA) data, Sui’s average price is currently at $1.62. The price remaining above this level indicates that the current uptrend could technically continue.
Supports: 1.06 – 1.42 – 1.63
Resistances: 2.70 – 3.48 – 3.78
Legal Notice
The investment information, comments, and recommendations contained herein do not constitute investment advice. Investment advisory services are provided individually by authorized institutions taking into account the risk and return preferences of individuals. The comments and recommendations contained herein are of a general nature. These recommendations may not be suitable for your financial situation and risk and return preferences. Therefore, making an investment decision based solely on the information contained herein may not produce results in line with your expectations.