Weekly Technical Analysis Report – December 15–22, 2025 –
BTC/USDT
Last week, the Fed cut interest rates by 25 basis points to a range of 3.50–3.75% at its December meeting; the decision was not unanimous, with three members voting differently, highlighting the divergence in policy. Fed Chair Powell emphasized that they are closely monitoring the economic outlook, while signaling a cautious wait-and-see period due to risks in the labor market and inflation dynamics. Meanwhile, the Bank of Japan is preparing to raise rates to 0.75%, signaling the highest interest rate level in 30 years. In international politics, limited progress was made in Russia-Ukraine peace talks, while Trump’s candidate evaluations for the Fed Chair expected to take office next year in the US are coming to the fore. On the crypto front, Strategy, which was rumored to be selling its BTC holdings in recent days, purchased another 10,624 BTC.
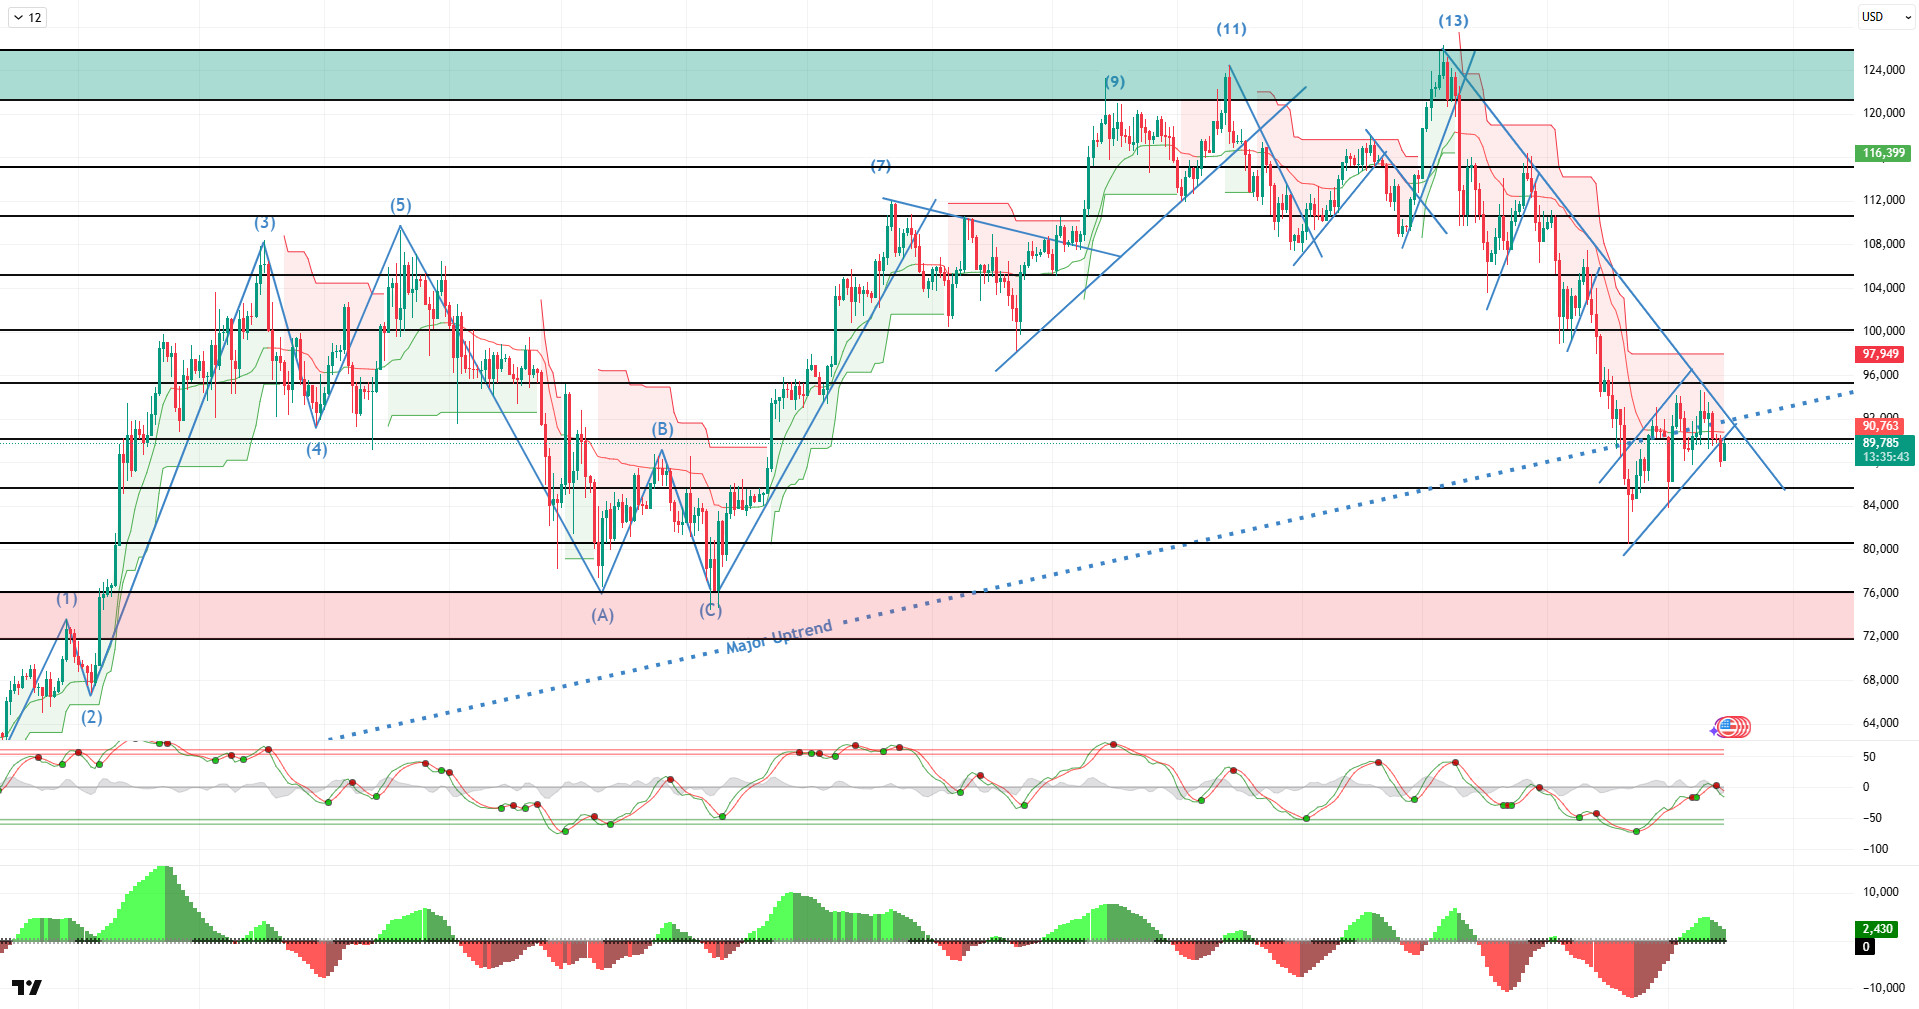
Looking at the daily technical picture after all these developments, BTC deepened its downtrend, which started from the ATH level of 126,200 points, falling to 80,500 points after reaching 13 points. Although the price bottomed out here and returned to the 94,600 level, it failed to hold and tested the 87,600 levels once again. BTC, which recorded a critical structure with the reverse flag pattern it created, continues December with a 0.59% decline.
Looking at technical indicators, the Wave Trend (WT) oscillator turned downward, signaling a sell in the daily channel middle band. The Squeeze Momentum (SM) histogram weakened within the positive zone. In moving averages, the golden cross pattern that began on May 17 was lost as the 50-day SMA crossed above the 200-day SMA. The Supertrend structure continues to maintain its bearish outlook.
Looking at weekly liquidation data, with the recent decline, the buy level was liquidated in the 87,000 – 90,000 band, while the selling level formed a fairly intense accumulation in the short term at 91,400 and in the long term in the 94,000–95,500 and 97,000–98,000 bands.
In summary, although the Fed cut interest rates as expected, it emphasized that uncertainty remains regarding the course of policy for the coming year. On the other hand, another important development that caught the attention of the markets was the Fed’s preparation to expand its balance sheet by repurchasing short-term Treasury bonds. In contrast, the BOJ’s decision to raise interest rates by 25 basis points at its December meeting is the most important factor for markets to monitor in the coming days. On the technical side, the price rebounded from a new low of 80,500 and tested the 94,600 level. Liquidity data shows that the buy-sell levels have become the target again. In the coming period, after the recent decline, the price may rise again if it breaks through the falling trend line. In this context, the price will be monitored at the 90,000 level, and then at the 93,000 level after closing above 90,000. On the other hand, with the impact of fundamental developments, the reverse flag pattern formed with the price coming under selling pressure again will be monitored as a critical reference at 85,000, and in case of a breakout, it will be monitored as the last reference point before the price tests the double bottom at 80,000.
Supports: 90,000 – 85,000 – 83,800
Resistances: 95,000 – 98,000 – 100,000
ETH/USDT
Compared to last week, Ethereum is showing a more complex and volatile structure. Developments on the network side were one of the main factors contributing to this uncertainty. Due to an error in the Prysm client, the network participation rate temporarily dropped to around 75%, and some validators experienced a total loss of 382 ETH as a result of resource depletion. Although this development was perceived negatively from a technical standpoint, it did not create a systemic crisis, and the overall functioning of the network has been preserved.
On-chain data, however, indicates that long-term confidence remains intact despite this technical glitch. The increase in Ethereum’s Total Value Staked from 35.91 million ETH to 36.11 million ETH reveals that investors are maintaining and even increasing their positions on the staking side. This increase stands out as important data showing that structural confidence in ETH has not weakened despite short-term fluctuations.
On the price front, there was significant volatility. ETH recorded a strong rise to $3,450 last week, but faced heavy selling in this region due to weak liquidity conditions and quickly retreated to $3,020. After this decline, buyers re-entered the market following the weekly close, and the price managed to recover to around $3,180, starting the week with an upward trend. This pattern indicates that upward momentum has not completely disappeared but remains fragile.
The liquidity outlook remains cautious. Although the Chaikin Money Flow (CMF) remains in positive territory, it continues its downward trend and has retreated to the zero line. This scenario explains why new capital entering the market remains limited and why attempts at upward movement are met with sharp sell-offs. If the CMF fails to regain upward momentum, it may become difficult for prices to hold at higher levels.
There is a similar weakness on the momentum side. Although the Relative Strength Index (RSI) showed a slight recovery with the recent rise, it has not yet transitioned into a structurally strong positive trend. The indecisive appearance of the RSI indicates that price movements have not yet gained a clear direction and that short-term reactions remain at the forefront.
The technical outlook also indicates continued uncertainty from the Ichimoku indicator perspective. The price being stuck between the Tenkan and Kijun levels suggests that the search for direction continues in the short term, while the price remaining below the lower band of the Kumo cloud indicates that the medium-term trend is still in negative territory. This structure suggests that upward movements cannot yet be interpreted as a trend reversal.
Another noteworthy element in price movement is the developing head and shoulders formation. The final shoulder region coincides with the $3,240 level, which aligns with the lower band of the Kumo cloud. If the price rises to this level and is rejected, and also breaks below the $3,050–$3,020 band, the pattern could work and bring the risk of a deeper pullback to $2,750 levels. Conversely, a strong break above the $3,240 level could disrupt the current negative medium-term structure, causing the trend to turn positive again and triggering stronger rallies. Overall, despite strong on-chain fundamentals, Ethereum exhibits an unclear structure in terms of technicals and liquidity. While high volatility is expected in the short term, the $3,240 level stands out as a critical threshold for determining the direction. The decision made at this level could determine the trend for the coming weeks.
Supports: 3,055 – 2,753 – 2,520
Resistances: 3,240 – 3,374 – 3,552

XRP/USDT
Recent price movements in XRP have clearly demonstrated that uncertainty has increased further. Although the rise to $2.19 following the breach of the $2.16 level during the week initially gave the impression that buyers were gaining strength, this movement was not sustainable due to low liquidity conditions. When the rally failed to continue, sharp sell-offs kicked in, pushing the price back below the $2 level. This scenario indicates that the market is still struggling to generate confidence and that upward attempts remain fragile.
The liquidity outlook continues to weaken. The Chaikin Money Flow (CMF) indicator’s downward trend continues, signaling that capital outflows from the market are ongoing. The limited liquidity support is one of the main reasons why the price cannot sustain its rebound. Unless there is a clear recovery in the CMF, it seems difficult for buyers to gain the upper hand in the market.
The picture is also negative on the momentum front. The Relative Strength Index (RSI) and general momentum indicators are maintaining their weak trajectory. The RSI remaining at low levels indicates that selling pressure is still strong and buyers have not yet been able to generate the momentum needed to push prices higher. This structure increases the risk that short-term upward attempts will remain limited.
On the trend side, the Ichimoku indicator continues to show a weak outlook. The price trading below the kumo cloud and remaining below the Tenkan and Kijun levels indicates that the downward trend is still technically valid. There is no clear sign of improvement in the medium-term trend, which explains why selling pressure is so easily triggered.
The focus will remain on the $2.05 level in the coming period. Unless this region is regained, downward risks are likely to continue. If prices remain below $2.05, they may come under pressure towards the $1.90 level, and a break below this level could lead to steeper declines. Conversely, a substantial break above $2.05 could lead to a retest of the $2.19 level in the short term. In the current scenario, when liquidity, momentum, and technical structure are evaluated together, it appears that pressure remains on the sellers’ side for XRP, and the direction is predominantly downward.
Supports: 1.9077 – 1.7867 – 1.6189
Resistances: 2.0500 – 2.1608 – 2.3233

SOL/USDT
In the Solana ecosystem.
- Invesco Galaxy filed Form 8-A with the SEC.
- State Street and Galaxy Digital will launch a tokenized fund on Solana in 2026.
- Bhutan will launch the state-backed gold token TER on Solana on December 17.
- FTX/Alameda removed a stake worth $194,861 SOL (approximately $25.5 million).
- P. Morgan issued $50 million in U.S. commercial paper on Solana for Galaxy Digital.
The SOL price continued to consolidate on the daily chart. The asset remained in the lower region of the downtrend that began on September 18. Testing the strong support level of $127.62 and the bottom of the horizontal band, the price gained momentum and showed a slight uptrend. Currently at the midpoint of the horizontal band, the price could test the ceiling of the horizontal band and the 50 EMA (Blue Line) moving average as resistance if an uptrend begins. In the event of a pullback, the $116.81 level should be monitored.
The asset is trading below its 50 EMA (Exponential Moving Average – Blue Line) and 200 EMA (Black Line) moving averages, indicating that the asset is trending downward. Furthermore, the 50 EMA remained below the 200 EMA. This indicates that a technical “dead cross” formation is continuing. This also shows that the potential for a decline in the medium term is increasing. The RSI (14) is hovering near the middle of the negative zone. At the same time, the indicator has remained below the downward trend line that began on July 22. These factors indicate increased selling pressure. The Chaikin Money Flow (CMF-20) remains in negative territory. At the same time, a decrease in money inflows could keep the CMF-20 indicator in negative territory. If macroeconomic data remains positive and developments in the ecosystem continue to be favorable, the first major resistance level of $162.99 could be retested. Conversely, in the event of potential negative news flow or deterioration in macro data, the $99.95 level could be monitored as a potential buying opportunity.
Supports: 127.62 – 116.81 – 99.95
Resistances: 141.80 – 150.23 – 162.99

DOGE/USDT
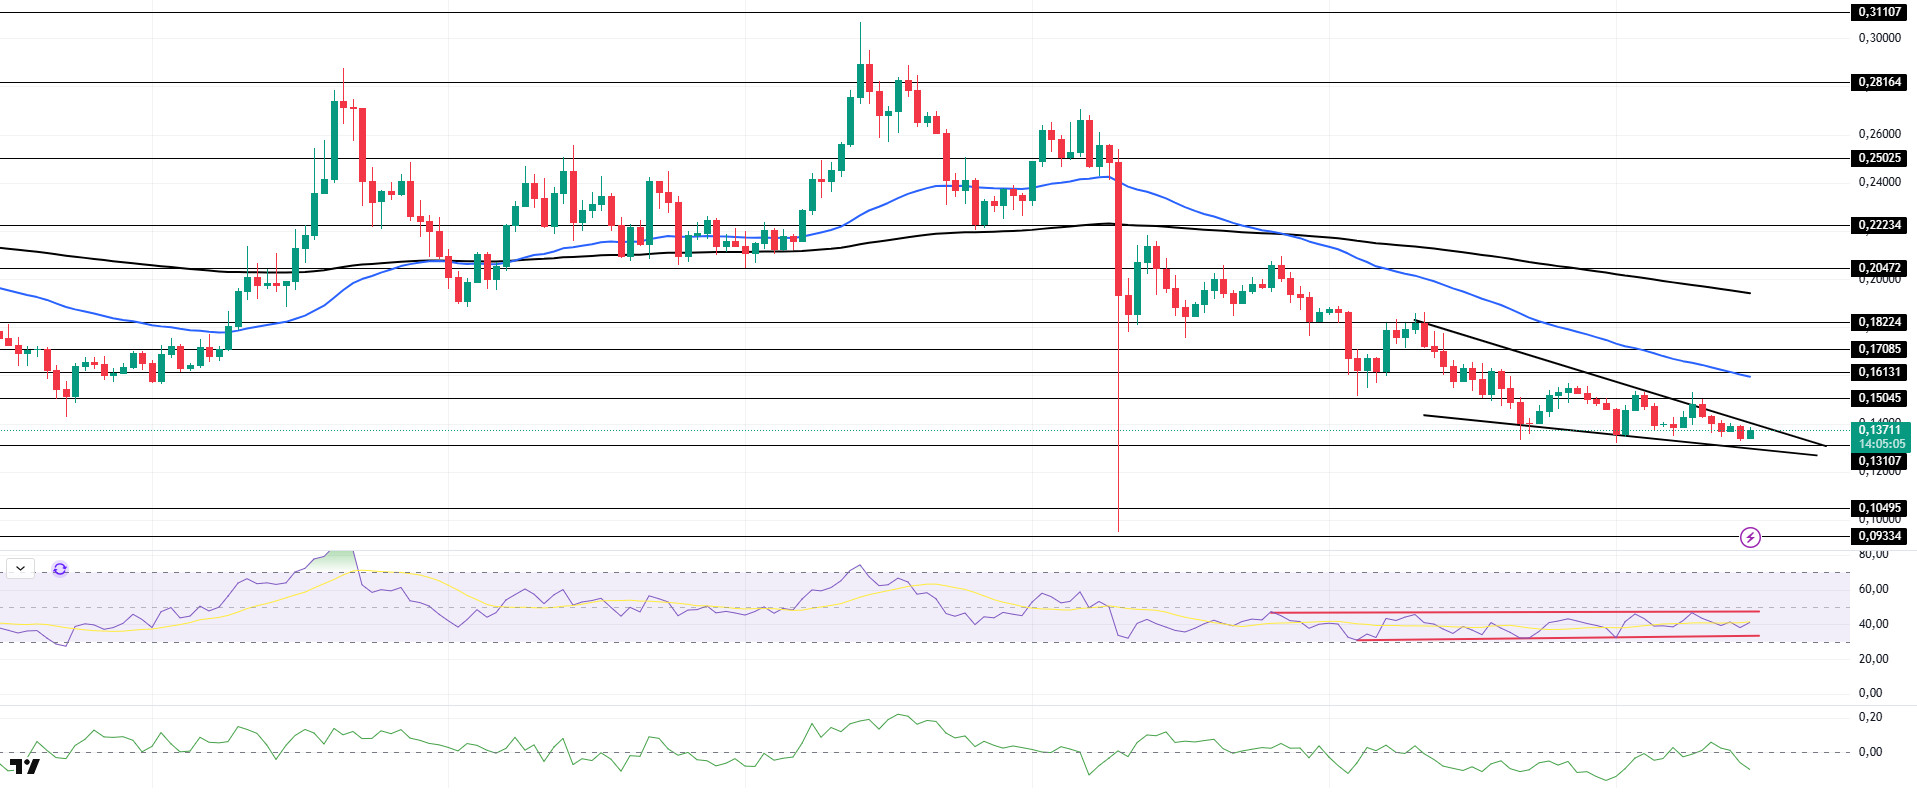
DOGE has been trading sideways on the daily chart since last week. The asset continued to price within the descending wedge formation that began on November 10. Testing the ceiling level of the wedge formation, which is a strong resistance level, the price failed to break through this level and showed a slight decline. As of now, it continues to price in the middle region of the descending wedge formation. The 50 EMA (Blue Line) moving average may act as resistance in candle closes above the ceiling level of the descending wedge formation. In the event of a decline, the base level of the descending wedge formation should be monitored.
The asset continued to trade below the 50 EMA (Blue Line) and 200 EMA (Exponential Moving Average – Black Line) moving averages. This indicates that the asset is trending downward. On the other hand, the 50 EMA moving average being below the 200 EMA moving average shows that the “dead cross” formation is continuing. This also indicates that the asset has the potential to lose value at this point. The Chaikin Money Flow (CMF–20) indicator has fallen into negative territory. Money inflows continue to decline. This could push the CMF-20 deeper into negative territory. Looking at the Relative Strength Index (RSI-14) indicator, it continues to hover around the midpoint of negative territory. On the other hand, it remained within the narrow band that began on October 26. In the event of macroeconomic risks or negative news from the ecosystem, the $0.10495 level can be monitored as strong support. On the other hand, if the upward movement gains strength, the $0.17085 level comes to the fore as the first strong resistance level.
Supports: 0.13107 – 0.10495 – 0.09334
Resistances: 0.15045 – 0.16131 – 0.17085
TRX/USDT
Last week, with the minting of 1 billion USDT on the Tron network, the total USDT supply on the network reached $80.5 billion. Current data shows that TRON continues to be one of the largest blockchain networks in terms of USDT supply.
Last week, the TRON network generated a total of $47 million in revenue, continuing to be the highest-earning ecosystem among all blockchain networks. This revenue dynamic confirms that TRON’s stablecoin-centric transaction volumes form a strong foundation for the network’s economy.
During the week of December 8–14, 2025, a total of 24.4 million TRX were burned on the TRON network. Despite this, the circulating supply increased by 3 million. While the increase in circulating supply may create limited inflationary pressure on TRX in the short term, the continuity of the burning mechanism may contribute to balancing this effect in the medium term. Additionally, the total number of addresses increased by 1.7 million to reach 353 million during the same week.
Technically speaking, TRX started the week at 0.2868 and lost approximately 3.5% in value throughout the week, closing at 0.2772. Thus, TRON ended the week with a decline, and its market value was $26.2 billion. Currently trading at 0.2816, TRX is at the upper band of the bearish channel on the daily chart. The Relative Strength Index (RSI) value is observed to be at 49. Considering its position within the bearish channel and the RSI indicator, the TRX price may pull back slightly. This suggests it may move towards the middle band of the channel. In such a scenario, it could test the 0.2765 support level. If it closes below the 0.2765 support level, it may test the 0.2640 support level. If it fails to close below the 0.2765 support level and there is a positive break in market sentiment, it may rise with potential buying from this area. In such a case, it may break the bearish channel upwards and test the 0.2875 and 0.3000 resistance levels in succession. The 0.2540 level is being monitored as a critical support point on the daily chart. Sustained trading above this level could maintain the upward trend, while closes below it could lead to increased selling pressure and deeper downward price movements.
Supports: 0.2765 – 0.2640 – 0.2540
Resistances: 0.2875 – 0.3000 – 0.3150

AVAX/USDT
Starting at $13.49 last week, AVAX managed to break through the $14.21 resistance level in the first half of the week as buying appetite increased, subsequently rising to $14.83. However, following the Fed Interest Rate Decision and FOMC Economic Projections announced in the US on December 10, 2025, Fed Chairman Powell’s speech increased selling pressure across the cryptocurrency market . Parallel to these macro developments, AVAX also saw a sharp decline, falling below the support levels of $14.21 and then $13.07. With the weekly close at $12.88, AVAX lost approximately 4.5% of its value on a weekly basis. Although there were positive developments in the Avalanche ecosystem during the week, macroeconomic factors played a more dominant role on the price. AVAX started the new week with an increase and is currently trying to hold above the $13.07 level, but there has not been a clear close above this level yet.
On the daily chart, the Moving Average Convergence/Divergence (MACD) line continues to sit above the signal line and is trending sideways upward. This suggests that momentum is showing signs of recovery, albeit weak. However, the MACD remains in negative territory, indicating that a strong trend reversal has not yet been confirmed. The MACD line and signal line moving very close to each other increases the possibility of a sharp breakout in the short term. Strengthening momentum and the MACD moving into positive territory are critical for AVAX to break through resistance levels in its upward movement. Otherwise, selling pressure encountered in resistance zones could limit the rise again. Furthermore, on the Exponential Moving Average (EMA) side, AVAX continues to trade below all critical levels. These levels form a strong resistance zone for AVAX’s rise while confirming that the overall trend remains in negative territory. The current technical structure indicates that upward attempts are still weak and that volume and momentum increases are necessary for sustainability.
From a technical perspective, the $13.07 level is the first critical resistance level for AVAX. If daily closes occur above this level, the $14.21 and $15.61 levels could come into play in the continuation of the uptrend. In a scenario where closes occur above these levels and the uptrend continues, the $18.50 level is a major resistance position in terms of a medium-term trend reversal. In a downward scenario, if the $13.07 level cannot be broken during AVAX’s rise and sustainability cannot be achieved above this level, the $11.88 level comes to the fore as the first critical support zone in AVAX’s decline. If AVAX closes below this level, the $10.61 and $9.71 support levels could come into play in AVAX’s decline. In the overall picture, the MACD remaining in negative territory and the price trading below all critical EMA levels indicates that AVAX is under pressure in the short term. Therefore, unless there are strong closes above resistance levels, recovery attempts are likely to be limited.
(EMA50: Green Line, EMA100: Blue Line, EMA200: Purple Line)
Supports: 11.88 – 10.61 – 9.71
Resistances: 13.07 – 14.21 – 15.61

SHIB/USDT
This week, the Shiba Inu ecosystem focused on security and infrastructure stability on the Shibarium side. While posts about tracking fund movements in relation to bridge exploitation came to the fore again, the emphasis on the issue being handled in coordination with law enforcement agencies was noteworthy. The same headline increased the community’s expectations for process clarity and accountability, making the internal ecosystem debate more visible.
In this context, K9 Finance, which is involved in liquid staking on Shibarium, marked January 6, 2026, as the threshold for the complete and verifiable resolution of grievances and stated that it could put the relationship with Shibarium to a community vote if this did not happen. This became one of the most critical governance topics of the week. On the infrastructure side, while there was talk of a temporary reindexing need on the explorer side and short-term fluctuations in data visibility following RPC updates, reports that the daily burn rate had weakened but the weekly total had returned to positive territory, albeit limited, were closely monitored by ecosystem followers.
This week’s technical outlook highlights a structure where pressure within the descending channel has re-emerged, and the previous rebound attempt has lost momentum. The simultaneous decline in volume, momentum, and volatility indicates that sales are continuing gradually and with low energy rather than aggressive panic, but also that the capacity to generate a reaction has weakened. The Chaikin Money Flow (CMF) indicator remaining in negative territory confirms that buyer liquidity is fragile and that upward attempts are struggling to gain traction. The price trading below the 50-period Exponential Moving Average (EMA) and 200-period Exponential Moving Average (EMA) suggests that the main trend is still downward and that the current movements remain limited waves within the downtrend.
The price moving towards the lower band of the descending channel brings the key support at $0.00000760 back into focus in the short term. As long as it stays above this area, the movement can be interpreted as a weak, sideways drift around the lower band of the descending channel ( ). Conversely, if there are consecutive closes below the support at $0.00000760 and the Chaikin Money Flow (CMF) deepens its negative outlook, the levels at $0.00000715 and $0.00000670 could come back into play. The continued approach to support amid declining volatility also requires keeping in mind that the movement could evolve into a structure that could accelerate rapidly if a breakout occurs. In a potential upward relief scenario, the first critical threshold is again the region around $0.00000945. Without volume-supported and consecutive closes above this level, it seems difficult for a more meaningful and lasting recovery scenario towards the resistance areas at $0.00001170 and $0.00001275 to gain strength. In the big picture, the price moving above EMA50 and then EMA200, along with the CMF producing a recovery signal towards the zero line, remain fundamental conditions for a trend breakout.
(EMA200: Black line, EMA50: Blue line)
Supports: 0.00000760 – 0.00000715 – 0.00000670
Resistances: 0.00000945 – 0.00001170 – 0.00001275

LTC/USDT
Litecoin (LTC) ended last week with a 3.03% decline against USDT, starting the new week at $78.96. LTC also lost 0.67% against Bitcoin during the same period, leaving behind a negative week in terms of price performance. Currently, Litecoin’s total market capitalization stands at approximately $6.2 billion. With this pullback, Litecoin lost the one-step advantage it gained last week and fell back to 19th place in the cryptocurrency market rankings. On the futures front, the total open interest decreased by 7.8% compared to the beginning of last week. Additionally, the long/short ratio remaining at 0.915 for positions opened at the start of the new week indicates that derivatives market participants are more neutral toward downward expectations.
Looking at the daily candlestick chart, the Litecoin price continues to trade below the 100-period (yellow), 50-period (orange), and 200-period (purple) moving averages. This outlook can be seen as an indicator confirming that selling pressure has not yet been overcome in both the short and long term. Last week’s predominantly downward price movement, combined with a loss of volume in futures trading, is causing increased market anxiety, which is keeping buyers on the sidelines. The current structure indicates that more attractive technical formations for sell positions continue to develop.
Although levels of 86.85, 89.96, and 102.02 stand out on the chart this week as potentially offering resistance or local peaks during any upward movement, the price has been moving within a very narrow and flat range for over 25 days. This structure indicates that the price is not under pressure to produce a mandatory breakout until next Monday. On the other hand, the fact that the potential downward trend line (red dotted line) will enter the horizontal band range at the beginning of next week, creating a downward narrowing, and the continued decline in open interest in futures trading, strengthens the possibility that this week will also be largely spent in a band movement. Under this outlook, the possibility that any potential gains may be limited to around 7.01% until next week comes to the fore.
On the other hand, in the downward scenario, which is the predominant expectation among derivatives market participants, the levels at which reactions could be seen in possible pullbacks are 80.17, 70.61, and 64.45. Particularly, if the ongoing horizontal movement in the 80.17 – 86.85 range breaks downward, there is potential for the price to pull back to the 70.61 level by the beginning of next week. This scenario, which offers a downward range of approximately 12.55% compared to current price levels, is noteworthy, while if the decline intensifies, the 64.45 level is expected to act as a strong support point.
Supports: 80.17 – 70.61 – 64.45
Resistances: 86.85 – 89.96 – 102.02

LINK/USDT
Backed Finance announced xBridge, a new bridge solution that enables the transfer of tokenized stocks between the Ethereum and Solana networks. xBridge utilizes Chainlink’s Cross-Chain Interoperability Protocol (CCIP) infrastructure to ensure that corporate actions such as dividends and stock splits are preserved accurately and consistently during cross-chain transfers. This development is critical in enabling secure and scalable cross-chain asset transfers that comply with corporate standards on the tokenization side ( ), while also strengthening Chainlink’s position in real-world assets (RWA) and TradFi–DeFi integration.
We see that Link continues to be squeezed in a controlled manner within the falling wedge structure following the sharp sell-off after October 10. Although this structure indicates that pressure will continue in the short term, the nature of the formation keeps the potential for an upward breakout in the medium term quite strong. In particular, the fact that buyers step in every time the price touches the lower trend line signals that selling pressure is weakening and volatility is narrowing, suggesting we may see a sharp move in the short term.
We can say that the $13.55–14.60 range is the short-term equilibrium zone in the current pricing. Sustained trading above this zone could pave the way for upward momentum within the falling wedge. Specifically, a daily close above $14.60 would signal an exit from the short-term downward structure and bring the retest of the $16.67 level to the agenda in the first stage. This level is also a technically strong intermediate resistance point as it is the breakout point of the previous horizontal structure.
In the continuation of the upward scenario, if the price breaks through the $17.70 – $18.00 band, the medium-term outlook will gain significant strength. Price stability above this region could bring the 19.70–20.18 dollar range, the target zone of the falling wedge formation, into focus. This area should be monitored as a critical threshold where profit-taking could increase, as it is both a formation target and a region of historically strong supply.
In the downside risk scenario, the $13.55 support level remains the first line of defense. However, the truly critical level is the $11.72 band. A daily close below this level could break the falling wedge structure, turning the technical outlook negative again and paving the way for the price to retreat towards the $10.94 region. In this scenario, it would be possible to speak of a structure where the buyer side has clearly weakened.
On the Relative Strength Index (RSI) side, although we see short-term fluctuations in the middle band, we see a structure that fits our technical setup and are approximately 3 points below the positive zone. If the RSI stays above 50 in the positive zone, it could boost buyers’ momentum, adding strength to positive expectations and potentially pushing the price up to around $16.67.
Supports: 13.19 – 11.72 – 10.94
Resistances: 14.60 – 16.67 – 20.18

SUI/USDT
This week, there were significant and noteworthy developments in the Sui (SUI) ecosystem. Sui Network partnered with Google to develop the Agentic Payment Protocol. The Agentic Payment Protocol (AP2) is an open standard developed by Google in collaboration with leading payment and technology companies, which will attract new investors to Sui.
Additionally, Sui’s Total Value Locked (TVL) continues to maintain strong momentum this week, remaining above $1 billion. According to some data, TVL has approached record levels of $2.15 billion. This indicates an organic increase in developer and user participation.
Following recent developments, when we look at Sui’s technical outlook, we see that the price has been moving sideways at around $1.58 on a weekly basis, influenced by fundamental developments. The Relative Strength Index (RSI) is currently in the range of 45.76 – 45.78. This range indicates that the market is trading close to the buy zone; the RSI continuing in this range of 40.00 – 45.00 may signal a potential buying point. If the price moves upward, the resistance levels of $1.73, $2.03, and $2.36 can be monitored. However, if the price falls to new lows, it may indicate that selling pressure could deepen. In this case, the support levels of $1.36, $1.24, and $1.06 come to the fore. Based on the trend line, a pullback to $1.06 appears technically possible. According to Simple Moving Averages (SMA) data, Sui’s average price is currently at $1.59. If the price remains below this level, it could signal that the current uptrend may not continue technically.
Supports: 1.06 – 1.24 – 1.36
Resistances: 1.73 – 2.03 – 2.36

ADA/USDT
Since last week, the ADA price has fallen by 6% to $0.4046. Following the Fed’s interest rate cut decision and the subsequent market pullback, Cardano founder Charles Hoskinson stated that $NIGHT trading has not yet started in Japan and that the real bull market will begin in January when trading opens in Japan. He commented, “Major events are piling up towards the end.” With the launch of the Midnight Night project, the network structure is expected to strengthen in terms of privacy. This network uses a dual-state architecture that separates public and private data, allowing controlled access to auditors, institutions, or counterparties.
Technically speaking, the ADA price continues to trade below the 100-day and 50-day Exponential Moving Average (EMA 100 – Blue Line) (EMA 50 – Orange Line). On December 9, it broke out of the falling channel with an upward movement, touching the 20-day Exponential Moving Average (EMA 20 – Red Line) and receiving its first upward reaction. If it rises to the resistance point of the 100-day average at $0.6148, the second resistance point at $0.7329 can be followed. These levels indicate that ADA buyers are willing to buy at higher prices, showing that buyer pressure is increasing over time. A retest of this zone could play a critical role in completing the downtrend channel. If the price breaks above the 20-day Exponential Moving Average (EMA 20 – Red Line), it could close above the 50-day Exponential Moving Average (EMA 50 – Blue Line). The Relative Strength Index (RSI) continues to hover near the buy zone at 40 levels, while the Chaikin Money Flow (CMF-20) remains at -0.08 levels, indicating that the price is in the sell zone. If the price falls as a result of the macroeconomic data expected to be announced this week and the statements to be made by US President Trump, the important levels we will follow are the bottom of the downtrend at $0.3686. In the event of closes below this level, the support level can be followed at the $0.2959 to $0.2251 band.
Supports: 0.3686 – 0.2959 – 0.2251
Resistances: 0.6148 – 0.7329 – 0.8166

Legal Notice
The investment information, comments, and recommendations contained in this document do not constitute investment advisory services. Investment advisory services are provided by authorized institutions on a personal basis, taking into account the risk and return preferences of individuals. The comments and recommendations contained in this document are of a general nature. These recommendations may not be suitable for your financial situation and risk and return preferences. Therefore, making an investment decision based solely on the information contained in this document may not result in outcomes that align with your expectations.