
MARKET SUMMARY
Latest Situation in Crypto Assets
| Asset | Last Price | 24h Change | Dominance | Market Cap |
|---|---|---|---|---|
| BTC | $67,331.00 | 0.36% | 58.87% | $1.33 T |
| ETH | $2,556.00 | -2.29% | 13.29% | $307.90 B |
| SOLANA | $173.56 | 5.04% | 3.52% | $81.55 B |
| XRP | $0.5309 | 0.14% | 1.30% | $30.11 B |
| DOGE | $0.1395 | 0.48% | 0.88% | $20.44 B |
| TRX | $0.1631 | 1.78% | 0.61% | $14.12 B |
| CARDANO | $0.3523 | -3.61% | 0.53% | $12.33 B |
| AVAX | $27.12 | -0.67% | 0.48% | $11.04 B |
| SHIB | $0.00001788 | -0.52% | 0.45% | $10.54 B |
| LINK | $11.41 | -2.72% | 0.31% | $7.16 B |
| DOT | $4.238 | -0.95% | 0.28% | $6.40 B |
*Prepared on 10.24.2024 at 06:00 (UTC)
WHAT’S LEFT BEHIND
Tesla Earnings Report
Tesla’s third-quarter financial results surprised analysts, with gross profit margin reported at 19.8%, up from 18% in the previous quarter. While this development eased investors’ concerns over Bitcoin holdings, the company confirmed that it maintained its holdings of 11,509 BTC despite recent wallet movements. With these Bitcoin holdings worth approximately $765 million, Tesla remains the fourth largest Bitcoin holder among publicly traded companies in the US, behind MicroStrategy, Marathon Digital Holdings and Riot Platforms.
Bernstein’s Ambitious Bitcoin Forecast for the End of 2025
Even though the leading crypto Bitcoin hit $70,000 and retreated, analysts are very hopeful for 2025. Bernstein analysts predict that Bitcoin will reach six-digit prices by the end of 2025. He even characterizes this forecast as “conservative”.
Ripple CEO Garlinghouse
Ripple Labs CEO Brad Garlinghouse stated that the launch of a spot exchange-traded fund (ETF) for XRP is only a matter of time. Speaking on Bloomberg Television, Garlinghouse stated that both institutional and individual investors’ interest in cryptocurrencies has increased, which presents a great opportunity for XRP.
HIGHLIGHTS OF THE DAY
Important Economic Calender Data
| Time | News | Expectation | Previous |
|---|---|---|---|
| Encode London Conference (General Event – CRYPTO) | |||
| 12:30 | US Initial Jobless Claims | 243K | 241K |
| 12:45 | US FOMC Member Hammack Speaks | ||
| 13:45 | US Flash Manufacturing PMI (Oct) | 47.5 | 47.3 |
| 13:45 | US Flash Services PMI (Oct) | 55.0 | 55.2 |
| 14:00 | US New Home Sales (Sep) | 719K | 716K |
INFORMATION
*The calendar is based on UTC (Coordinated Universal Time) time zone. The economic calendar content on the relevant page is obtained from reliable news and data providers. The news in the economic calendar content, the date and time of the announcement of the news, possible changes in the previous, expectations and announced figures are made by the data provider institutions. Darkex cannot be held responsible for possible changes that may arise from similar situations.
MARKET COMPASS
Expectations regarding the US Federal Reserve’s (FED) interest rate cut course, which has been one of the main dynamics driving asset prices recently, was again decisive with the Beige Book published last night. In the report from 12 regions, it was stated that economic activity remained flat or declined in general. It was seen that the rise in the dollar index and bond yields was limited after these outputs, which are thought to increase the likelihood of a 25 basis point rate cut at the Bank’s meetings in November and December. This equation, which supported risk appetite, also reflected positively on digital assets.
Yesterday, the FED’s Beige Book report made it clearer that the course of the dollar and changes in US bond yields will be important for the direction of digital currencies. Fed officials have been saying for some time that there is no need for rapid rate cuts, which pushed bond yields higher, with the yield on the US 10-year bond reaching 4.26%, the highest since July 26. In the face of this situation, which reduced interest in risky assets, the appreciation of digital assets was limited and a retreat began to be observed. These retreats turned into a rise with the details between the lines of the Beige Book report from the US yesterday. According to the Beige Book, only two economic regions in the country reported that economic activity may have increased, while the other ten regions specifically mentioned the contraction in manufacturing activity. Nine economic regions reported stagnant or slightly weakening economic activity.
The uptrend in digital assets, which started in the US session yesterday with the Beige Book, continued during Asian trading. Whether this perception will be maintained (the US economy giving weakening macro indicators to support FED rate cuts) may become clear with the data to be released today. In this context, we attach particular importance to PMI indicators among the data to be released for the US today. For example, a lower-than-expected manufacturing PMI data may have a negative impact on the dollar and a positive impact on digital assets by pointing to the continuation of the FED’s interest rate cuts. In the opposite case, we may see pressure on cryptocurrencies.
TECHNICAL ANALYSIS
BTC/USDT
The overheating of the Bitcoin market and the fact that 98% of Bitcoin wallets are in profit, according to on-chain data, has put selling pressure on the market. The negative reversal in Bitcoin spot ETFs after seven consecutive days of positive inflows was a sign of this pressure. With the US elections looming, investors took profit-taking, while Bitcoin found demand at 65,200 and moved back upwards. Market volatility is expected to continue for the rest of October.
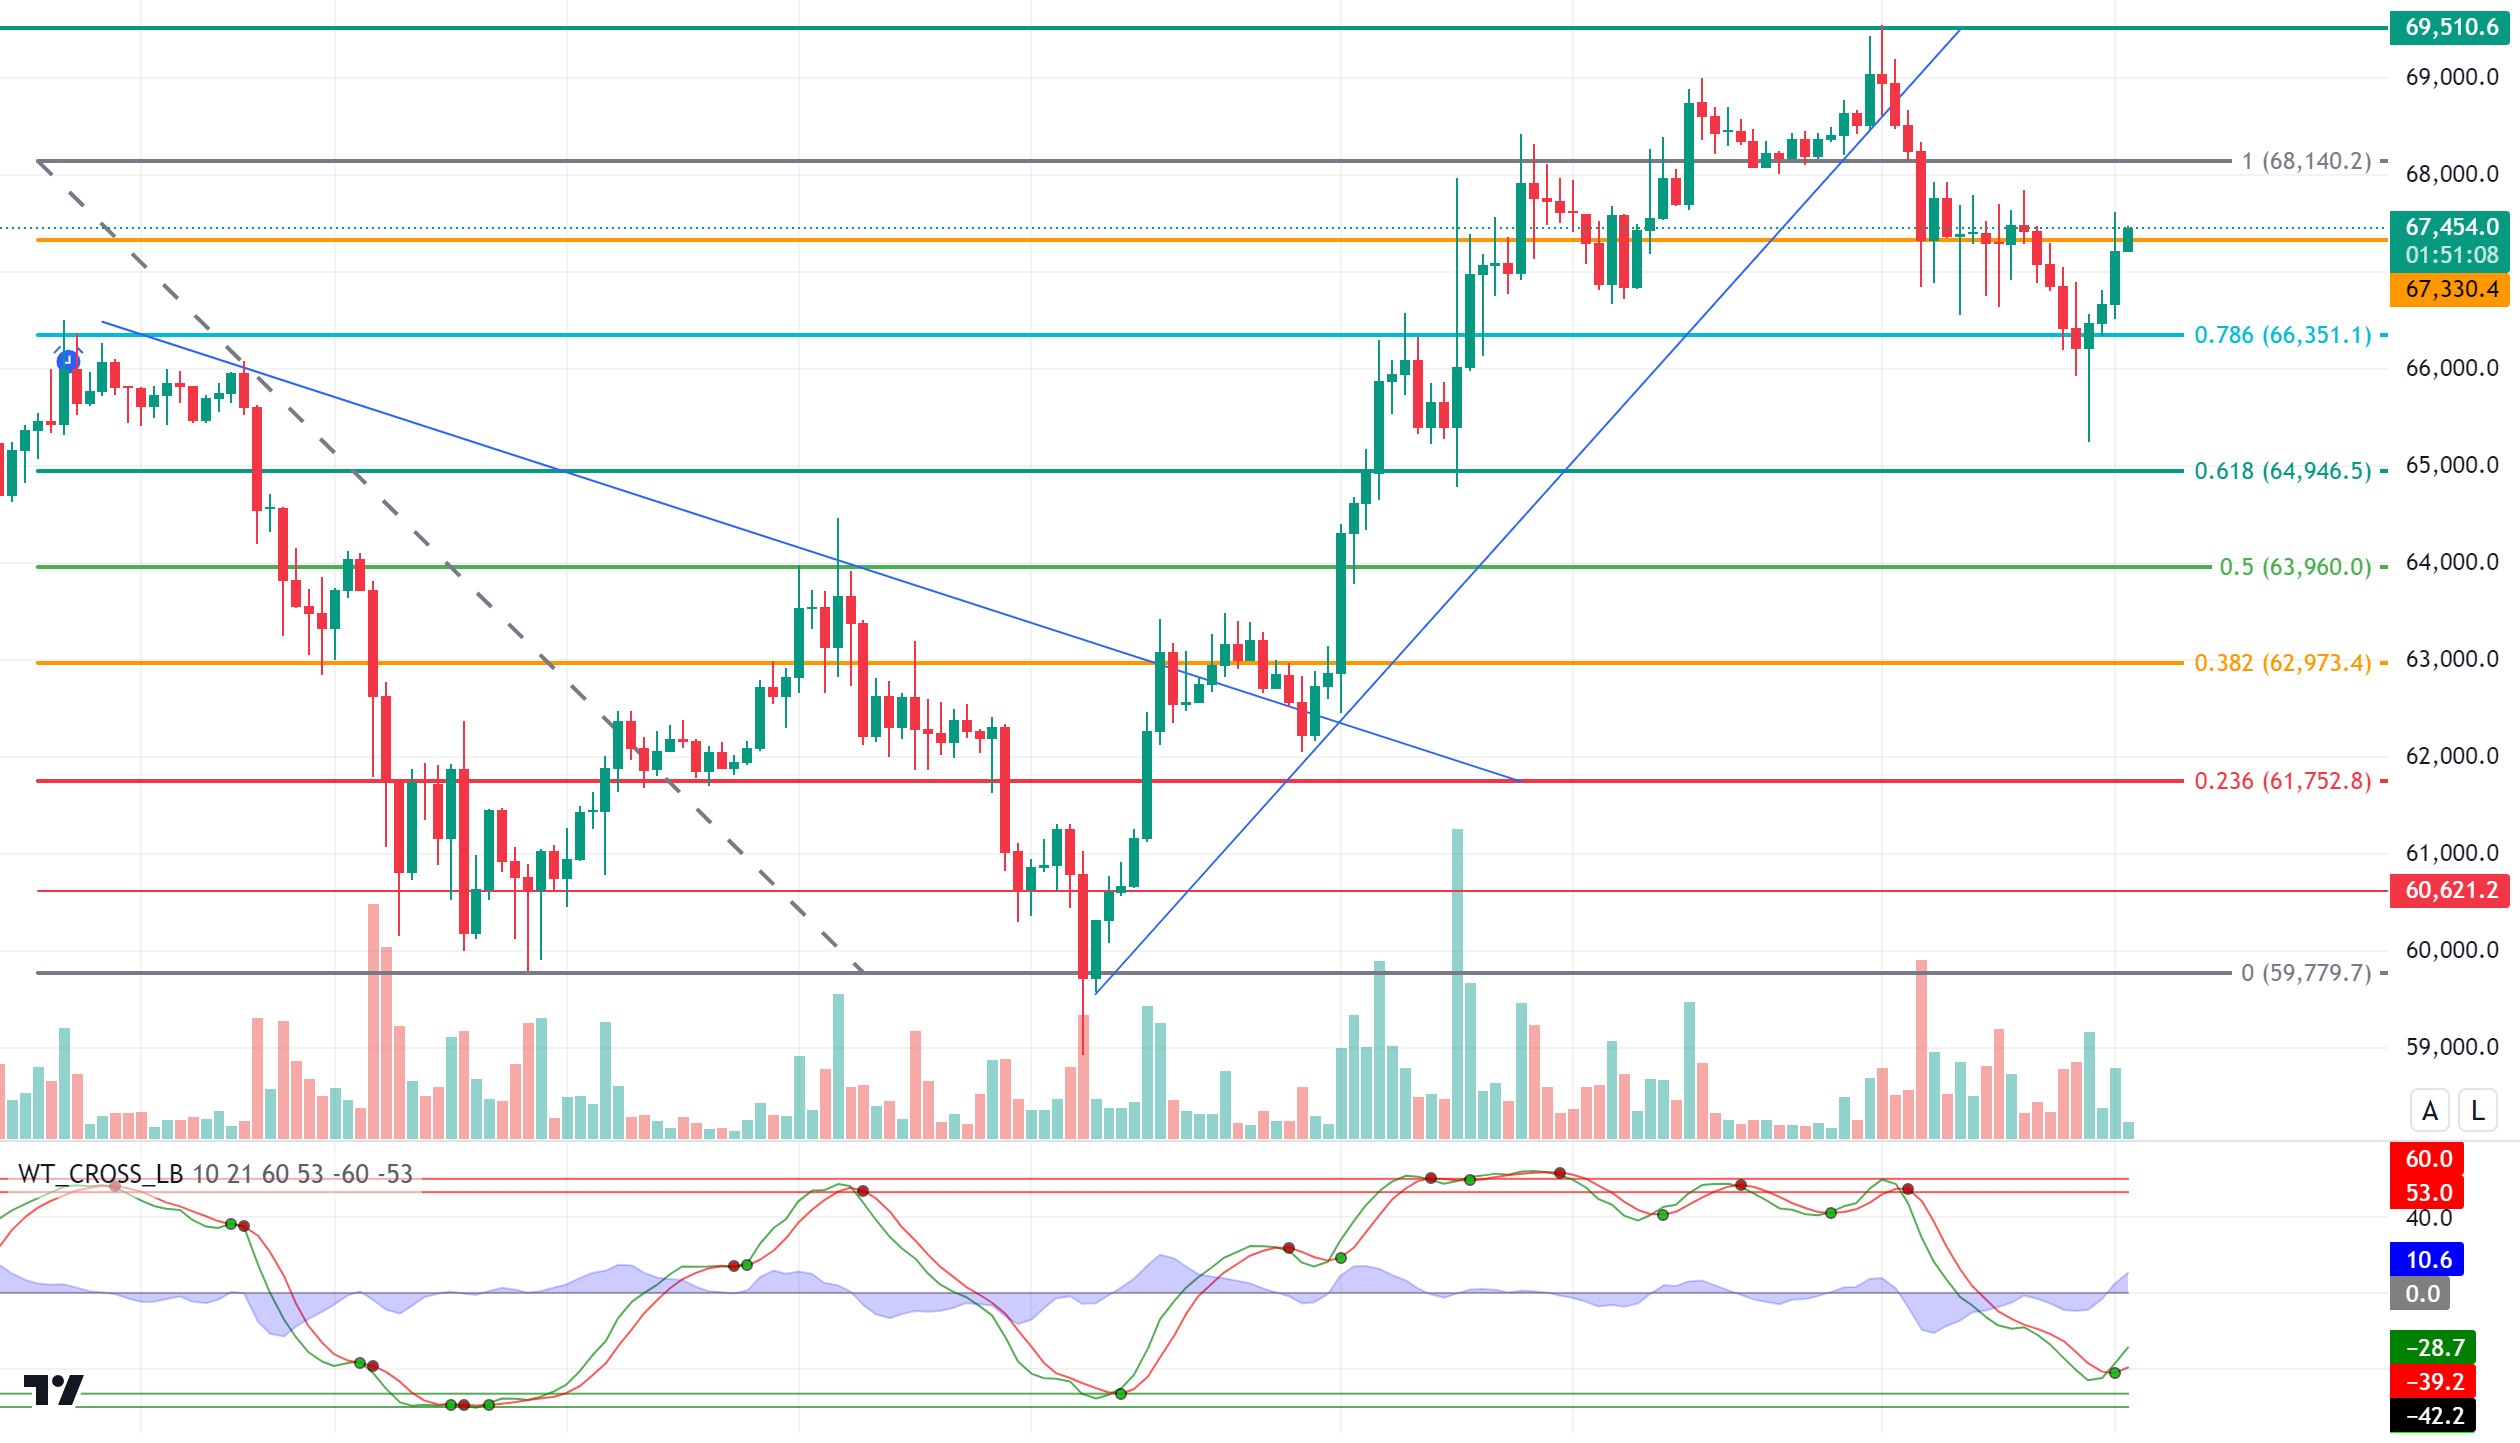
In the BTC technical outlook, the price, which entered a short-term downtrend as the market overheated, experienced a pullback towards the 65,200 level. BTC, which has made a rapid recovery with the pullback in optimistic market conditions, is again testing the intermediate resistance level of 67,330. Hourly closes above this level may move the BTC price to the Fibonacci 1 (68,140) level as technical indicators give a buy signal with technical indicators coming to the oversold zone on hourly charts. A pullback from this point, along with the increasing uncertainties in the market before the US elections, could move the price back to the support level of Fibonacci 0.786 (66,351) and then 0.618 (65,946).
Supports 66,350 – 64,946 – 63,960
Resistances 67,330 – 68,140 – 69,510
ETH/USDT
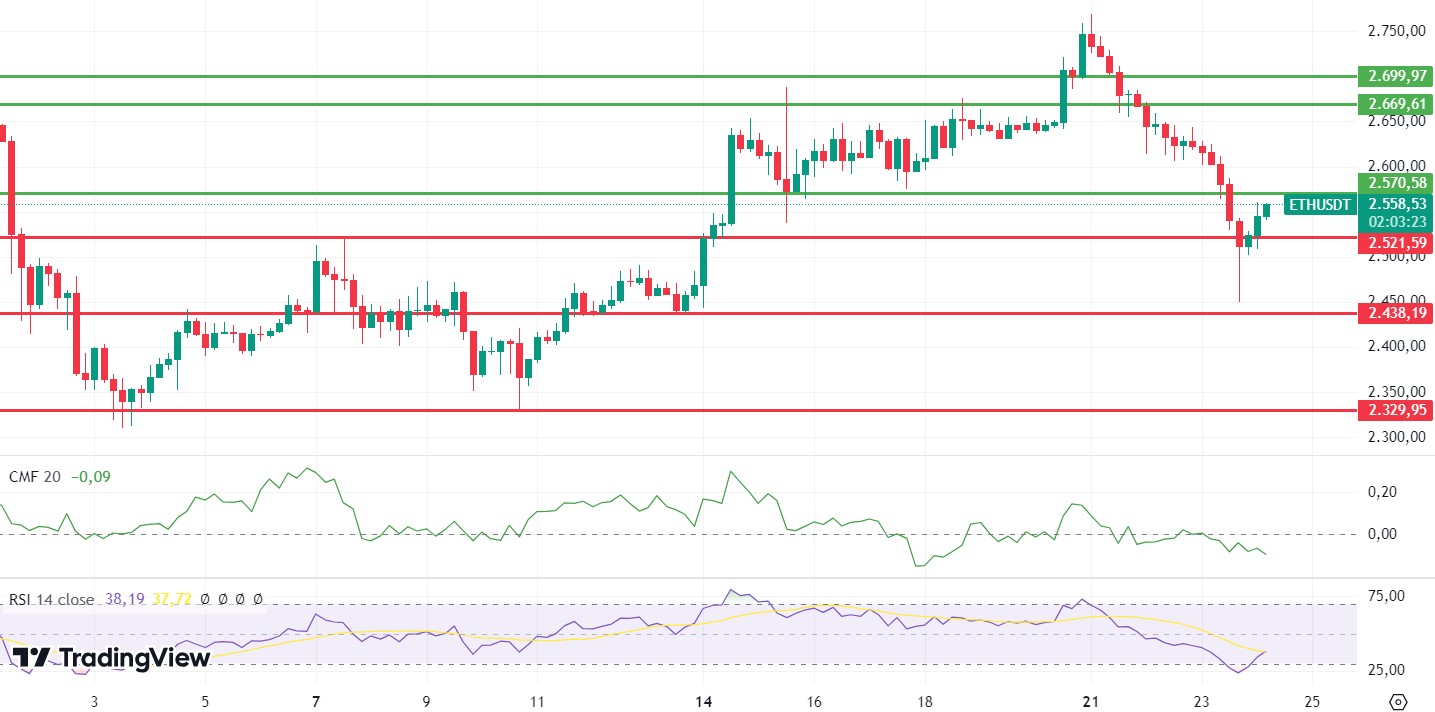
ETH has fallen sharply to 2,440 levels with the loss of the critical support level of 2,571, and has risen back above 2,521 levels with the reaction from here. Even though the Relative Strength Index (RSI) has come out of the oversold zone and momentum has given a slightly positive outlook, we see that the negative outlook on Chaikin Money Flow (CMF) continues. Looking at the Cumulative Volume Delta (CVD), it is noticeable that the decline is futures-weighted while the reaction rise is spot-weighted. In summary, the gain of the 2,571 level during the day may move the price up again, while the break of the 2,521 level may bring declines up to 2,440 again.
Supports 2,521 – 2,438 – 2,329
Resistances 2,571 – 2,669 – 2,699
LINK/USDT
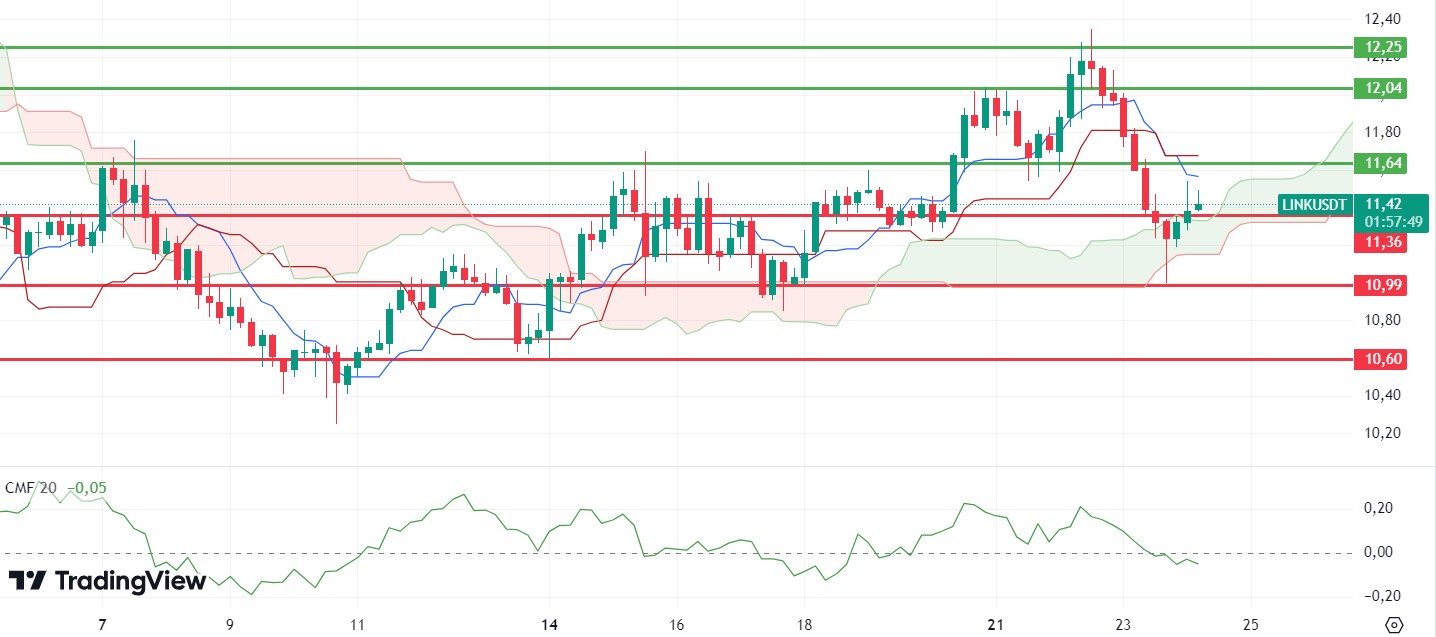
As mentioned in last night’s analysis, LINK continued to decline with the loss of the 11.36 level, falling as low as 10.99, and with the reaction it received from here, it rose again above the 11.36 level. The regain of the Kumo cloud and Relative Strength Index (RSI) look positive, while Chaikin Money Flow (CMF) continues to be negative. We may see slight rises up to 11.64 during the day. However, the loss of the 11.36 level may start a negative trend again.
Supports 11.36 – 10.99 – 10.60
Resistances 11.64 – 12.04 – 12.25
SOL/USDT
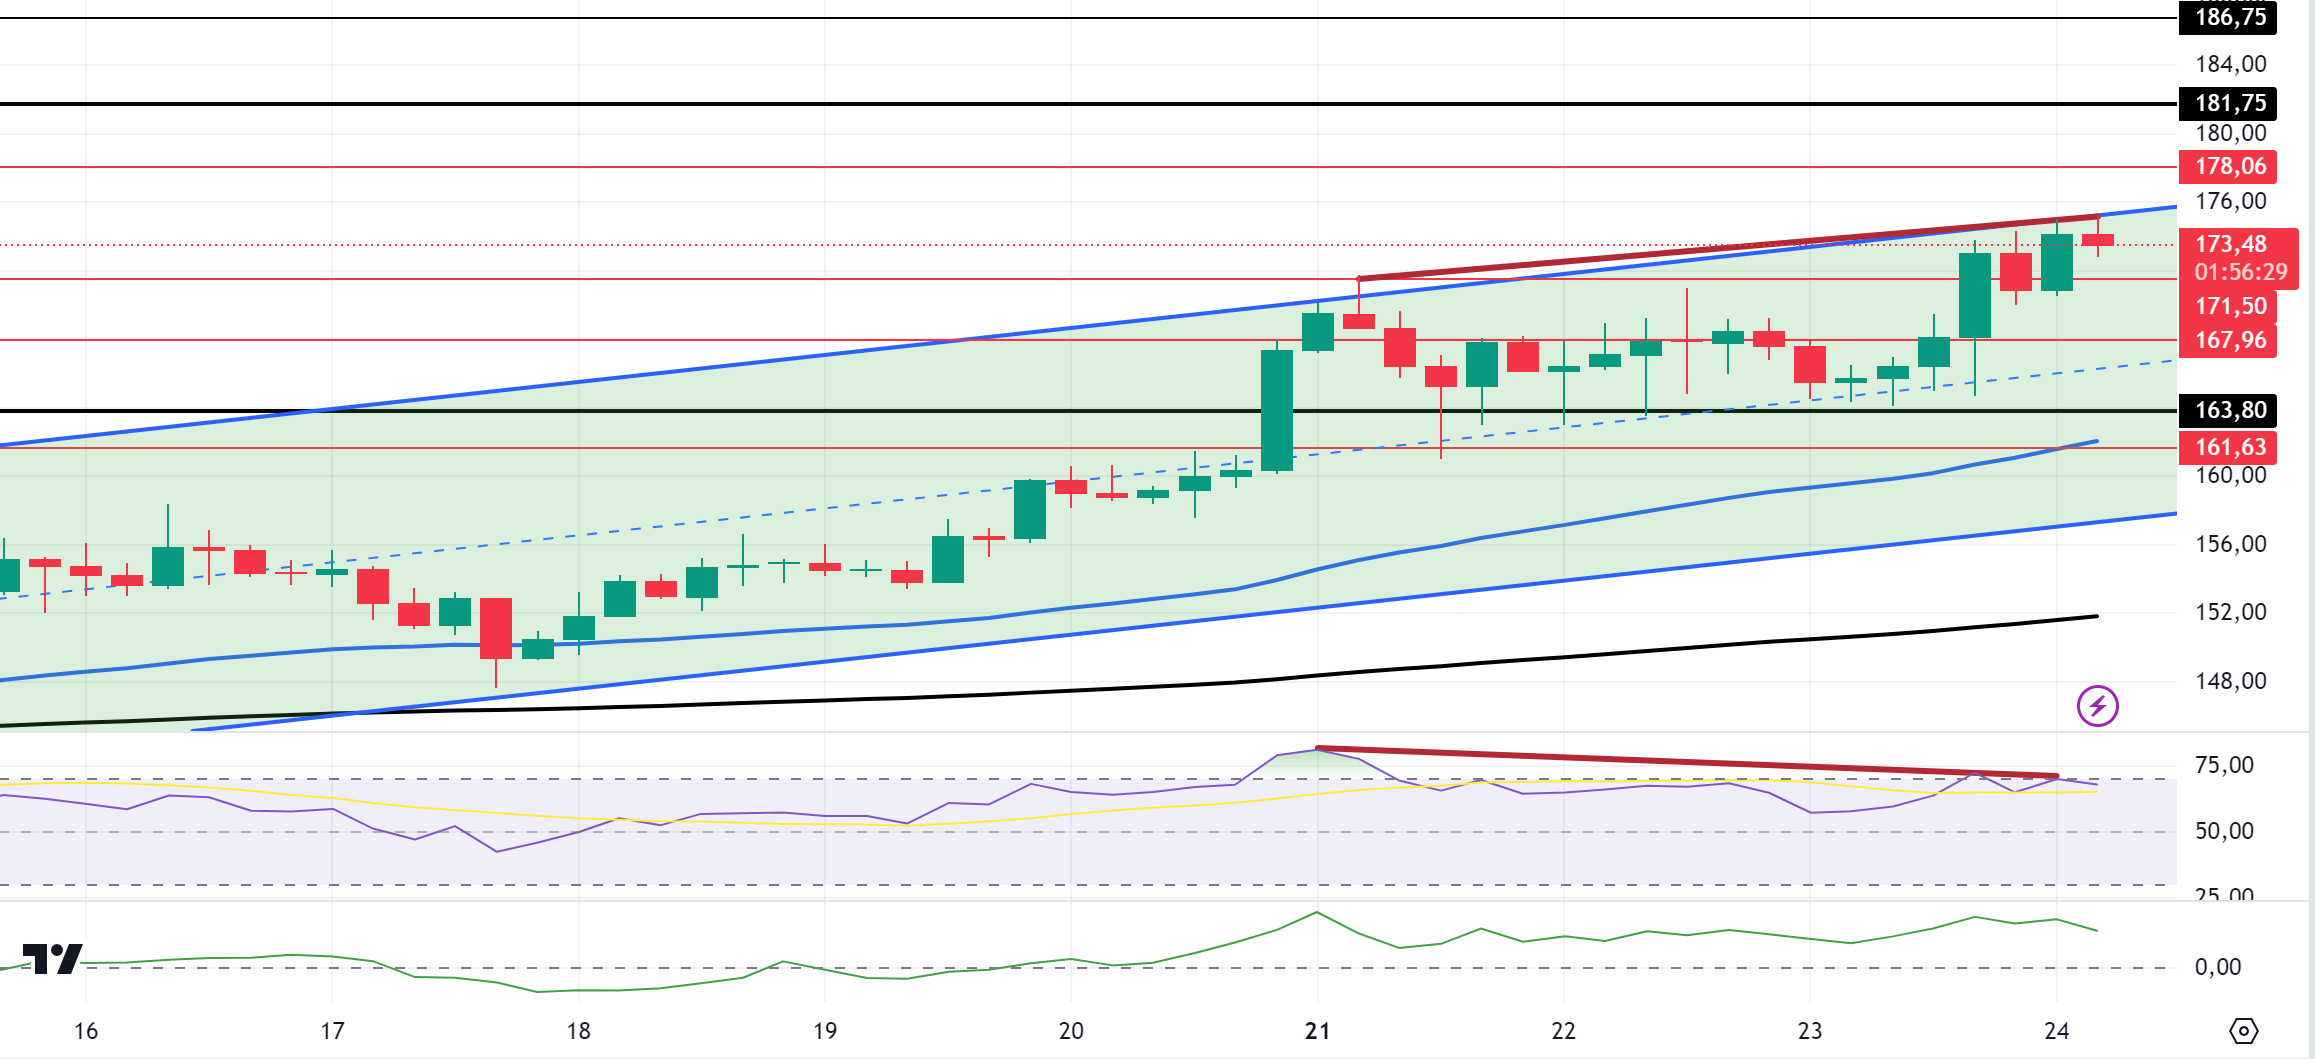
Flash Manufacturing PMI data from the US should be followed today. When we look at the chart, the 50 EMA (Blue Line) continues to be above the 200 EMA (Black Line) in the 4-hour timeframe. This may mean that the uptrend will continue. The price continued its uptrend yesterday, taking strength from 163.80, an important support level. However, the Relative Strength Index (RSI)14 indicator re-entered the overbought levels and a divergence occurred between the price and the indicator. However, Chaikin Money Flow (CMF)20 is at a very strong level. This indicates a large amount of money inflows. This enabled the price to test the top of the uptrend. The 181.75 level is a very strong resistance point in the uptrend driven by both macroeconomic conditions and innovations in the Solana ecosystem. If it rises above this level, the rise may continue strongly. In case of possible profit sales, support levels of 163.80 – 161.63 should be followed. If the price comes to these support levels, a potential bullish opportunity may arise.
Supports 171.50 – 167.96 – 163.80
Resistances 178.06 – 181.75 – 186.75
ADA/USDT
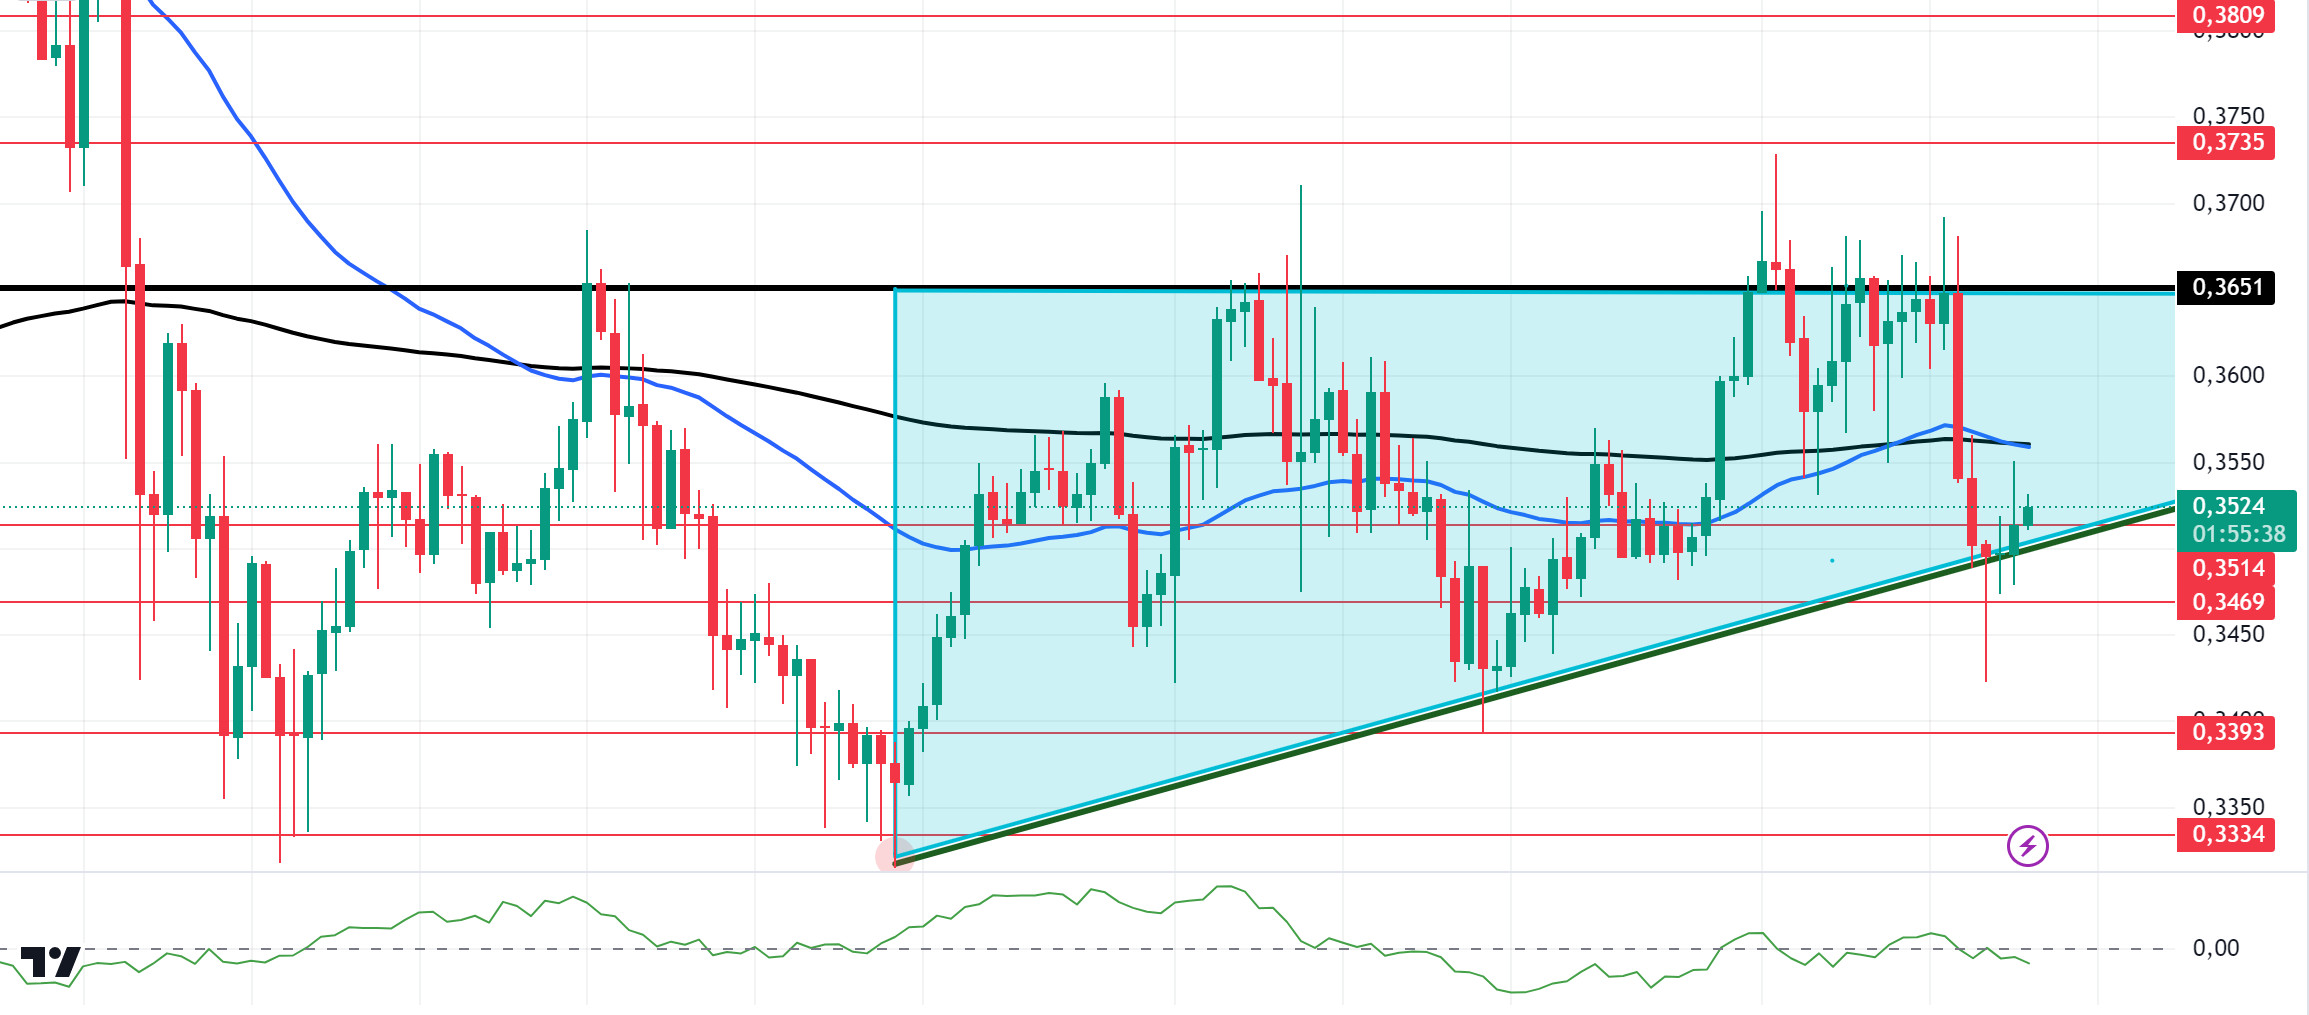
Flash Manufacturing PMI data from the US should be monitored today. In the Cardano ecosystem, Yoroi Wallet, a leading lightweight wallet, has partnered with Bring, a white-label crypto cashback platform, to connect the Cardano community with global retail. This collaboration will enable users to earn ADA as cashback when shopping at more than 775 international retailers. This is a development that will increase the trading volume of ADA. On the 4-hour chart, the price is pricing above the 50 EMA (Blue Line) and the 200 EMA (Black Line). At the same time, the 50 EMA has been below the 200 EMA since October 6. As of today, the 50 EMA has overlapped with the 200 EMA. This shows us that the trend may be in an upward trend. The Chaikin Money Flow (CMF)20 indicator has a negative value. Therefore, we can see that there are money outflows. This caused the price to hit the support level of the ascending triangle pattern. As a matter of fact, ADA, which tested the ceiling level of the ascending triangle pattern for the fourth time, tested the floor of the ascending triangle pattern and started to rise. If the uptrend continues, it may test the resistance level of 0.3651 once again. If it fails to break the 0.3651 level, it may be followed as a good buying place by pointing to a potential decline towards the support zone of the ascending triangle pattern again.
Supports 0.3514 – 0.3469 – 0.3393
Resistances 0.3651 – 0.3735 – 0.3809
AVAX/USDT
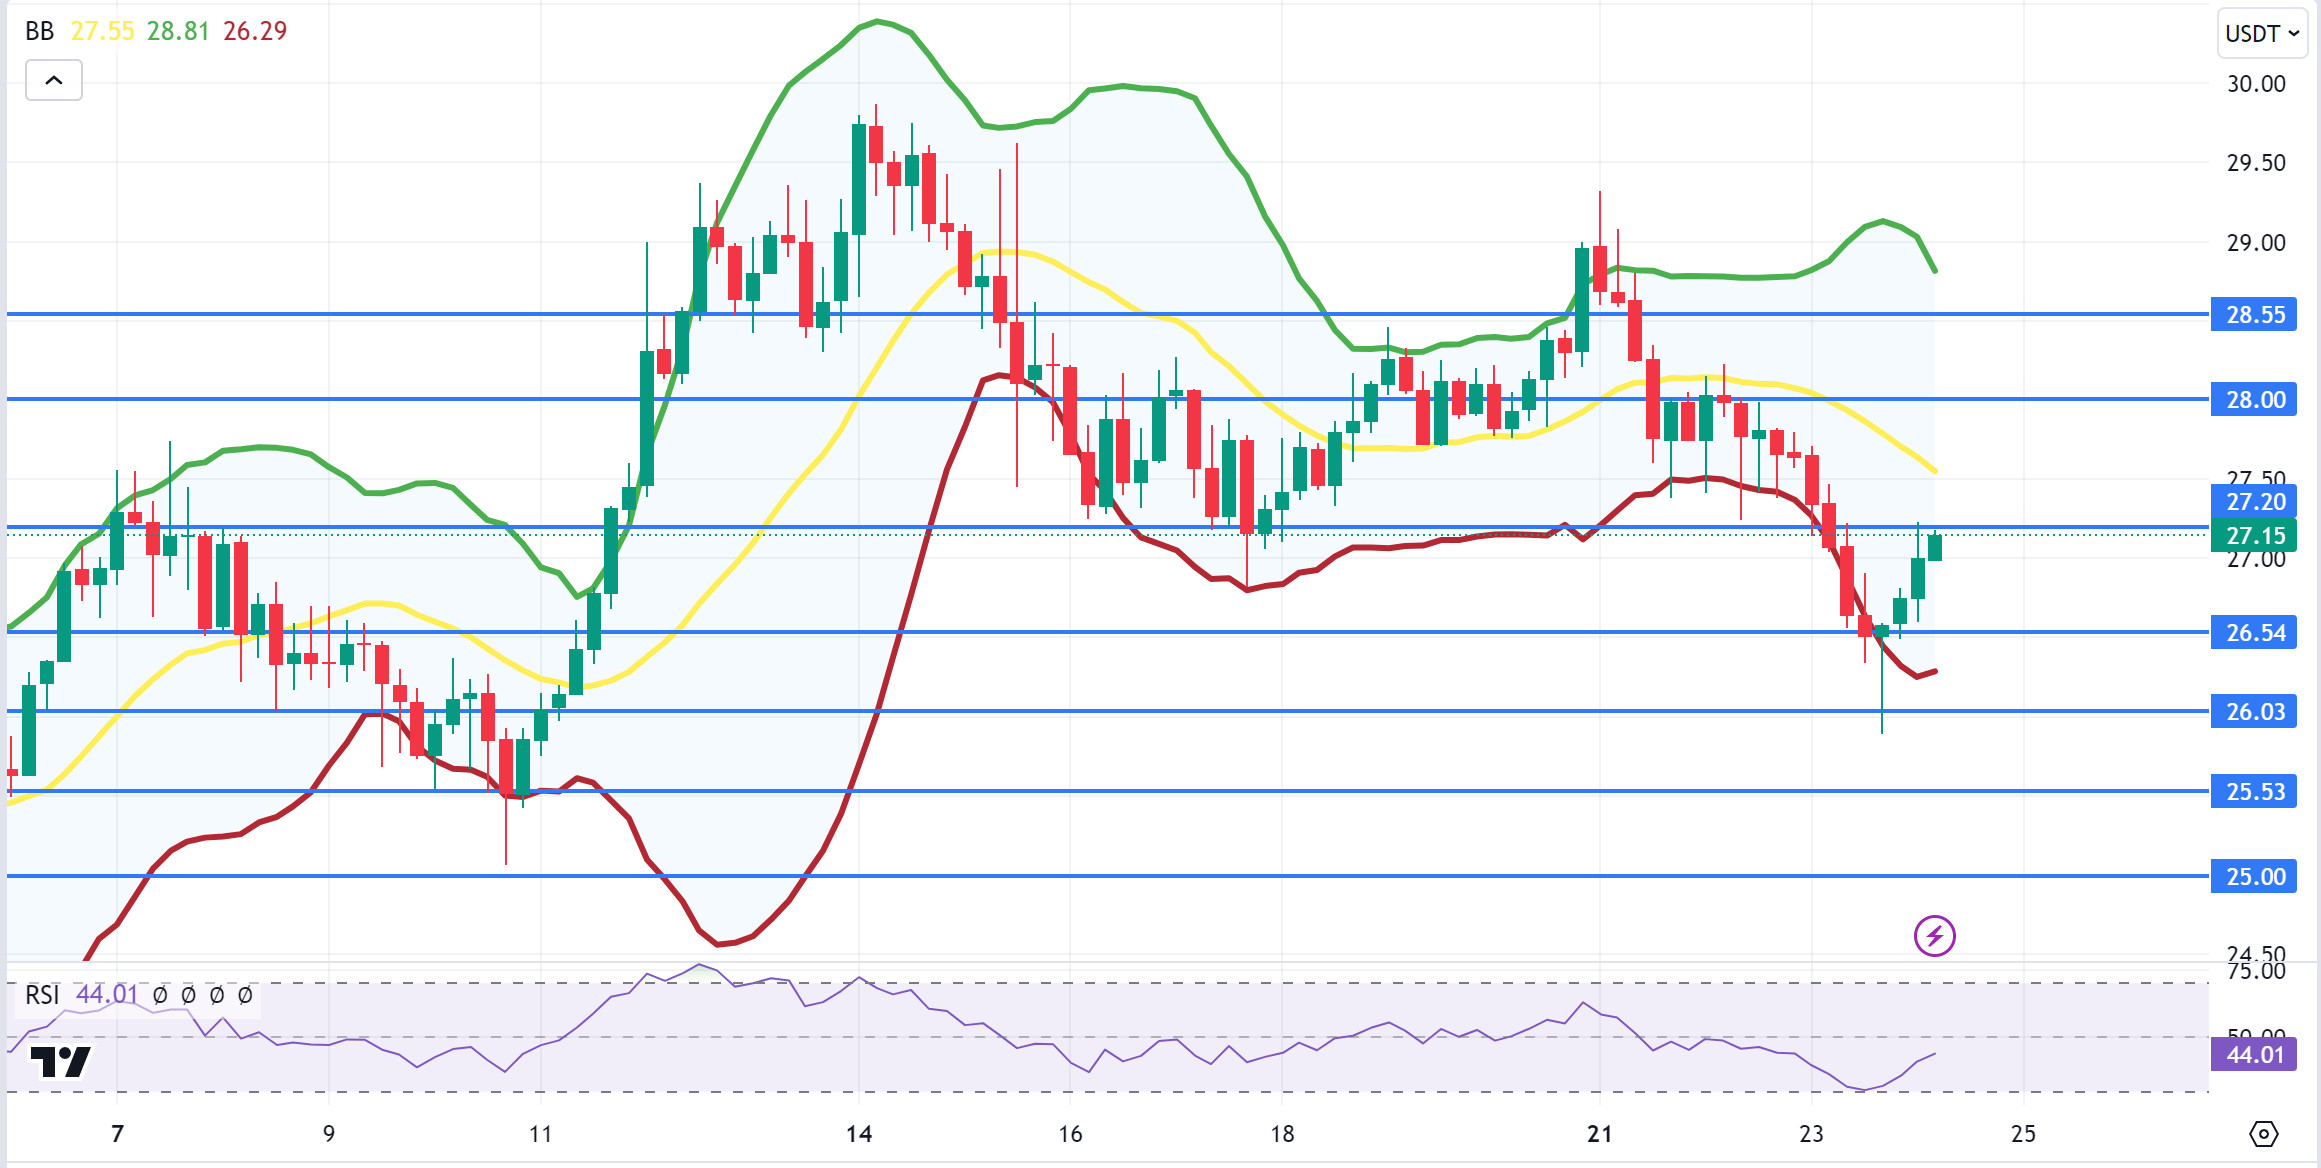
AVAX, which opened yesterday at 27.65, fell 3% during the day and closed the day at 26.75. Today, unemployment claims, manufacturing purchasing managers index, services purchasing managers index and new home sales data will be released especially by the US. A much higher-than-expected increase in applications for unemployment benefits or a much lower-than-expected announcement of the services and manufacturing purchasing managers’ indices may have a negative impact as it will increase the recession anxiety in the market. In addition, news flows from the Middle East will be important for the market.
AVAX, which is currently trading at 27.15, is in the Bollinger middle band on the 4-hour chart. With a Relative Strength Index value of 44, it can be expected to rise slightly from these levels and move to the upper band. In such a case, it may test the 28.00 resistance. On the other hand, sales may increase if the fear of recession is triggered after the data to be announced or news of increased tension in the Middle East. In such a case, it may test 26.54 support. As long as it stays above 25.00 support during the day, the desire to rise may continue. With the break of 25.00 support, sales may increase.
Supports 26.54 – 26.03 – 25.53
Resistances 27.20 – 28.00 – 28.55
TRX/USDT
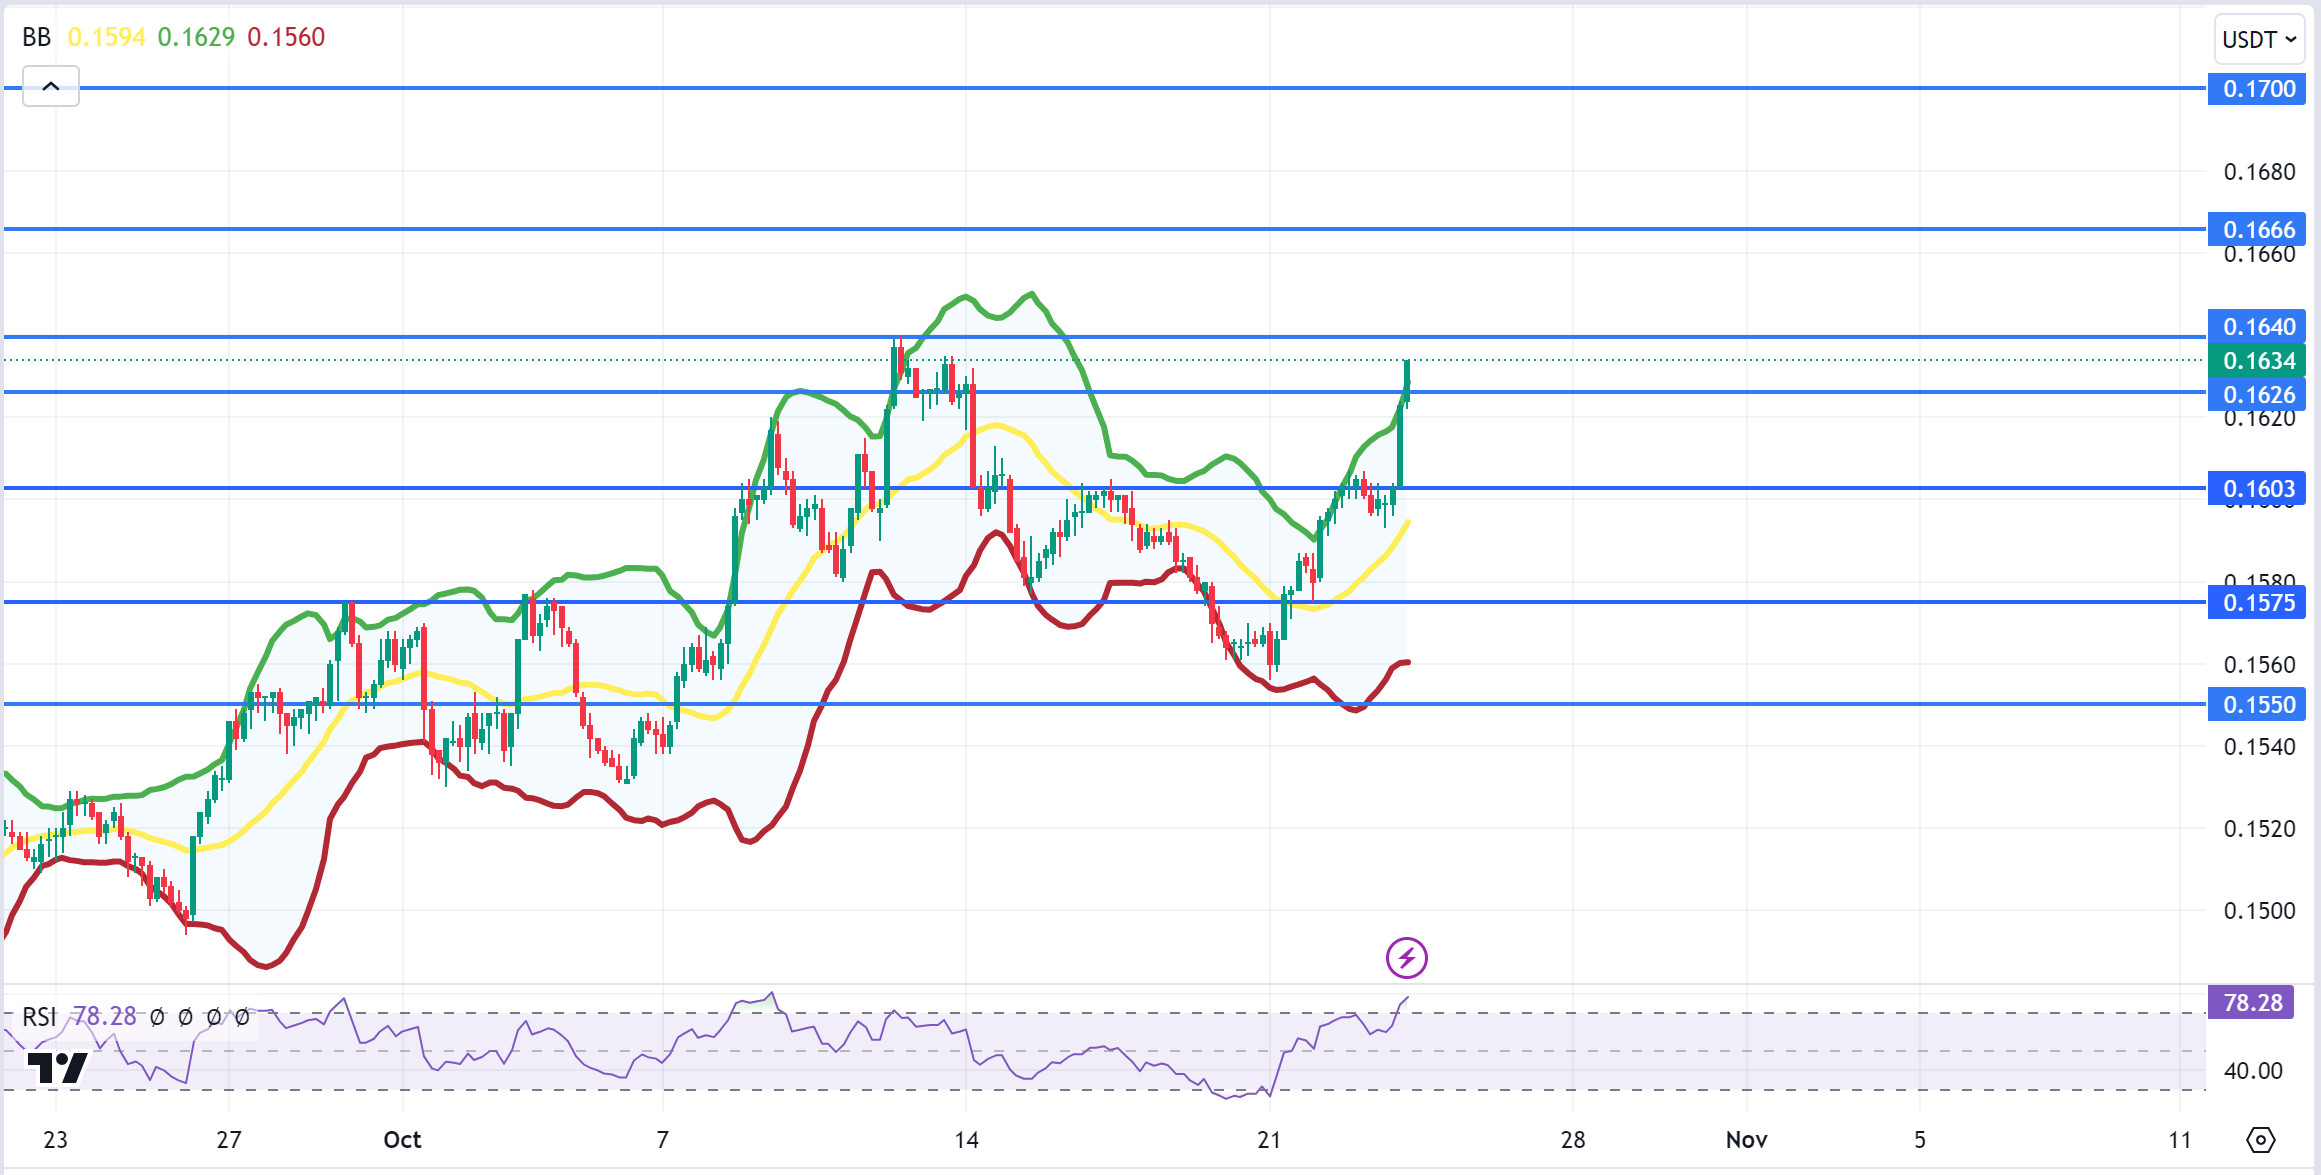
TRX, which started yesterday at 0.1603, moved horizontally during the day and closed the day at 0.1603 again. Today, the market will be following unemployment claims, manufacturing purchasing managers index, services purchasing managers index and new home sales data. Data released in line with expectations may have a positive impact. The market will also be closely following the news flows regarding the tension in the Middle East.
TRX, which is currently trading at 0.1634, is at the Bollinger upper band on the 4-hour chart. The Relative Strength Index value is in the overbought zone with 78 and can be expected to decline slightly from its current level. In such a case, it may move to the middle band of the channel and test the 0.1603 support. However, it cannot close the candle below 0.1603 support and may test 0.1666 resistance with the buying reaction that will occur if news flow comes that the tension in the Middle East is decreasing. As long as TRX stays above 0.1482 support, the desire to rise may continue. If this support is broken downwards, sales can be expected to increase.
Supports 0.1626 – 0.1603 – 0.1575
Resistances 0.1640 – 0.1666 – 0.1700
DOT/USDT
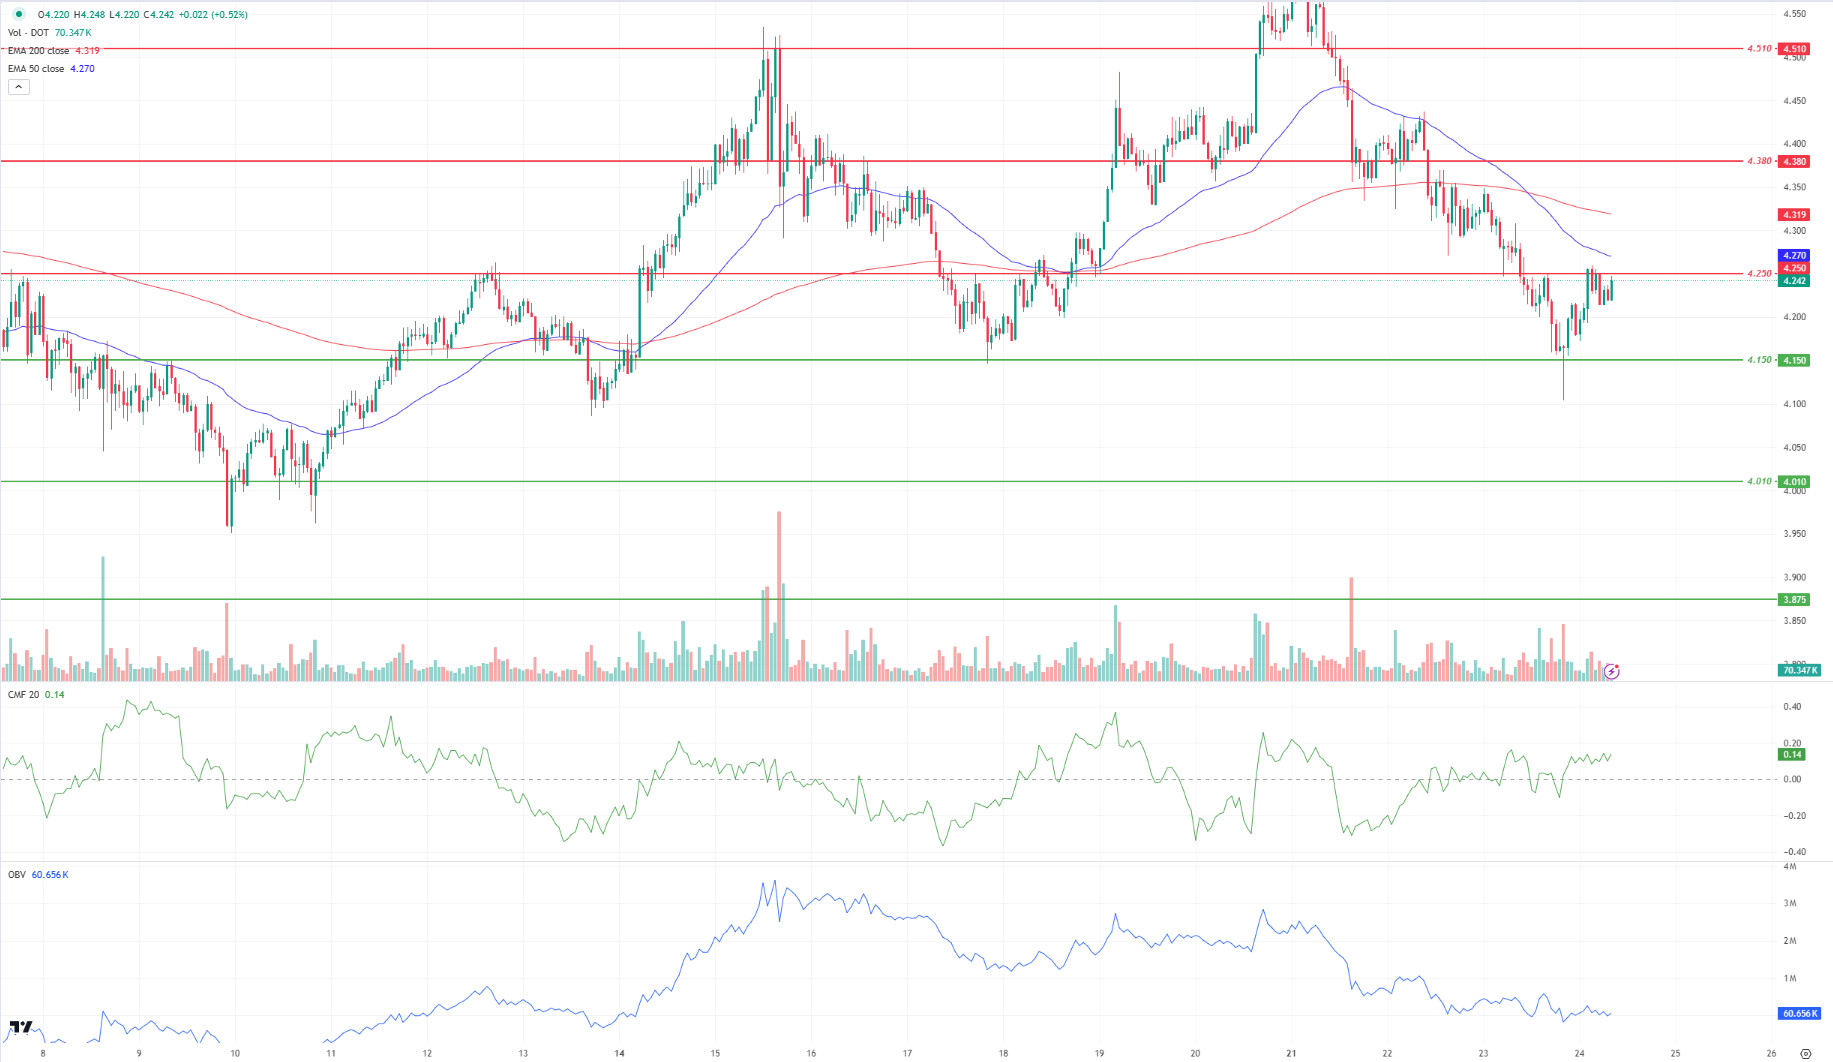
Apillon, the developer platform for Polkadot (DOT), has introduced embedded wallets to facilitate Web3 login. The solution offers a user-friendly experience using familiar login credentials with EVM-compatible blockchains. It secures user data using Oasis Network’s privacy-focused architecture. This innovation can increase adoption of the Polkadot ecosystem by combining the simplicity of Web2 with the security of Web3.
When we examine the DOT chart, the price reacted from the support level of 4.150 after the positive divergence between the Money Flow Index (MFI) oscillator and the price and rose to the resistance level of 4.250. When we examine the On Balance Volume (OBV) oscillator, we see that there is a negative divergence between it and the price. In this context, if the price cannot maintain above the EMA50 (Blue Line) level, we may see a movement towards the 4.150 support level. On the other hand, when we examine the Chaikin Money Flow (CMF) oscillator, we see that the buyer pressure is strong. In this context, the price may move towards the 4,250 resistance level.
Supports 4,150 – 4,010 – 3,875
Resistances 4.250 – 4.380 – 4.510
SHIB/USDT
Shiba Inu’s (SHIB) burn rate increased by 365,668%, with a total of 27.49 million SHIBs burned. This increase is aimed at reducing the supply of SHIB and could potentially raise the token’s value. However, price volatility will remain dependent on market conditions and investor sentiment.
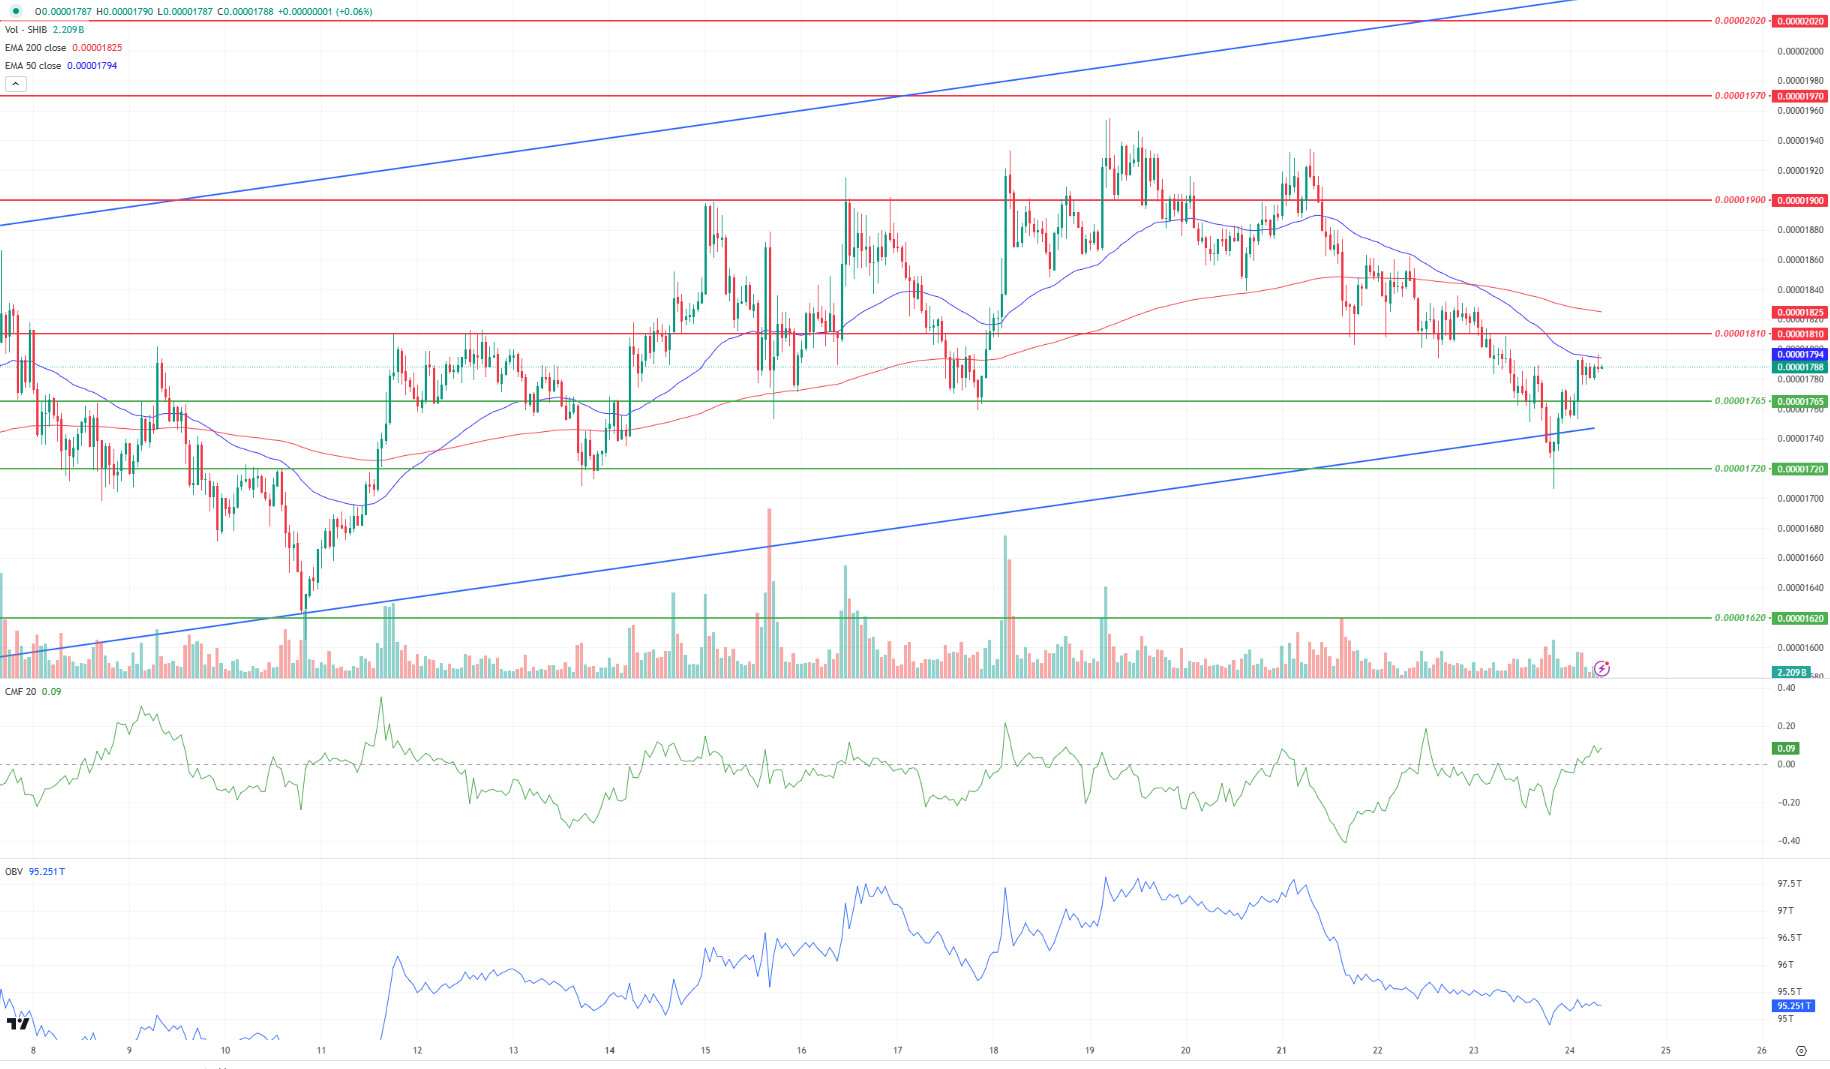
When we examine the SHIB chart, the price reacted from the support level of 0.00001720 after the positive divergence between the Chaikin Money Flow (CMF) oscillator and the price and showed an increase up to the EMA50 (Blue Line) level. When we analyze the On Balance Volume (OBV) oscillator, we see that there is a negative divergence between it and the price. In this context, the price may retest the 0.00001765 support level. On the other hand, when we examine the Chaikin Money Flow (CMF) oscillator, we see that the buyer pressure is stronger. Accordingly, if the price maintains above the EMA50 level, we may see a movement towards the next resistance level of 0.00001810.
Supports 0.00001765 – 0.00001720 – 0.00001620
Resistances 0.00001810 – 0.00001900 – 0.00001970
LEGAL NOTICE
The investment information, comments and recommendations contained herein do not constitute investment advice. Investment advisory services are provided individually by authorized institutions taking into account the risk and return preferences of individuals. The comments and recommendations contained herein are of a general nature. These recommendations may not be suitable for your financial situation and risk and return preferences. Therefore, making an investment decision based solely on the information contained herein may not produce results in line with your expectations.
