
TECHNICAL ANALYSIS
BTC/USDT
In its financial report, Strategy announced an unrealized loss of $5.91 billion in the first quarter of the year due to the purchase of 80,715 BTC. On the other hand, as the US House of Representatives prepares to discuss crypto regulations on May 6, trade tariff tensions between China and the US are evolving into a renegotiation process. Institutional interest in Bitcoin continues in Europe as well as Japan, with Metaplanet expanding its buying plan by issuing bonds, while Blockchain Group aims to buy 260,000 BTC by 2033. Bitcoin spot ETFs also recorded a net inflow of 422 million dollars yesterday, supporting this positive picture. Today, eyes will be on the US Non-Farm payrolls and Unemployment rates, which are among the critical macro data we mentioned in the calendar.
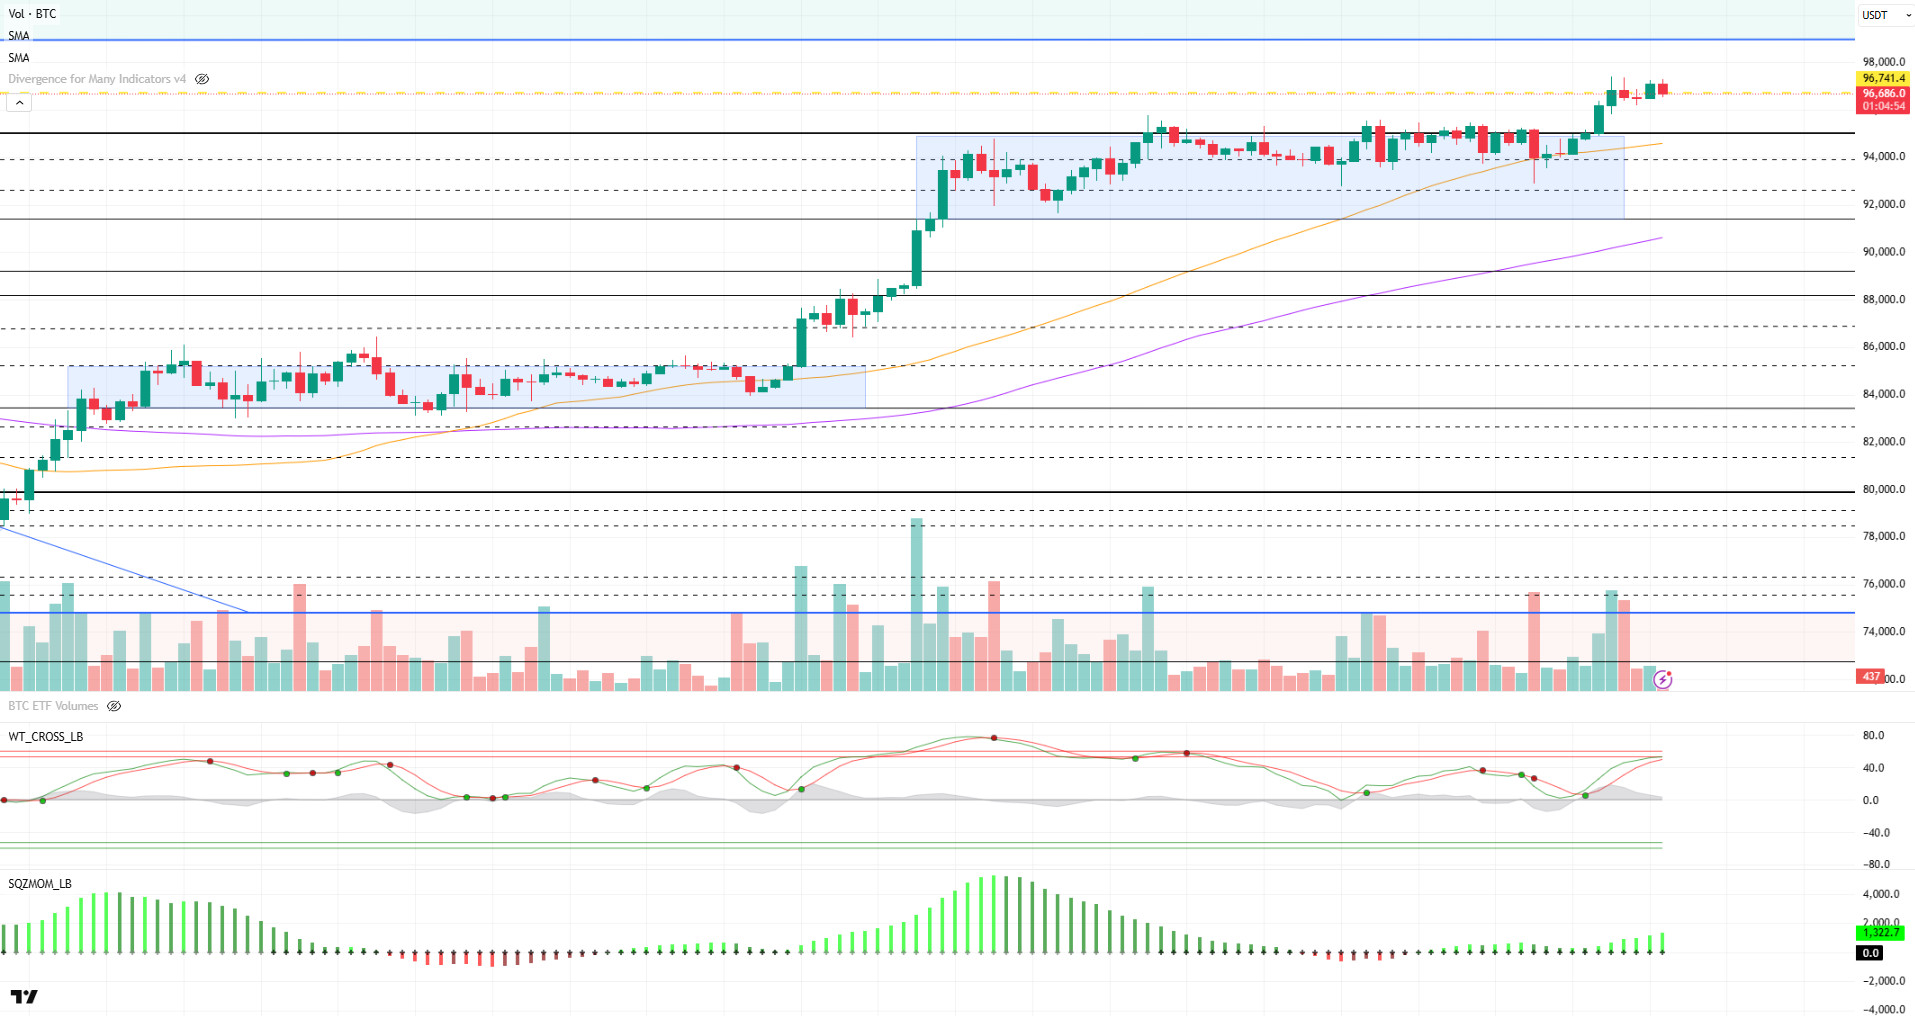
Looking at the technical outlook, BTC, which is correlated with the balance sheet data of technology companies and the effect of the rises in traditional markets, exceeded the 95,000 level and tested the 97,350 level. This move allowed the price to complete the consolidation phase after the technical structure created a bullish backdrop, as we have previously analyzed. While the Wave Trend oscillator maintained its buy signal in the overbought zone, the weakness in momentum indicators caused the price to reject the 97,000 band. The liquidity zone, indicated by the yellow dashed line, saw a high rate of position liquidation. The continuation of positive inflows on the ETF side simultaneously with the rise stands out as a factor that continues to support the price on the fundamental side. However, with the intensification of buying positions, technical indicators are approaching the saturation point again, raising the possibility of a possible correction. In this context, the 95,000 level will be followed as a critical support point. Maintaining above this level is important for the uptrend to continue and regain momentum. Otherwise, hourly closes below 95,000 may increase selling pressure and lead to a retest of 94,000 and then 92,800 levels. On the other hand, macroeconomic data to be released today, especially those that may affect the Fed’s interest rate policies, are expected to create significant volatility on the market. This could play a decisive role in BTC’s short and medium-term direction.
Supports 95,000 – 94,000 – 92,800
Resistances 97,000 – 98,000 – 99,100
ETH/USDT
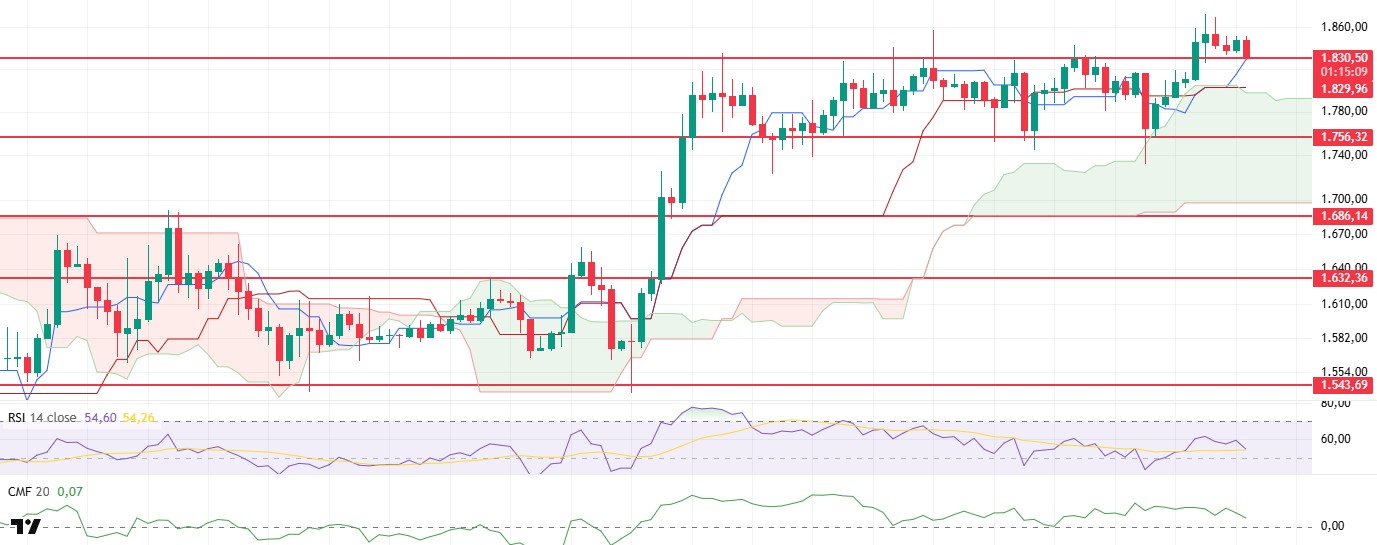
ETH signaled a short-term recovery by rising above the $1,870 level yesterday. However, this rise was not accompanied by a significant strengthening in technical indicators, signaling that the movement could remain limited. As a matter of fact, as emphasized in the analysis made yesterday evening, the expected retreat took place with the effect of technical weaknesses and the price fell to the support zone at $1.829.
Analyzing the technical outlook, especially the Chaikin Money Flow (CMF) indicator continues to trend down. This trend indicates that the selling pressure on the spot side continues and liquidity outflows are on the rise. In other words, although the price has risen, this rise has not been supported by strong buying interest from market participants, which poses a significant risk to the sustainability of the rise. In terms of the Ichimoku indicator, the fact that the price is still holding above the tenkan level indicates that the positive outlook persists in the short term. The upward trend of the Tenkan level also supports this view. However, in case this area is lost, the possibility that the price may retreat to the upper band of the kumo cloud on the ichimoku indicator should not be ignored. This indicates a threshold zone that should be carefully monitored in terms of the short-term trend. On the momentum indicators side, weakness continues. In particular, the Relative Strength Index (RSI) retreated towards the based MA line, revealing that the price could not sustain the upward momentum and lost momentum. This pullback of the RSI can be considered as another sign that the uptrend is technically shaped on weak fundamentals.
In general assessment, closes below the $1,829 level during the day may pave the way for the price to retreat to the kumo cloud limits on the ichimoku indicator. If this possibility materializes, the $1,798 level will be followed as the first intermediate support point, and if this level is broken down, the downward movement may deepen to $1,756.
Top of Form
Below the Form
Supports 1,756 – 1,686 – 1,632
Resistances 1,829 – 1,925 – 2,131
XRP/USDT
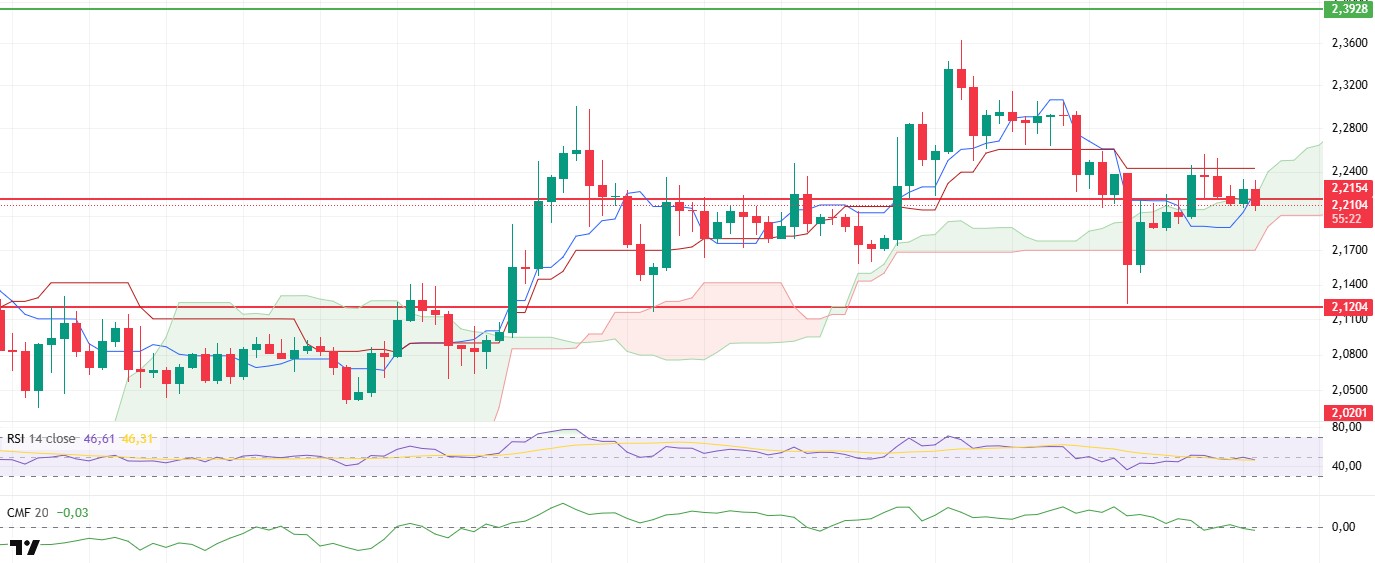
XRP climbed as high as $2.24 yesterday, accelerating towards the kijun zone, an important level on the ichimoku indicator. However, with the resistance it encountered at this level, the upward movement lost momentum and remained limited, and the price retreated back to the support area at $2.21. The technical outlook has started to produce weaker signals with this pullback.
In particular, the Chaikin Money Flow (CMF) indicator did not accompany the short-term rise in the price and turned negative, continuing its downward trend. This indicates that the selling pressure in the spot market continues and liquidity outflows from the market are intense. The CMF turning negative suggests that the market’s participation in upside moves has diminished and that the uptrend has not been supported by strong capital inflows. Technical weaknesses are also becoming evident on the momentum side. Relevant indicators show that the upward momentum has diminished and selling pressure has come to the fore. This weakening in momentum suggests that the price has become more vulnerable to downward movements and that sharp sales may be triggered on possible support breaks. Looking at the Ichimoku indicator, the fact that the price has fallen below the tenkan level again stands out as a development that strengthens the negativity in the short-term outlook. Persistence below the Tenkan level indicates that the weakness on the buyer side continues and the pressure may increase in the short term.
In line with this technical structure, if the $2.21 level is broken down during the day, the price is likely to face a steeper retracement. In such a scenario, the $2.17 level stands out as the first intermediate support. If this level is also violated downwards, it may become possible for the decline to deepen and continue to the level of $2.12.
Supports 2.1204 – 2.0201 – 1.8932
Resistances 2.2154 – 2.3938 – 2.4721
SOL/USDT
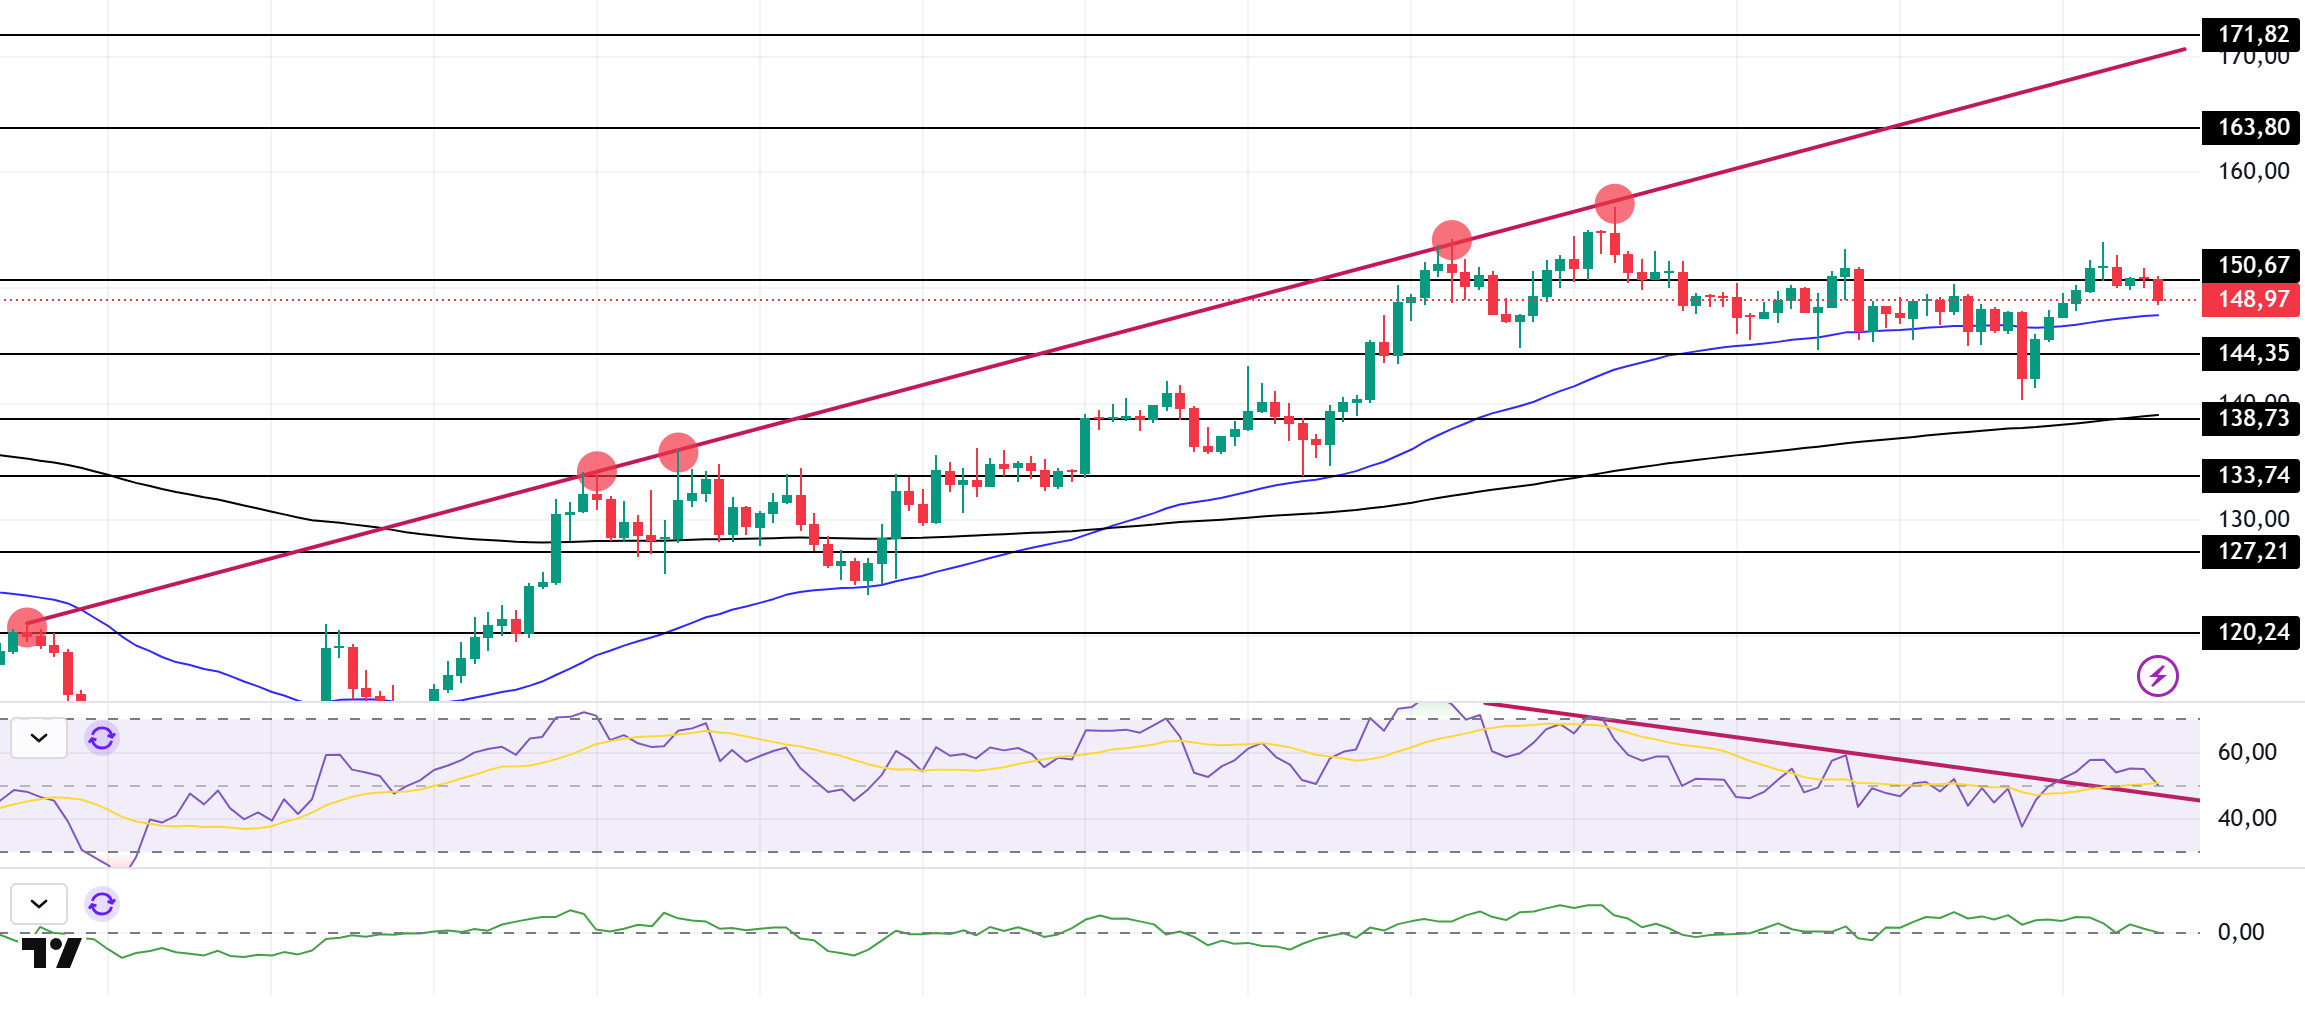
SOL price moved sideways and maintained its level. The asset continues to trade below the resistance level of the ascending line that started on April 6. As of now, it manages to stay above the 50 EMA (Blue Line) and tests the $150.67 level, which is a strong resistance. On the 4-hour chart, the 50 EMA (Blue Line) remains above the 200 EMA (Black Line). This suggests that the uptrend may continue in the medium term. In addition, the fact that the price remains above both moving averages suggests that buying pressure continues across the market. Chaikin Money Flow (CMF20) hovers at neutral levels; however, a decline in daily volume may cause CMF to reach negative territory. Relative Strength Index (RSI14) has broken the downtrend that started on April 23 to the upside. But selling pressure continues. This may cause it to test the downtrend as support. In case of an uptrend on the back of macroeconomic data or positive news on the Solana ecosystem, the $163.80 level stands out as a strong resistance point. If this level is broken upwards, the rise can be expected to continue. If there are pullbacks due to contrary developments or profit realizations, the $138.73 level may be retested. In case of a decline to these support levels, the increase in buying momentum may offer a potential bullish opportunity.
Supports 144.35 – 138.73 – 133.74
Resistances 150.67 – 163.80 – 171.82
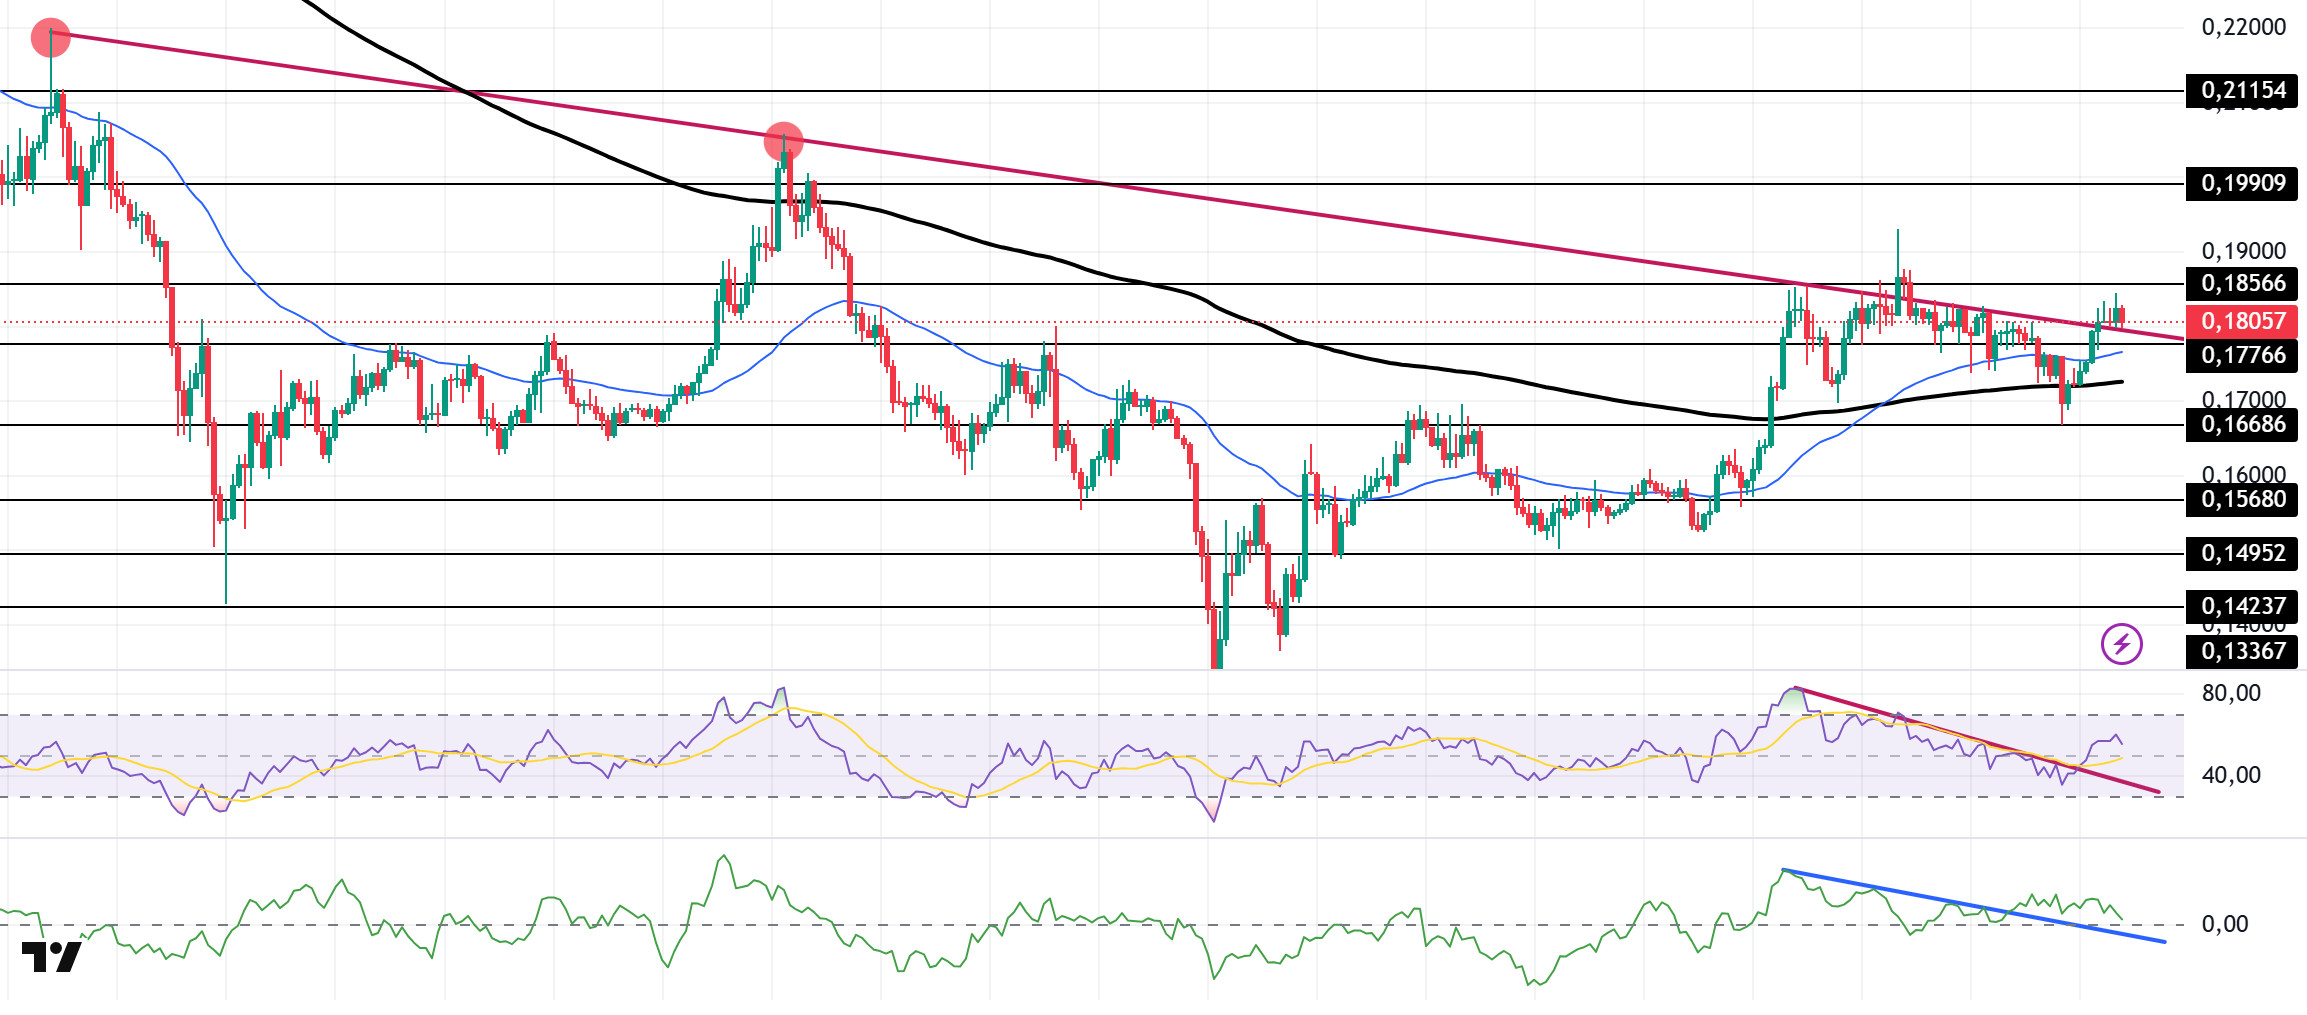
DOGE/USDT
DOGE price continued its uptrend. The asset managed to break the downtrend that started on March 6 and stay above it. It is currently testing the downtrend as support. If it sees support and accelerates from here, the resistance level of $0.18566 can be followed. On the 4-hour chart, the 50 EMA continues to be above the 200 EMA. The fact that the price is above both moving averages indicates that the upward momentum is strong in the medium term. The Chaikin Money Flow (CMF20) indicator remains in positive territory, but a decline in inflows could move CMF into negative territory and test the downtrend that started on April 22 as support. This suggests that bullish moves may continue. Relative Strength Index (RSI14) continued to be in positive territory. It also remains above the downtrend that started on April 23. These indicate that the uptrend will strengthen. The $0.19909 level stands out as a strong resistance zone in the event of a rally in line with political developments, macroeconomic data or positive news flow in the DOGE ecosystem. In the opposite case or possible negative news flow, the $0.16686 level may be retested. In case of a decline to these levels, the increase in momentum may start a new bullish wave.
Supports 0.17766 – 0.16686 – 0.15680
Resistances 0.18566 – 0.19909 – 0.21154
Legal Notice
The investment information, comments and recommendations contained herein do not constitute investment advice. Investment advisory services are provided individually by authorized institutions taking into account the risk and return preferences of individuals. The comments and recommendations contained herein are of a general nature. These recommendations may not be suitable for your financial situation and risk and return preferences. Therefore, making an investment decision based solely on the information contained herein may not produce results in line with your expectations.


