
Active Addresses
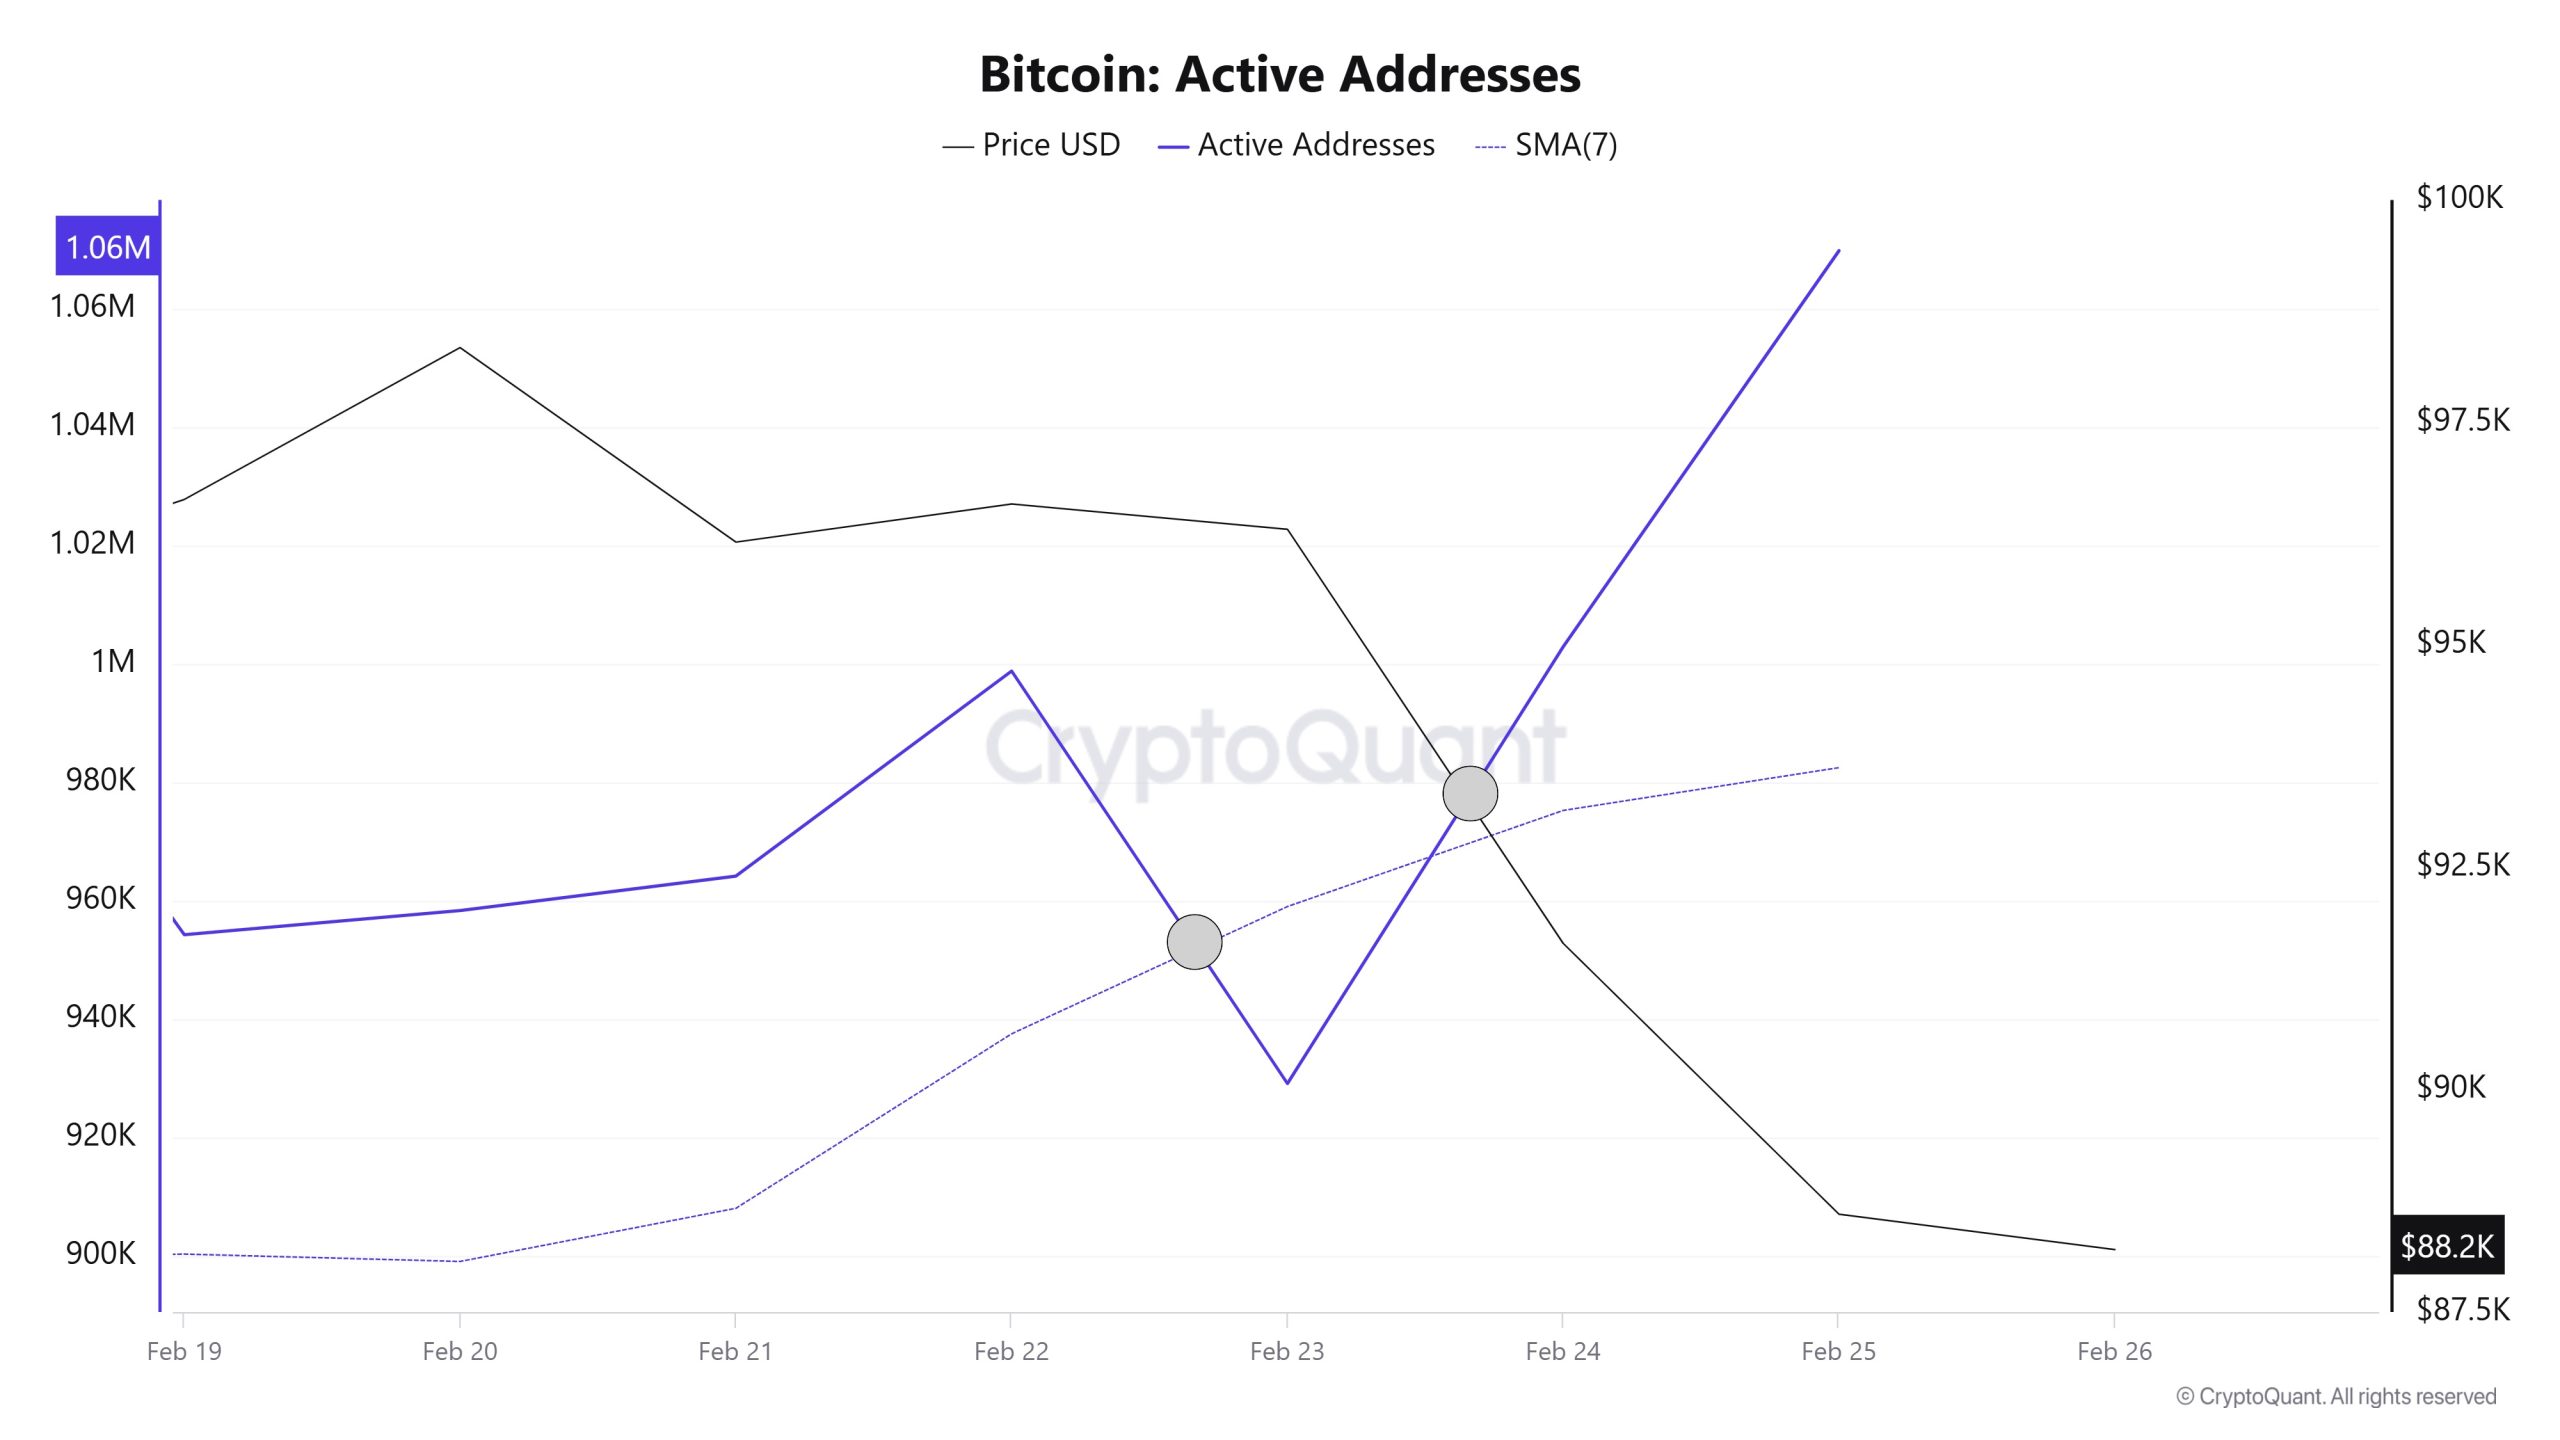
In terms of active addresses, there were 1,069,978 active entries on the BTC network this week between February 19 and February 26, 2025. During this period, Bitcoin fell from a price of $98,000 to $88,000. In the area marked on the chart where the price and the number of active addresses intersect, we see that Bitcoin purchases are gradually decreasing. When we follow the 7-day simple moving average, we observe that the price follows a downward trend on the dates when this average cuts the price. This situation indicates that the Bitcoin price is experiencing entries from the $ 88,000 levels
Active Sending Addresses
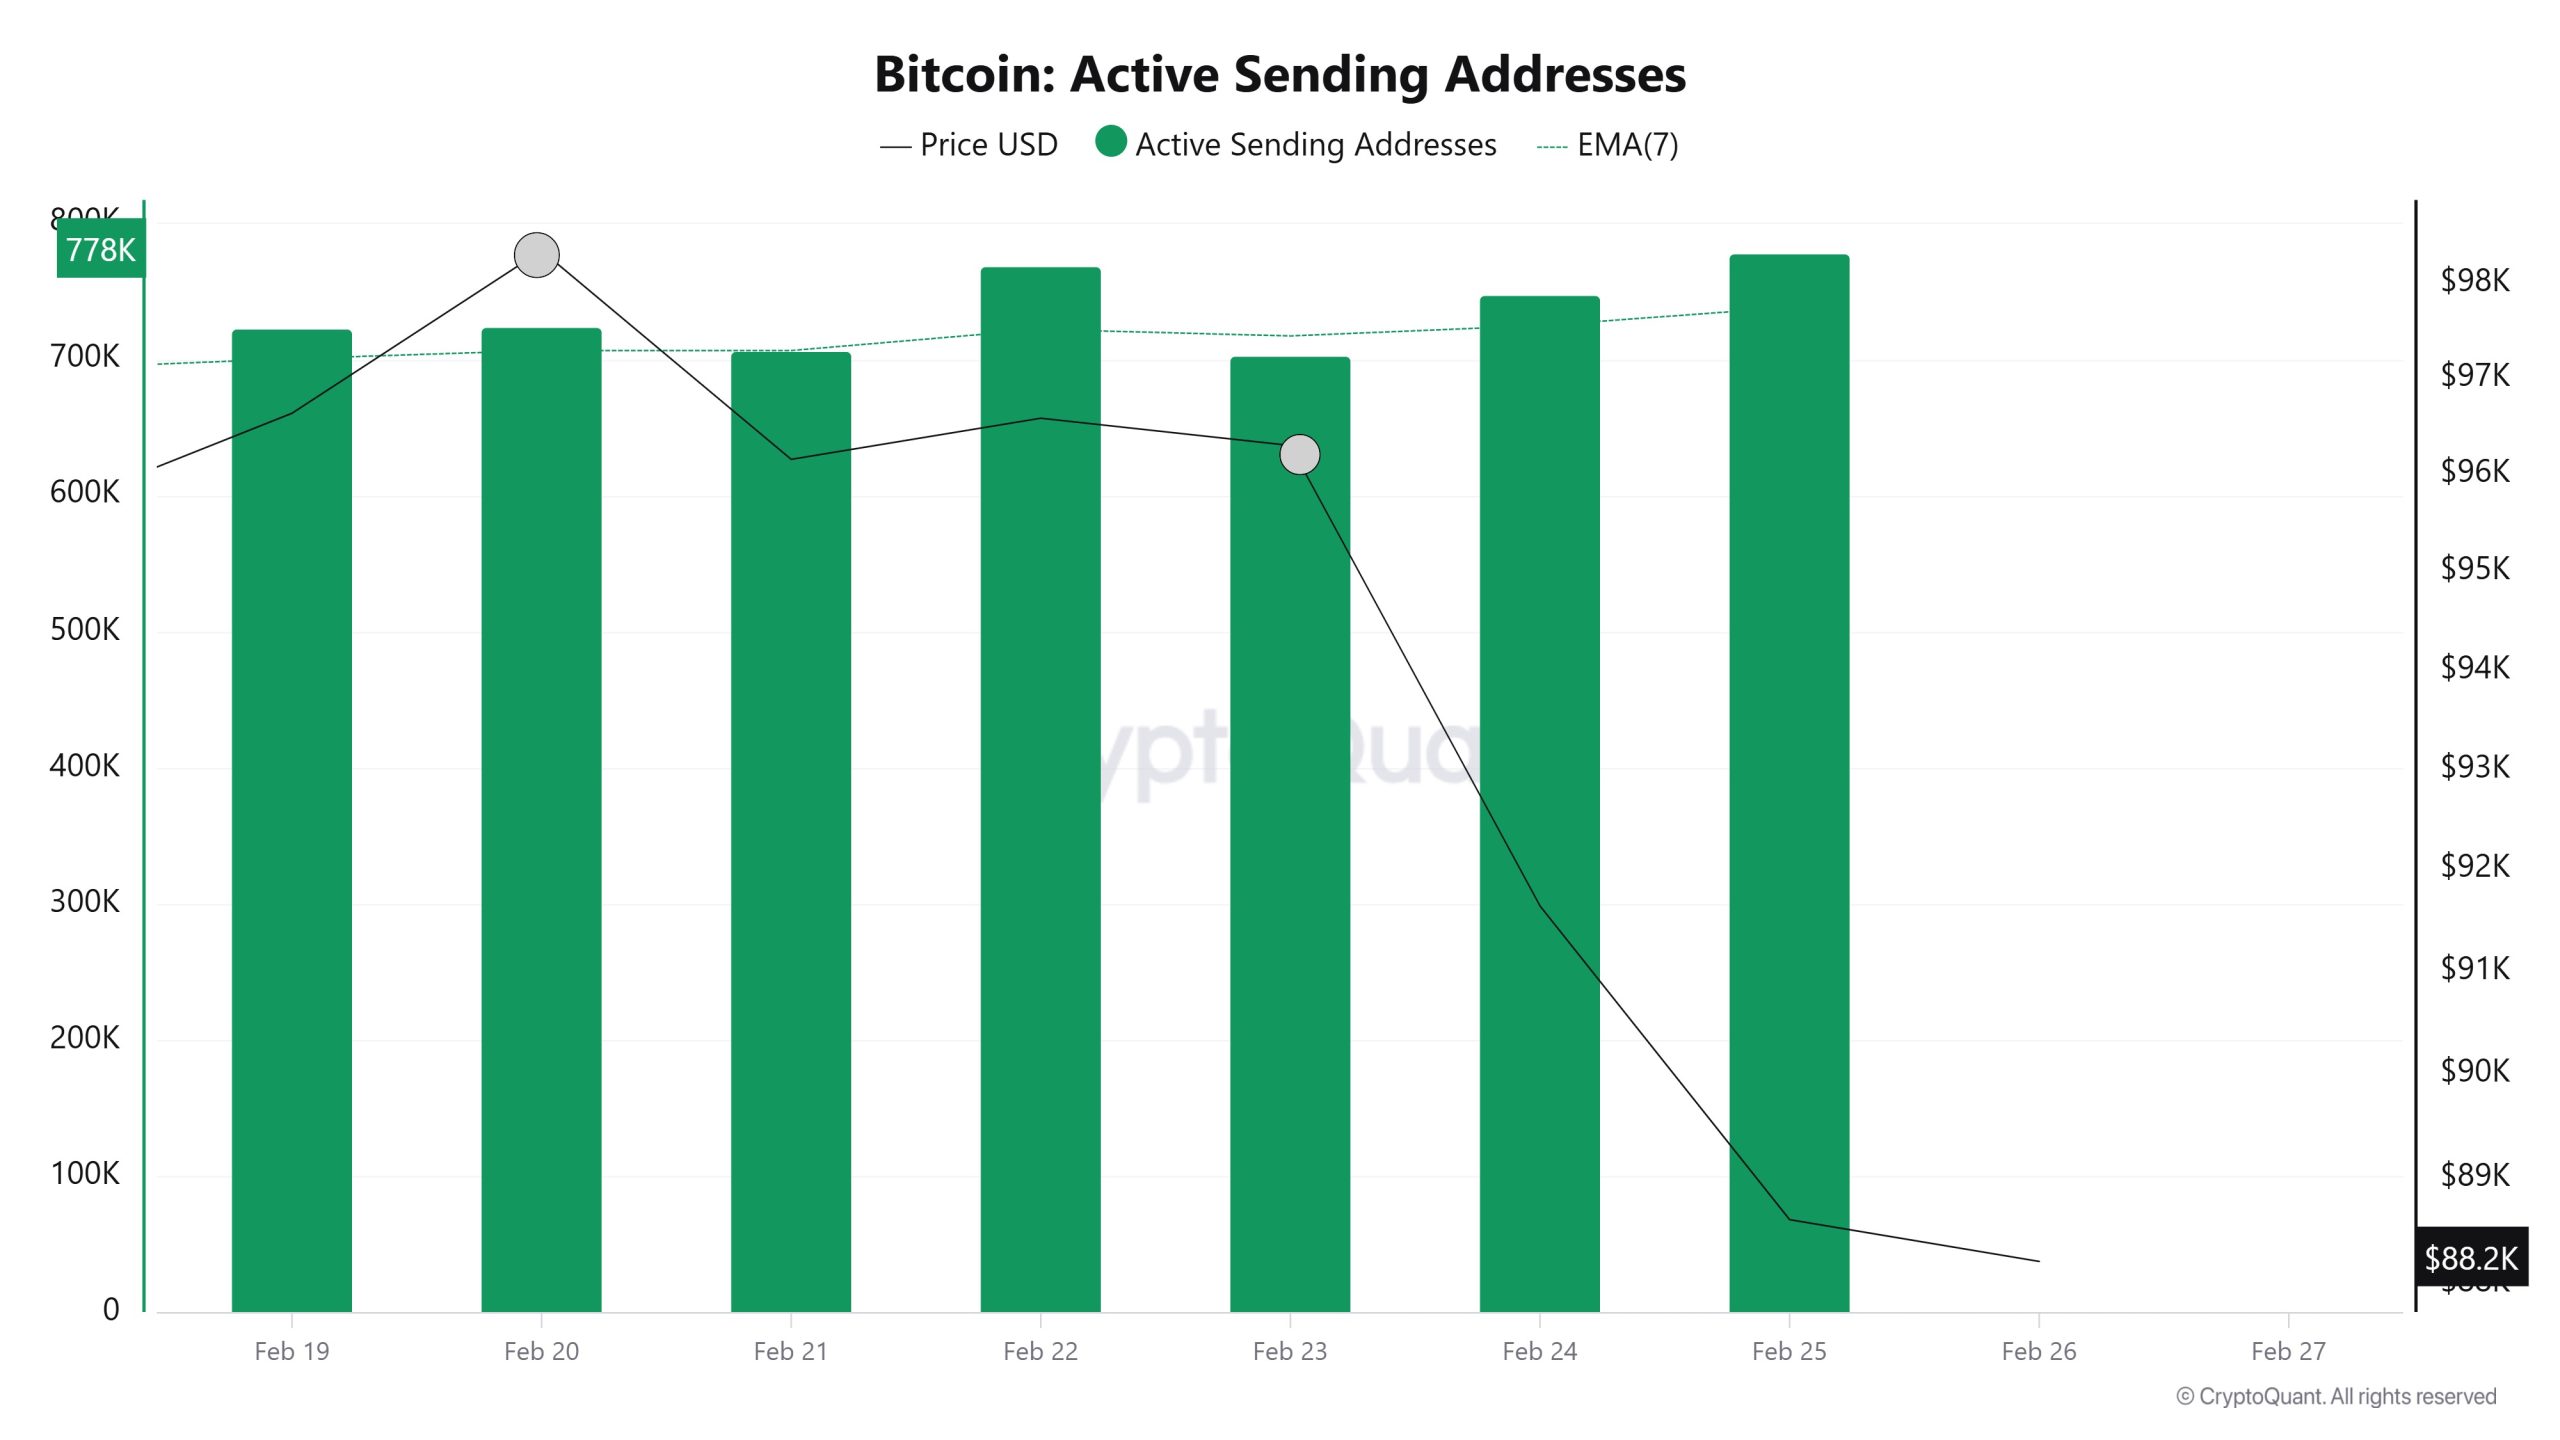
Along with the Black Line (price line) in active shipping addresses, there was a significant drop in active shipping addresses towards February 23rd. On the day when the price hit its lowest point, active sending addresses rose as high as 778,059, indicating that buyers sold their positions as Bitcoin stayed around 96,000 for a while. As a result, price drops seem to cause an acceleration in sending addresses.
Active Receiving Addresses
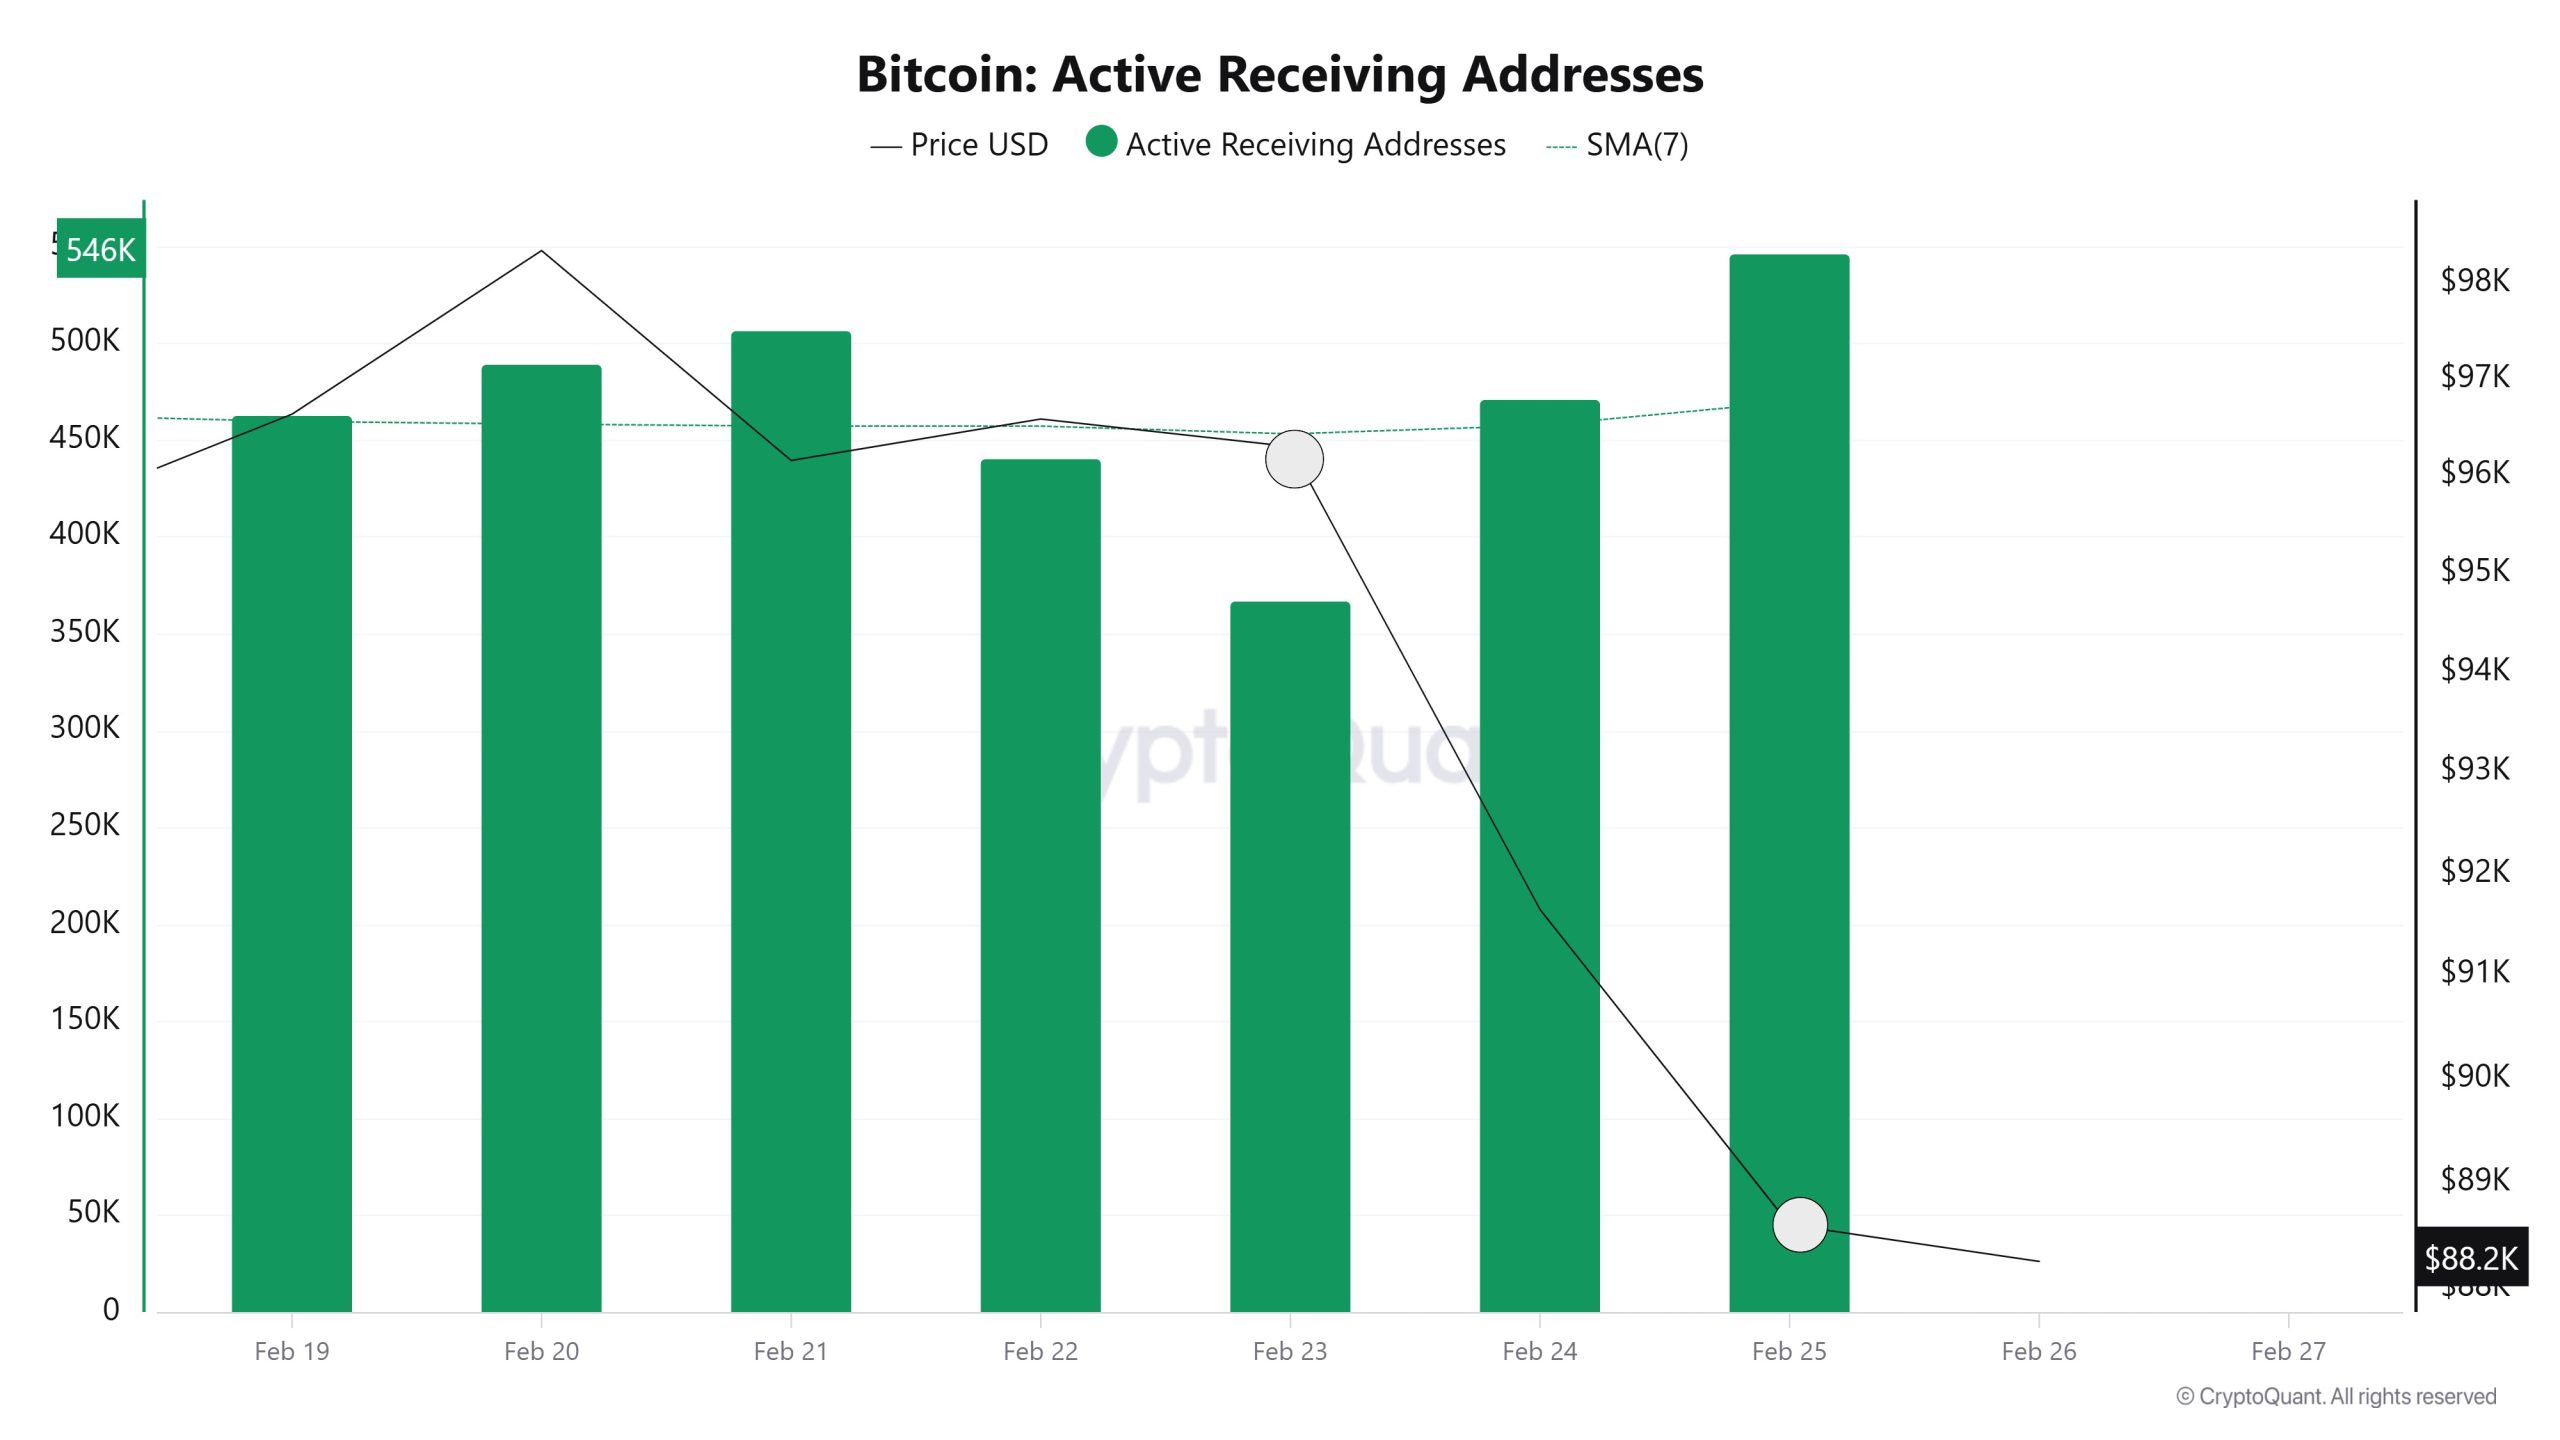
In the active buyer addresses, it is seen that on February 21, February 21, when the price was 96,000, the number of buyers approached the highest levels of 506,993 levels and the longest buying level was at the level where investors went to increase their bitcoin positions. However, the chart shows an increase in investors’ buying addresses at 88,590 and 91,640. This may indicate the costing levels of buyers before the price rises.
Breakdowns
MRVR
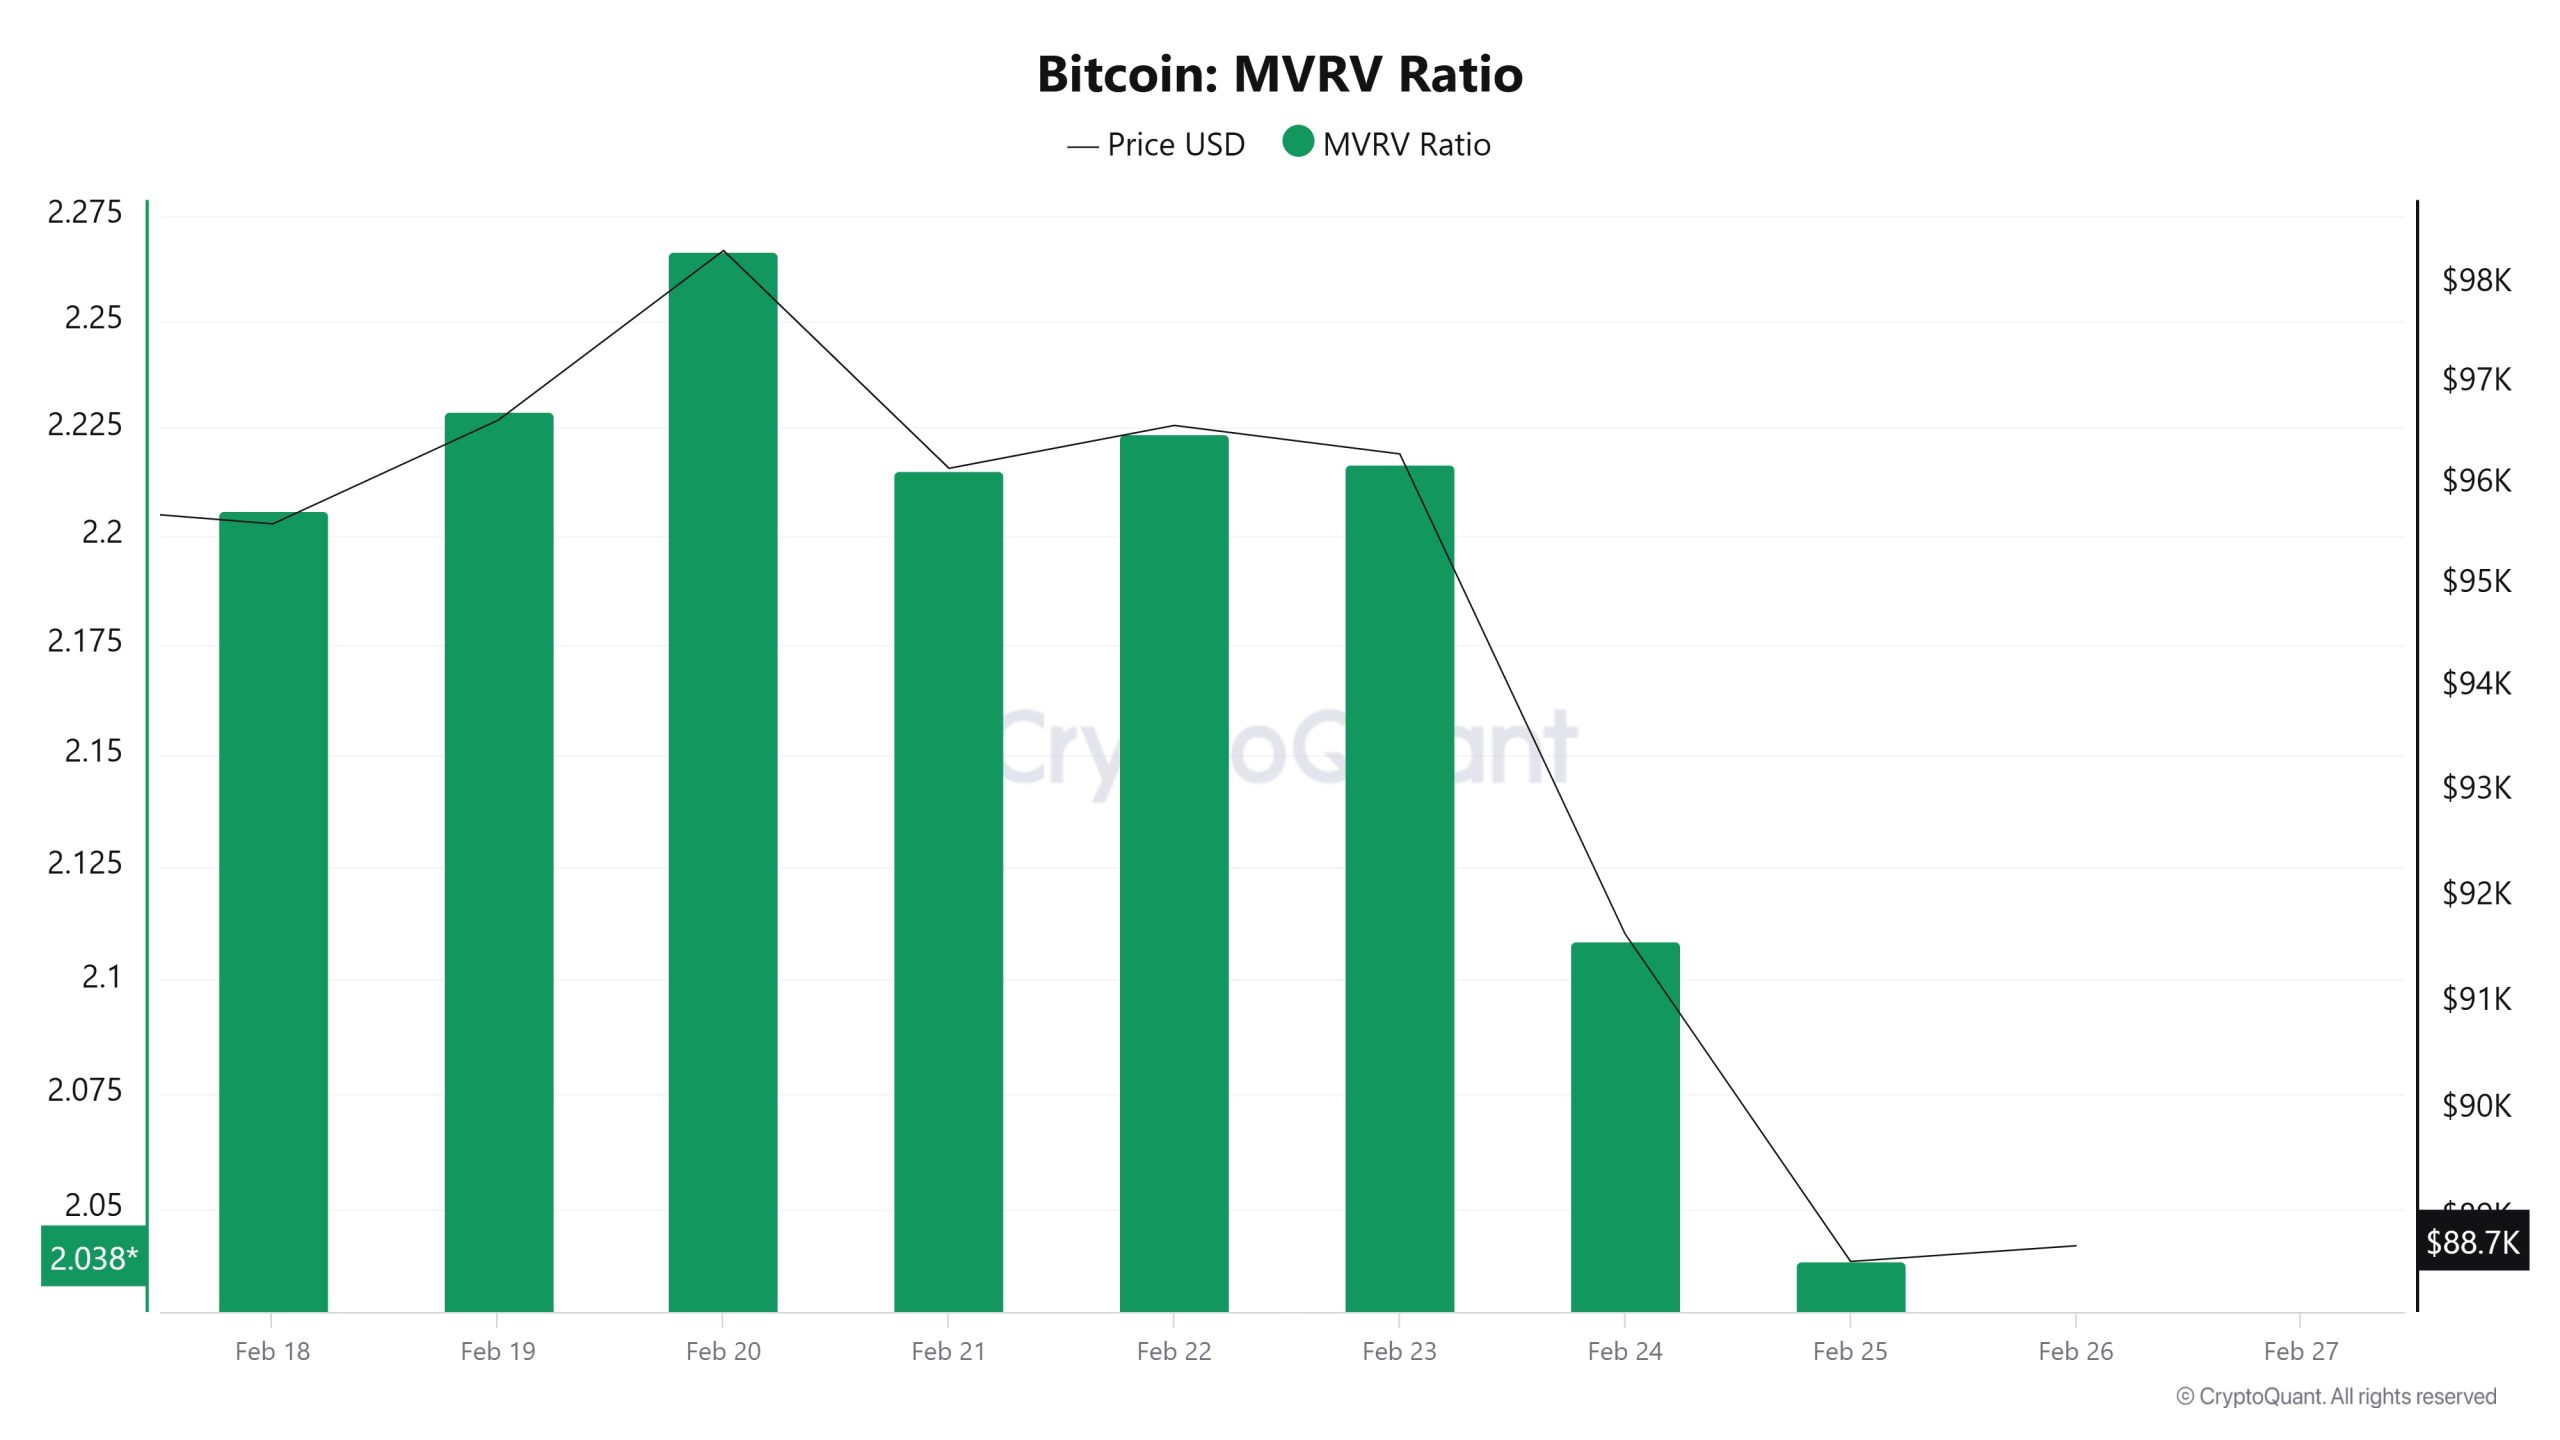
On February 19, the Bitcoin price was 96,633 while the MVRV Ratio was 2.22. As of February 25, the Bitcoin price was down to 88,598 while the MVRV Ratio was 2.03. Compared to last week, Bitcoin price decreased by 8.31% and MVRV Ratio decreased by 8.56%.
Realized Price
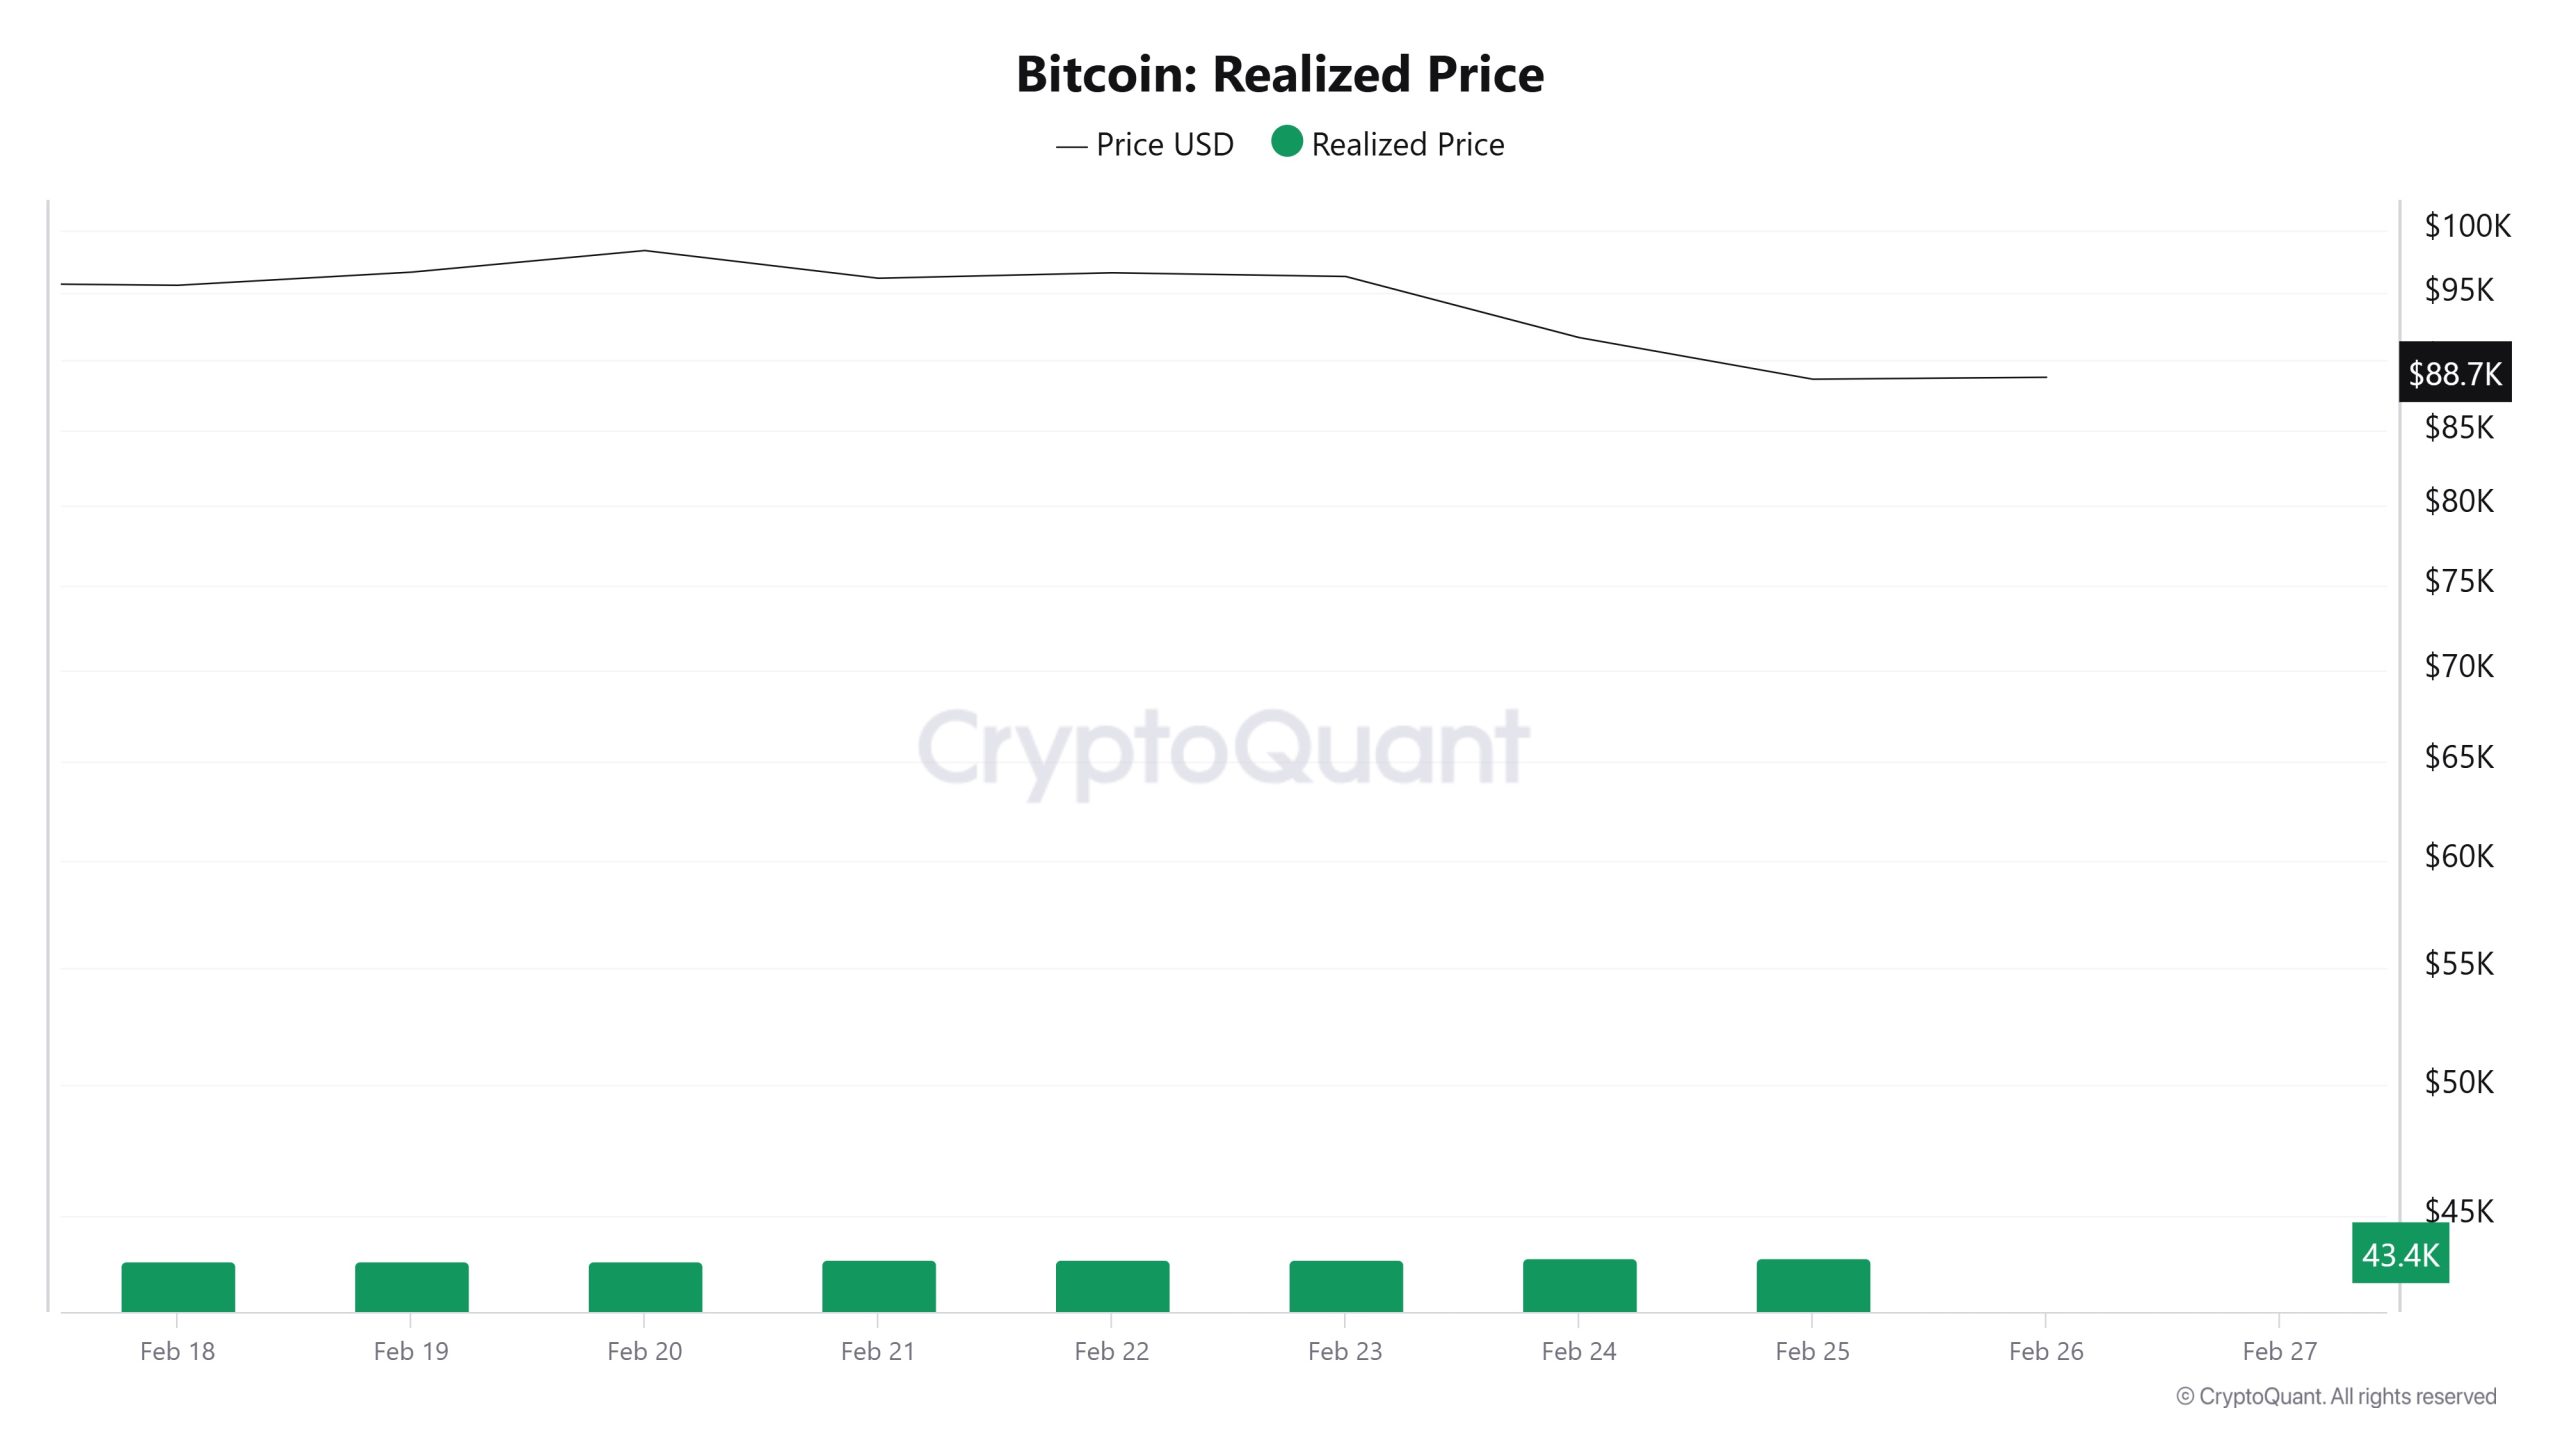
On February 19, the Bitcoin price was 96,633 while the Realized Price was 43,357. As of 25 February, Bitcoin price was down to 88,598 while Realized Price was up to 43,454. Compared to last week, Bitcoin price decreased by 8.31% while Realized Price increased by 0.22%.
Spent Output Profit Ratio (SOPR)
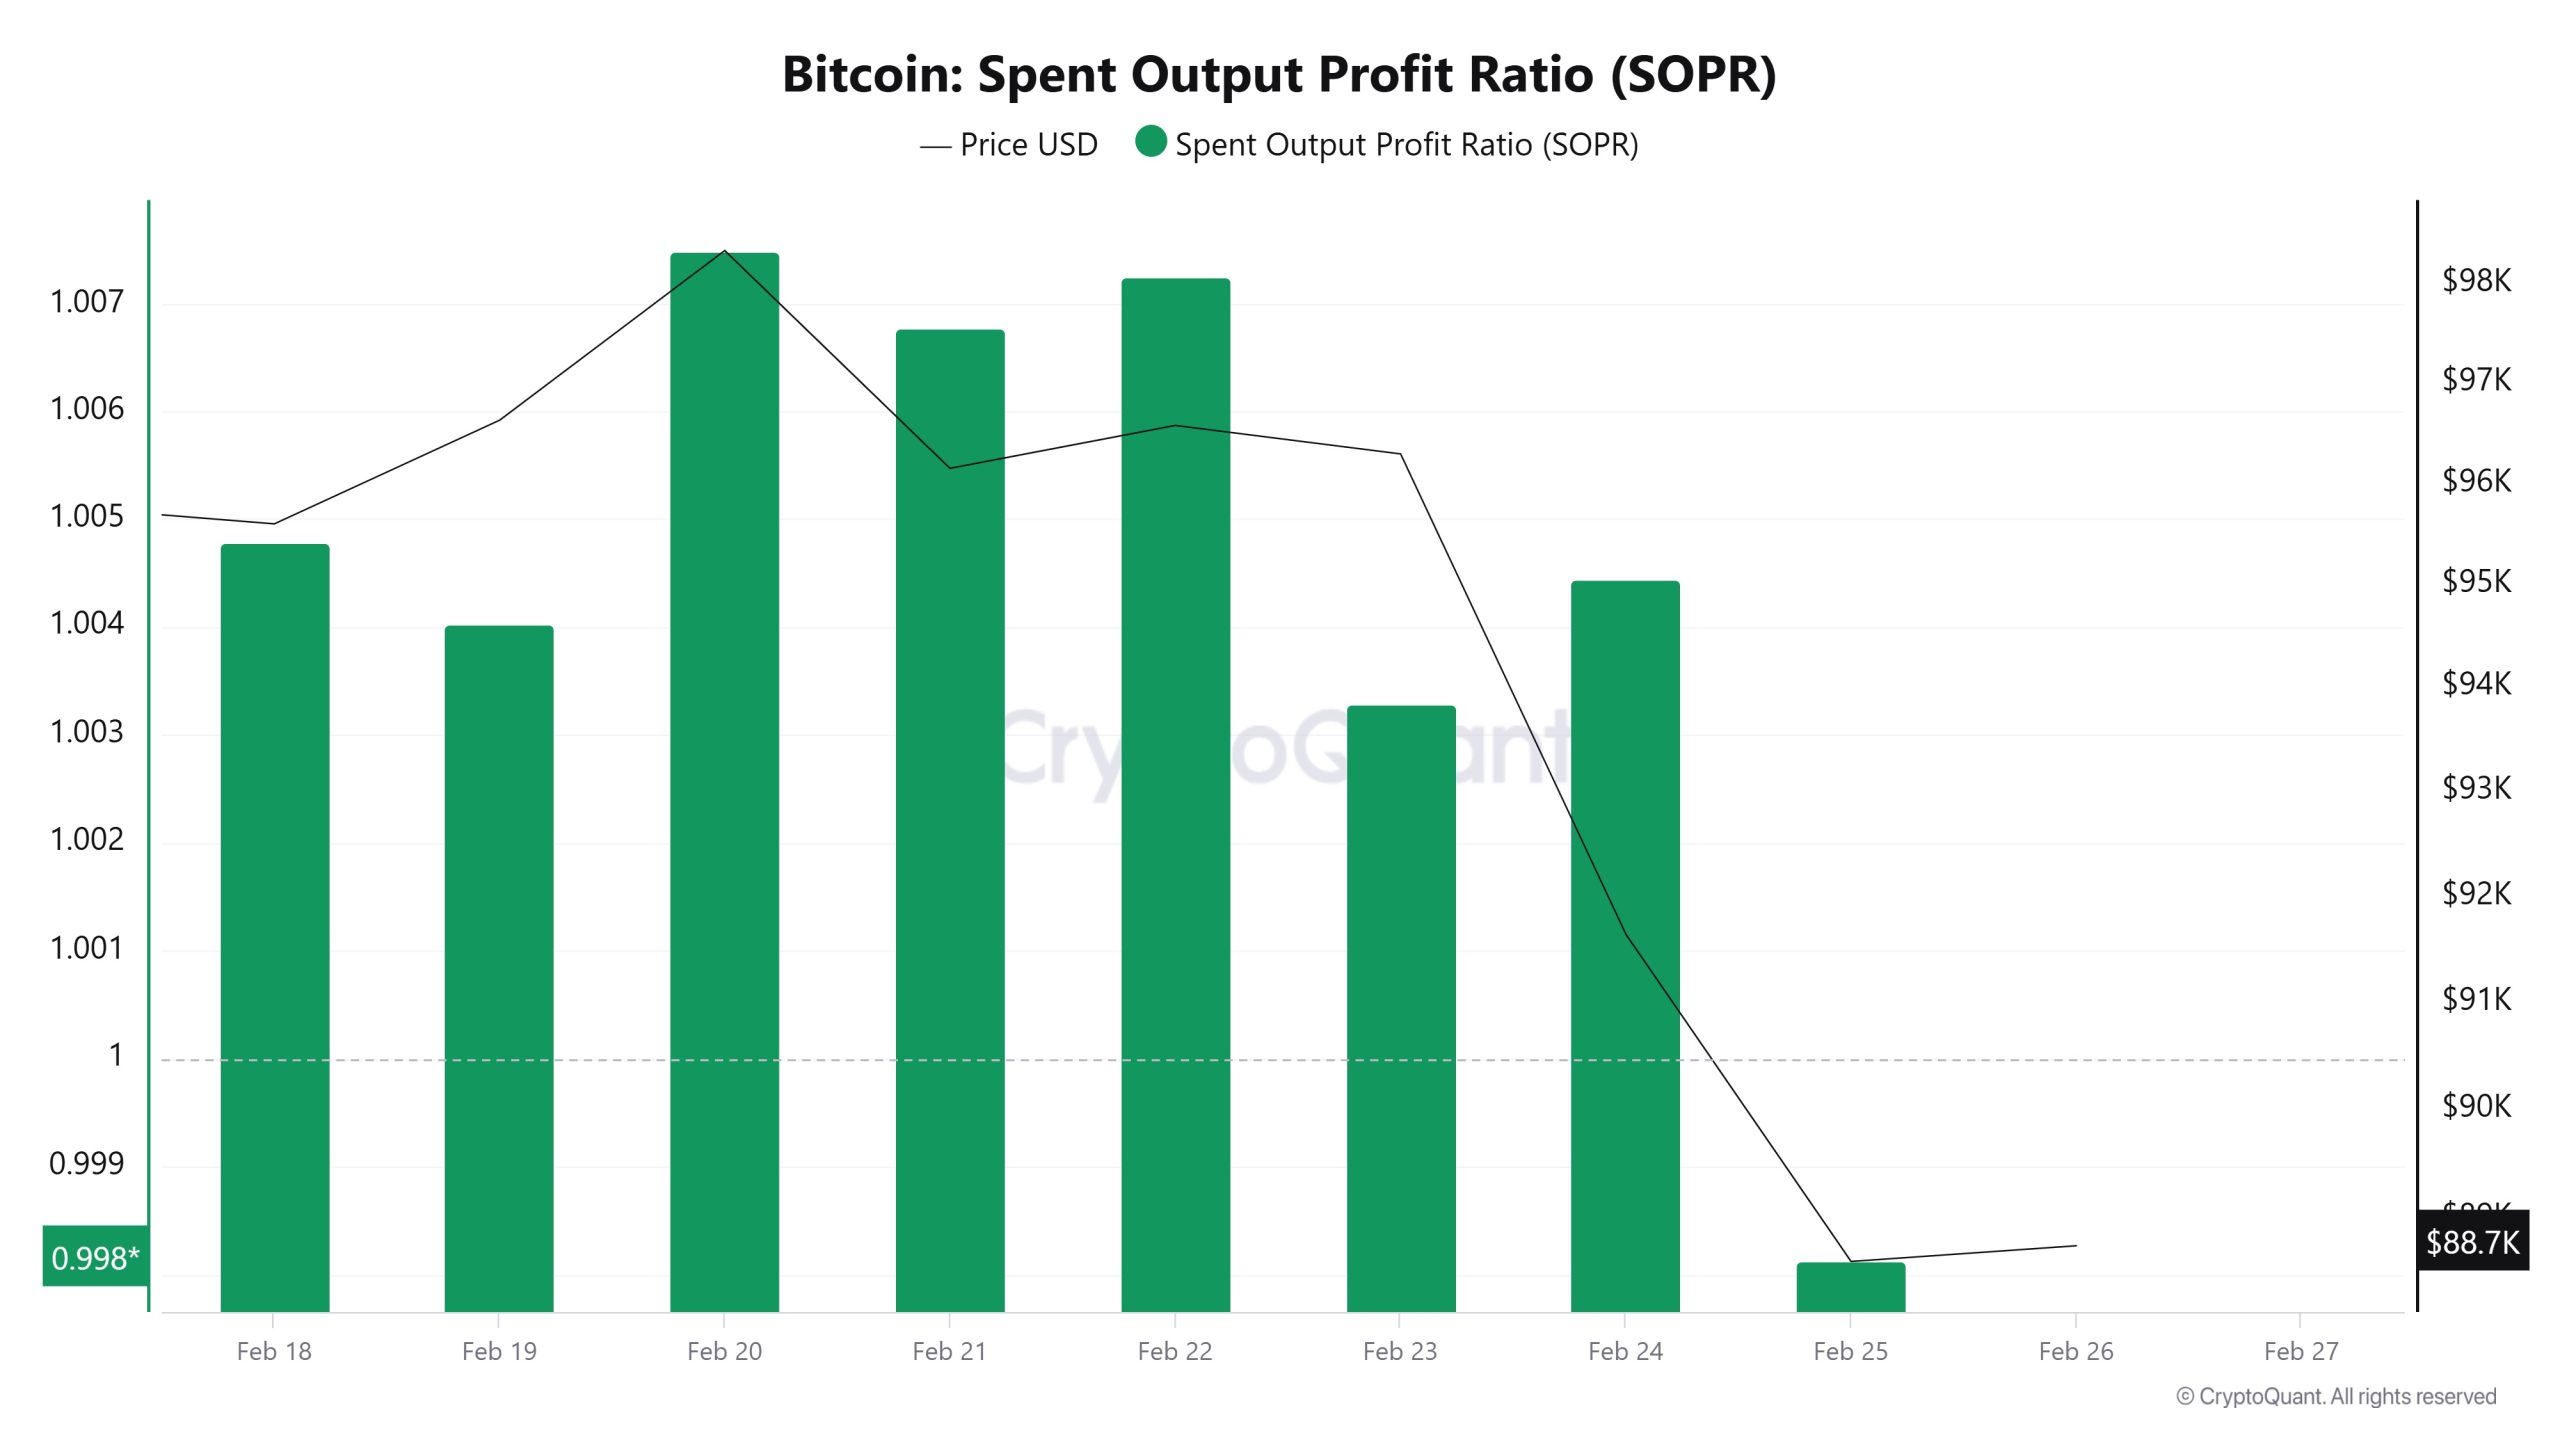
On February 19, the Bitcoin price was 96,633, while the SOPR metric was 1.004. As of February 25, the Bitcoin price fell to 88,598 while the SOPR metric dropped to 0.998. Compared to last week, the Bitcoin price has decreased by 8.31% and the SOPR metric by about 0.6%.
Derivatives
Open Interest
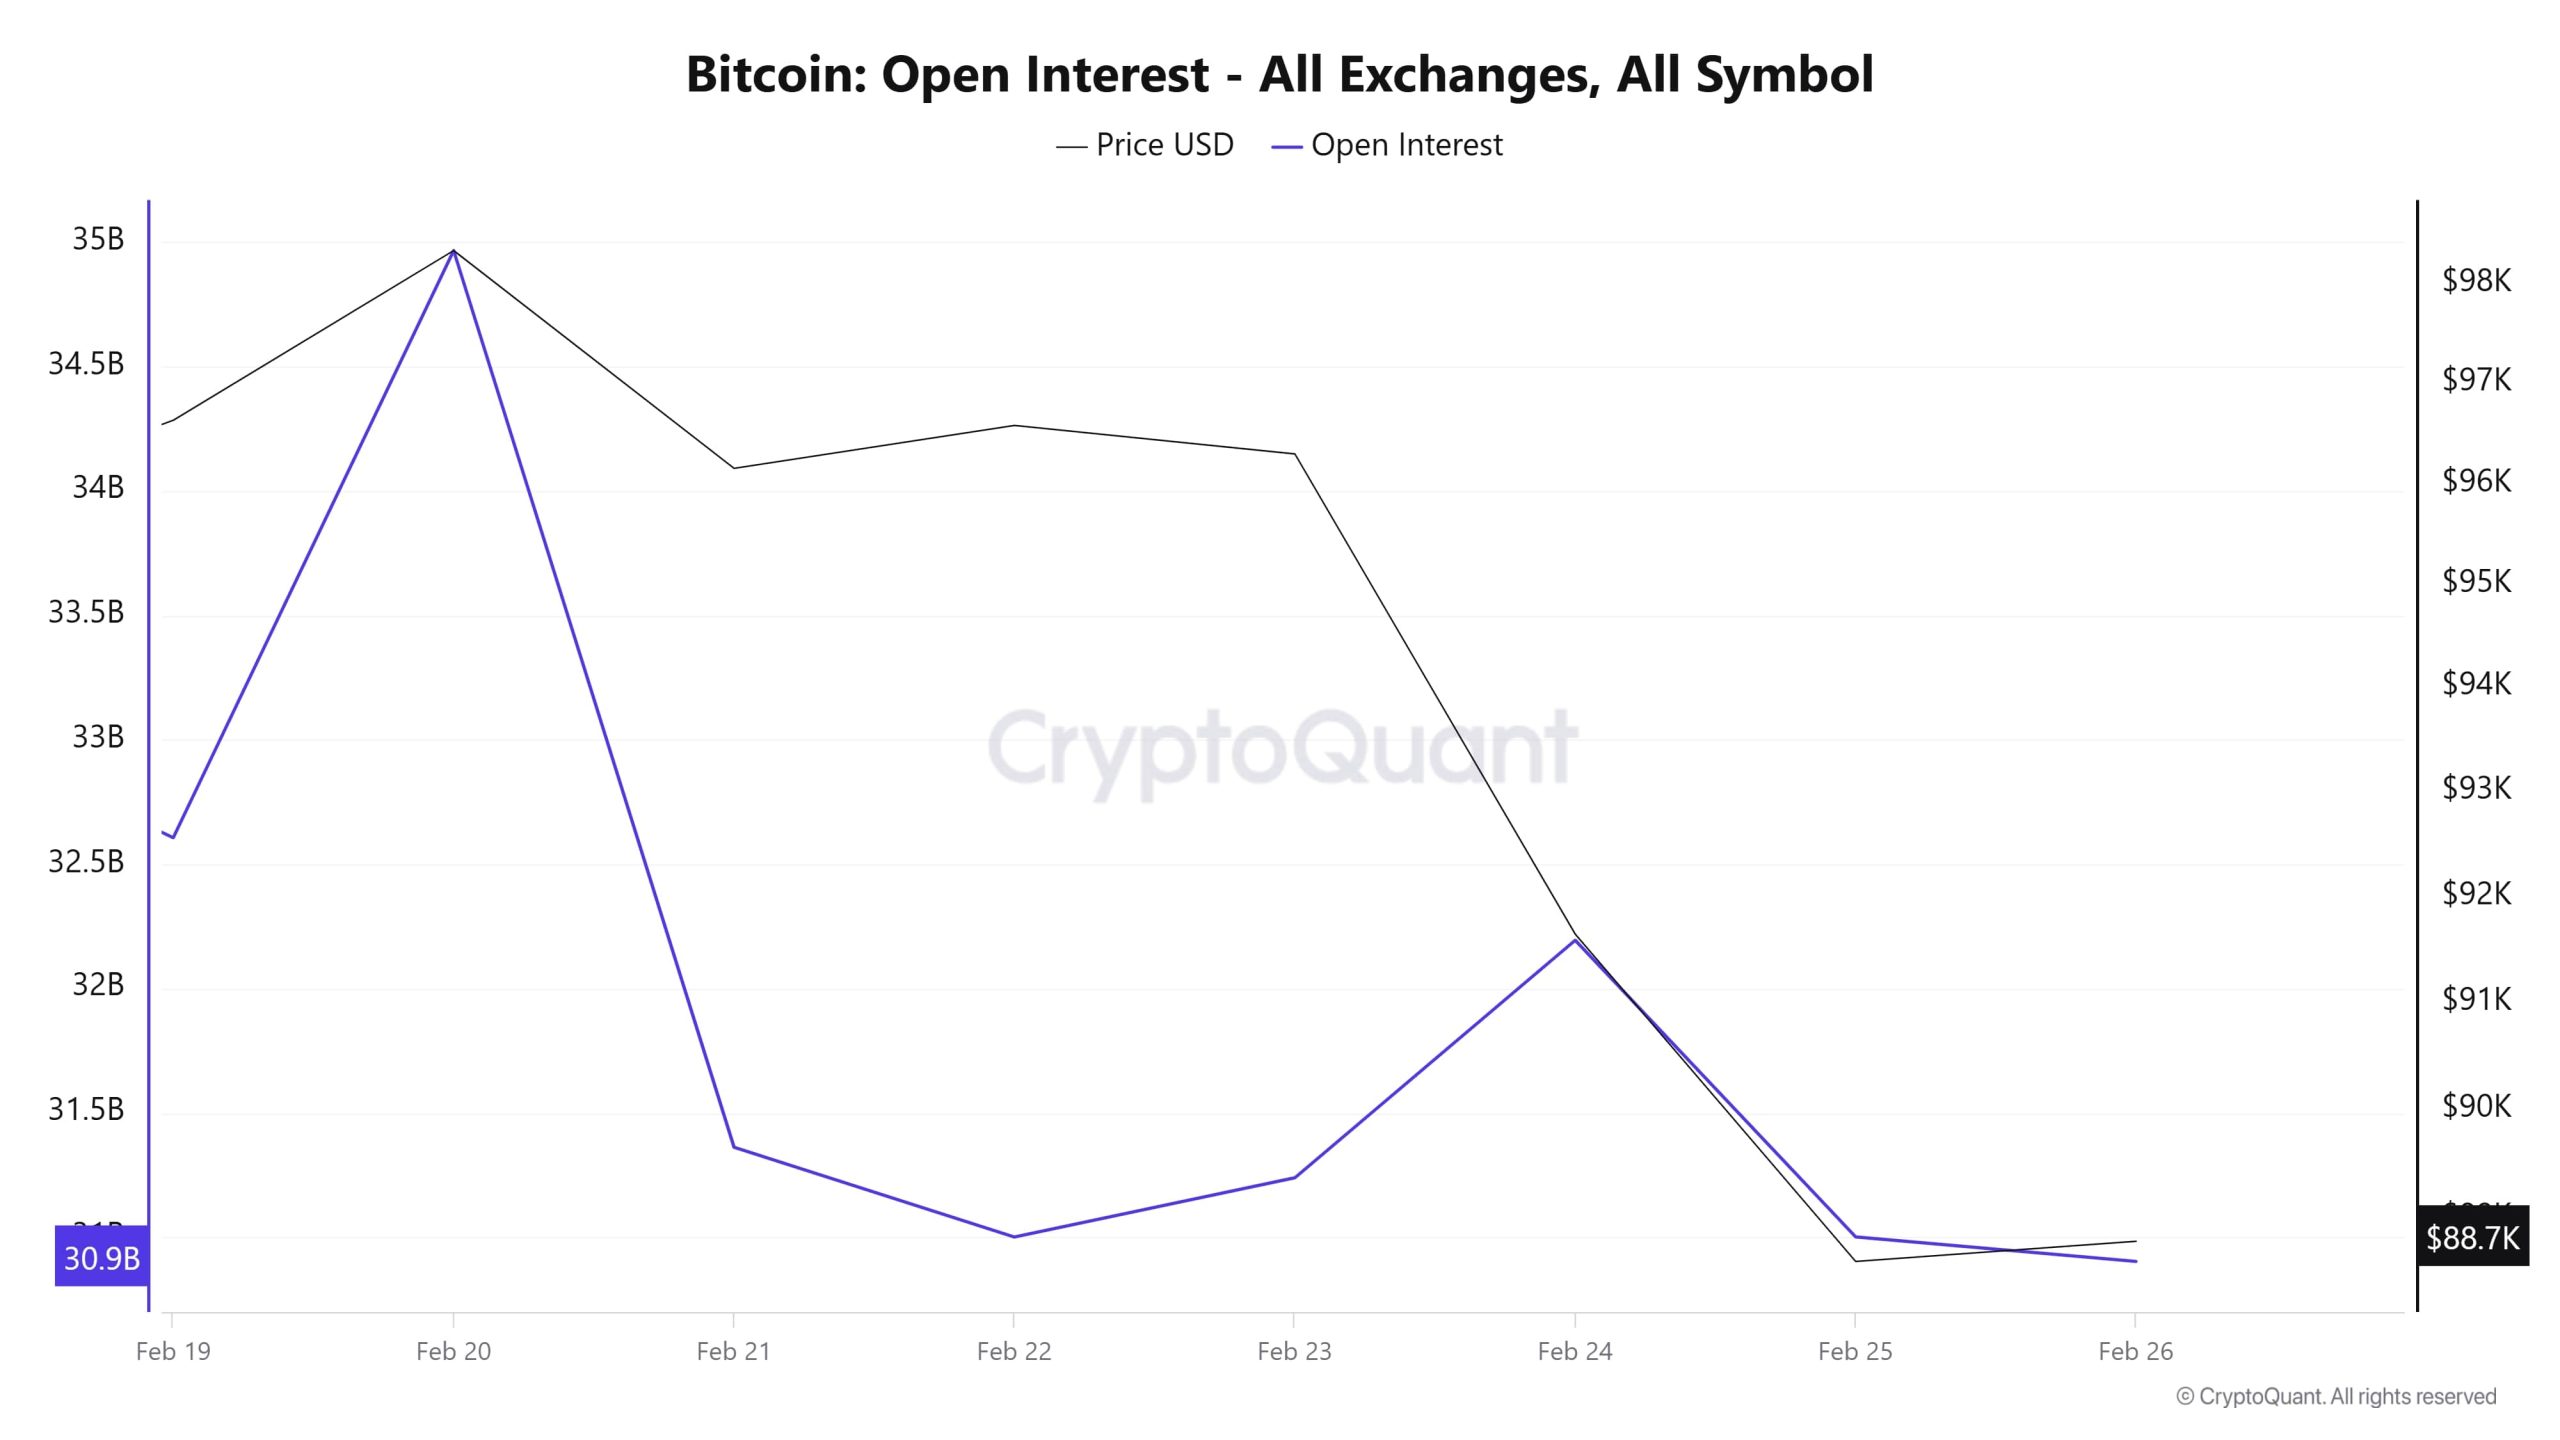
Bitcoin open interest started at around $32.7 billion on February 19. On February 20, it rose sharply, reaching $35 billion. This rise indicates that interest in futures contracts is growing in the market, and investors are increasing their positions. However, as of February 21, open interest began a rapid decline. Lasting until February 22nd, this decline resulted in a drop in open interest to $31 billion. During this period, there may have been closures of long or short positions or forced liquidations. Open interest, which remained relatively flat on February 22-23, increased again on February 24. The rebound on February 24 was short-lived and both price and open interest fell sharply as of February 25. As of February 26, open interest hit its lowest levels to 88.7K. This sharp decline may indicate high volatility in the market and risk aversion among investors.
Funding Rate
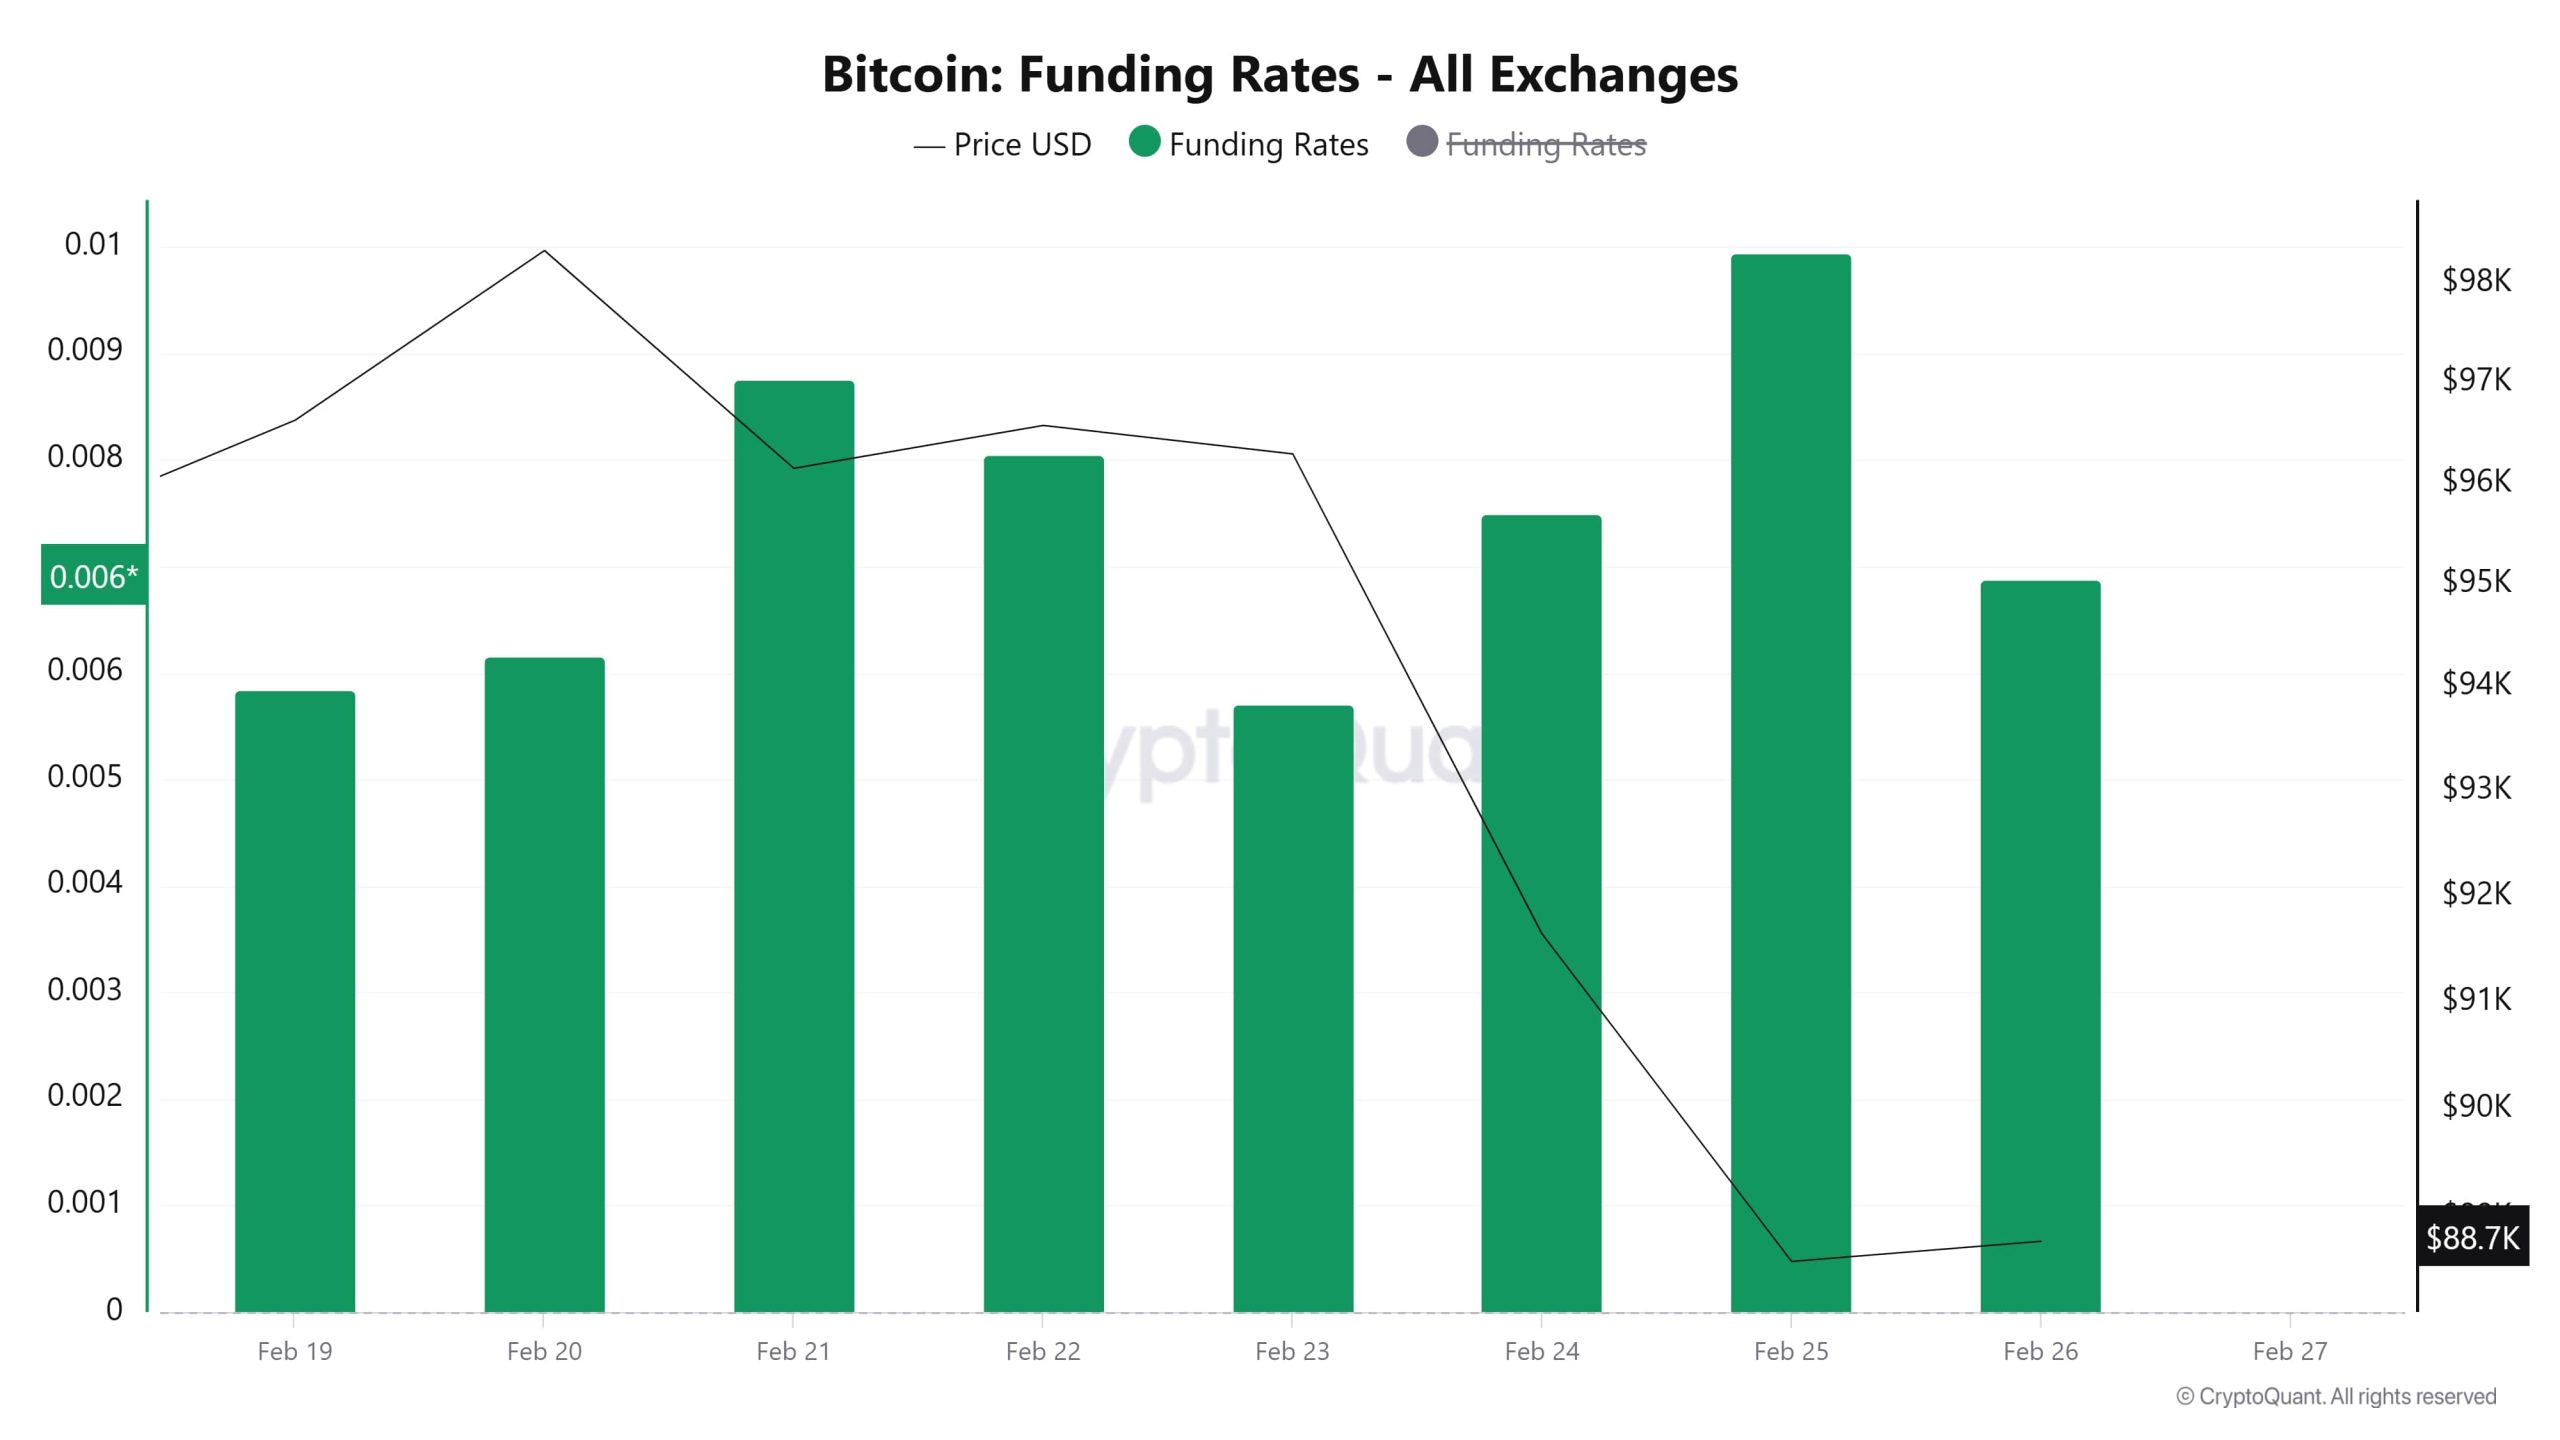
The Bitcoin funding rate started at 0.006 on February 19. On February 20 and 21, it rose gradually, and the Bitcoin price also moved upwards. On February 21, funding rates reached one of their highest levels, crossing the 0.009 level.
On February 22, funding rates declined slightly but remained in positive territory overall. On February 23, there was a significant decline, but it rebounded on February 24 and moved upwards. On February 25, funding rates peaked again and rose along with the price. As of February 26, funding rates also declined as the price fell sharply but still remained in positive territory. With the price decline, long trades seem to maintain their weight, strengthening the liquidation areas in the downside.
Long&Short Liquidations
Bybit hacking and the decline in global markets also affected BTC, causing sharp pullbacks. During this pullback, high levels of volatility caused a high amount of liquidations from both long and short positions. As of last week, a total of 873 million dollars of long positions and 550 million dollars of short positions were liquidated.
| Date | Long Amount (Million $) | Short Amount (Million $) |
|---|---|---|
| January 19 | 8.06 | 93.10 |
| January 20 | 4.71 | 274.00 |
| January 21 | 99.25 | 82.24 |
| January 22 | 1.26 | 5.87 |
| January 23 | 9.45 | 4.76 |
| January 24 | 221.04 | 11.91 |
Supply Distribution
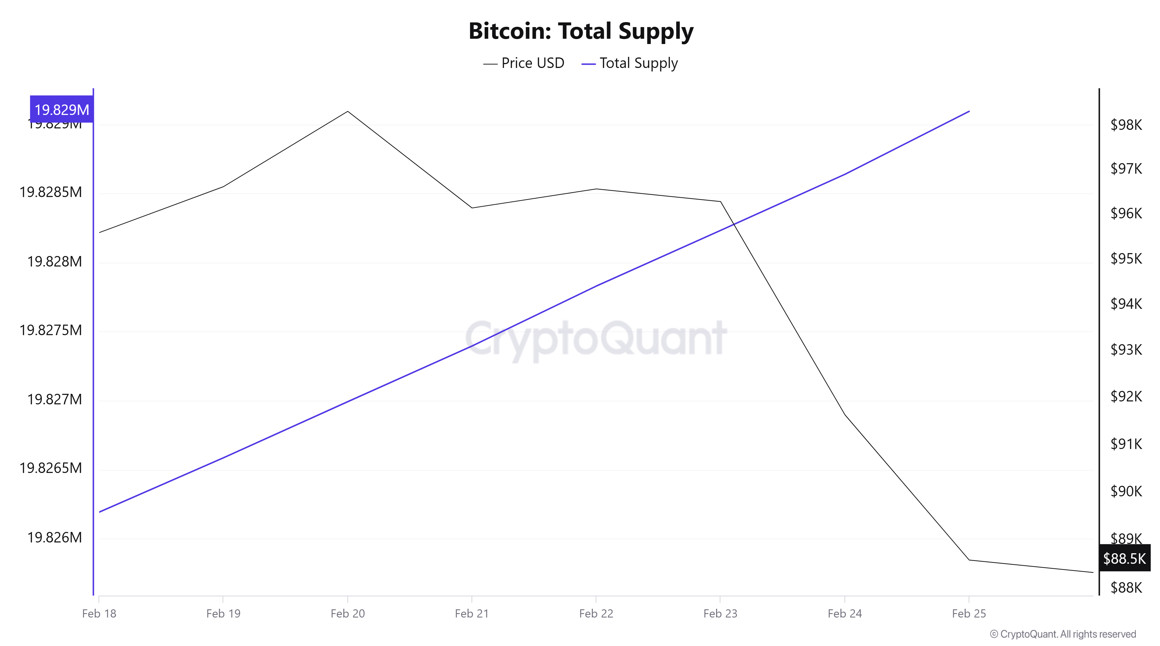
Total Supply: It reached 19,826,192 units, up about 0.015% from last week.
New Supply: The amount of BTC produced this week was 2,904.
Velocity: Velocity, which was 14.02 last week, was 14.0 as of February 25.
| Wallet Category | 18.02.2025 | 25.02.2025 | Change (%) |
|---|---|---|---|
| < 1 BTC | 8.5264% | 8.542% | 0.18% |
| 1 – 10 BTC | 11.685% | 11.709% | 0.21% |
| 10 – 100 BTC | 24.83% | 24.859% | 0.12% |
| 100 – 1k BTC | 28.257% | 28.294% | 0.13% |
| 1k – 10k BTC | 18.172% | 18.097% | -0.41% |
| 10k+ BTC | 8.524% | 8.494% | -0.35% |
When we look at the supply distribution, there was a limited increase of 0.18% in the “< 1 BTC” category, while a slight increase of 0.21% was observed in the “1 – 10 BTC” category. There was a small increase of 0.12% in the “10 – 100 BTC” category, indicating that investors in this range remained relatively stable.
There was a slight increase of 0.13% in the “100 – 1K BTC” category, indicating that mid-sized investors remained relatively active in the market. In contrast, the “1K – 10K BTC” category saw a decrease of 0.41%, while the “10K+ BTC” category saw a decrease of 0.35%. This suggests that large investors are gradually reducing their holdings, and the supply is shifting towards smaller-scale wallets.
Exchange Reserve
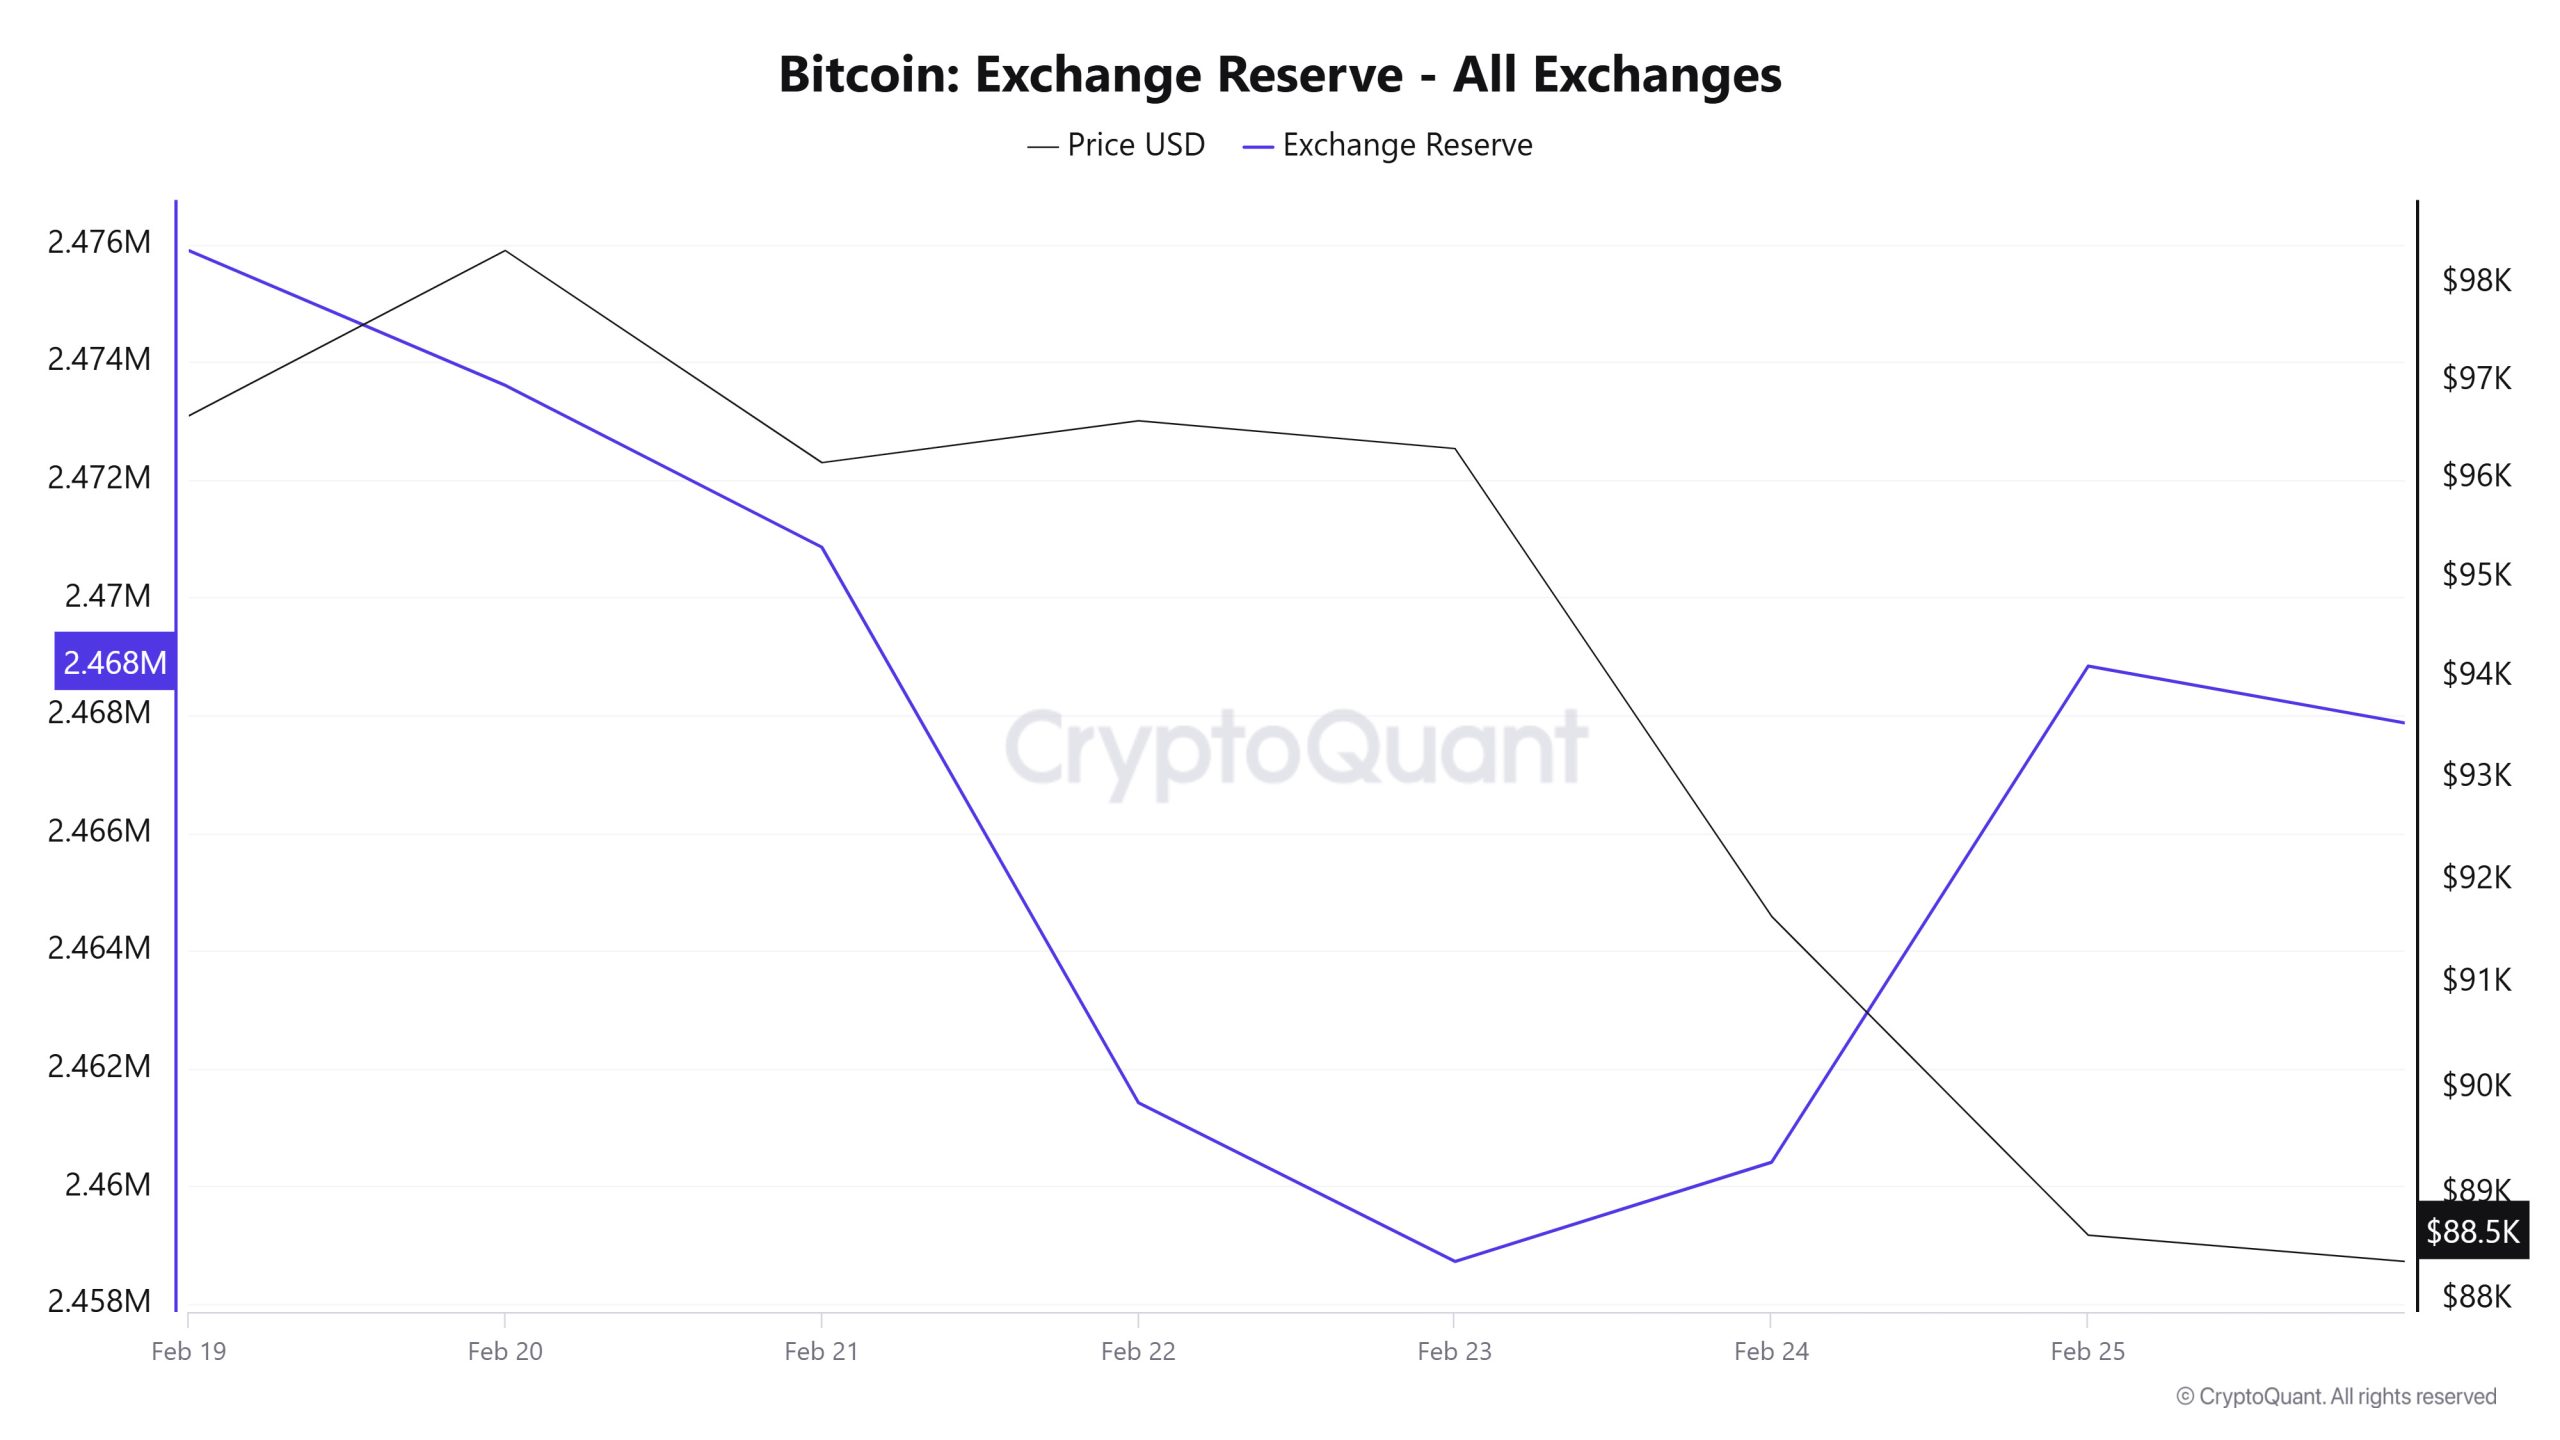
Between February 19-25, 2025, Bitcoin reserves on exchanges decreased from 2,475,892 BTC to 2,468,835 BTC. In total, there was a net outflow of 7,057 BTC during this period, and exchanges’ Bitcoin reserves decreased by 0.28%. The Bitcoin price fell by approximately 8.3% during this period. Bitcoin, which closed at $96,633 on February 19, 2025, closed at $88,598 on February 25, 2025
| Date | 19-Feb | 20-Feb | 21-Feb | 22-Feb | 23-Feb | 24-Feb | 25-Feb |
|---|---|---|---|---|---|---|---|
| Exchange Inflow | 25,092 | 24,037 | 41,432 | 23,649 | 12,049 | 30,283 | 84,986 |
| Exchange Outflow | 23,881 | 26,327 | 44,182 | 33,082 | 14,745 | 28,598 | 76,560 |
| Exchange Netflow | 1,211 | -2,290 | -2,750 | -9,433 | -2,696 | 1,685 | 8,427 |
| Exchange Reserve | 2,475,892 | 2,473,602 | 2,470,852 | 2,461,419 | 2,458,723 | 2,460,408 | 2,468,835 |
| BTC Price | 96,633 | 98,341 | 96,155 | 96,582 | 96,299 | 91,642 | 88,598 |
Fees and Revenues
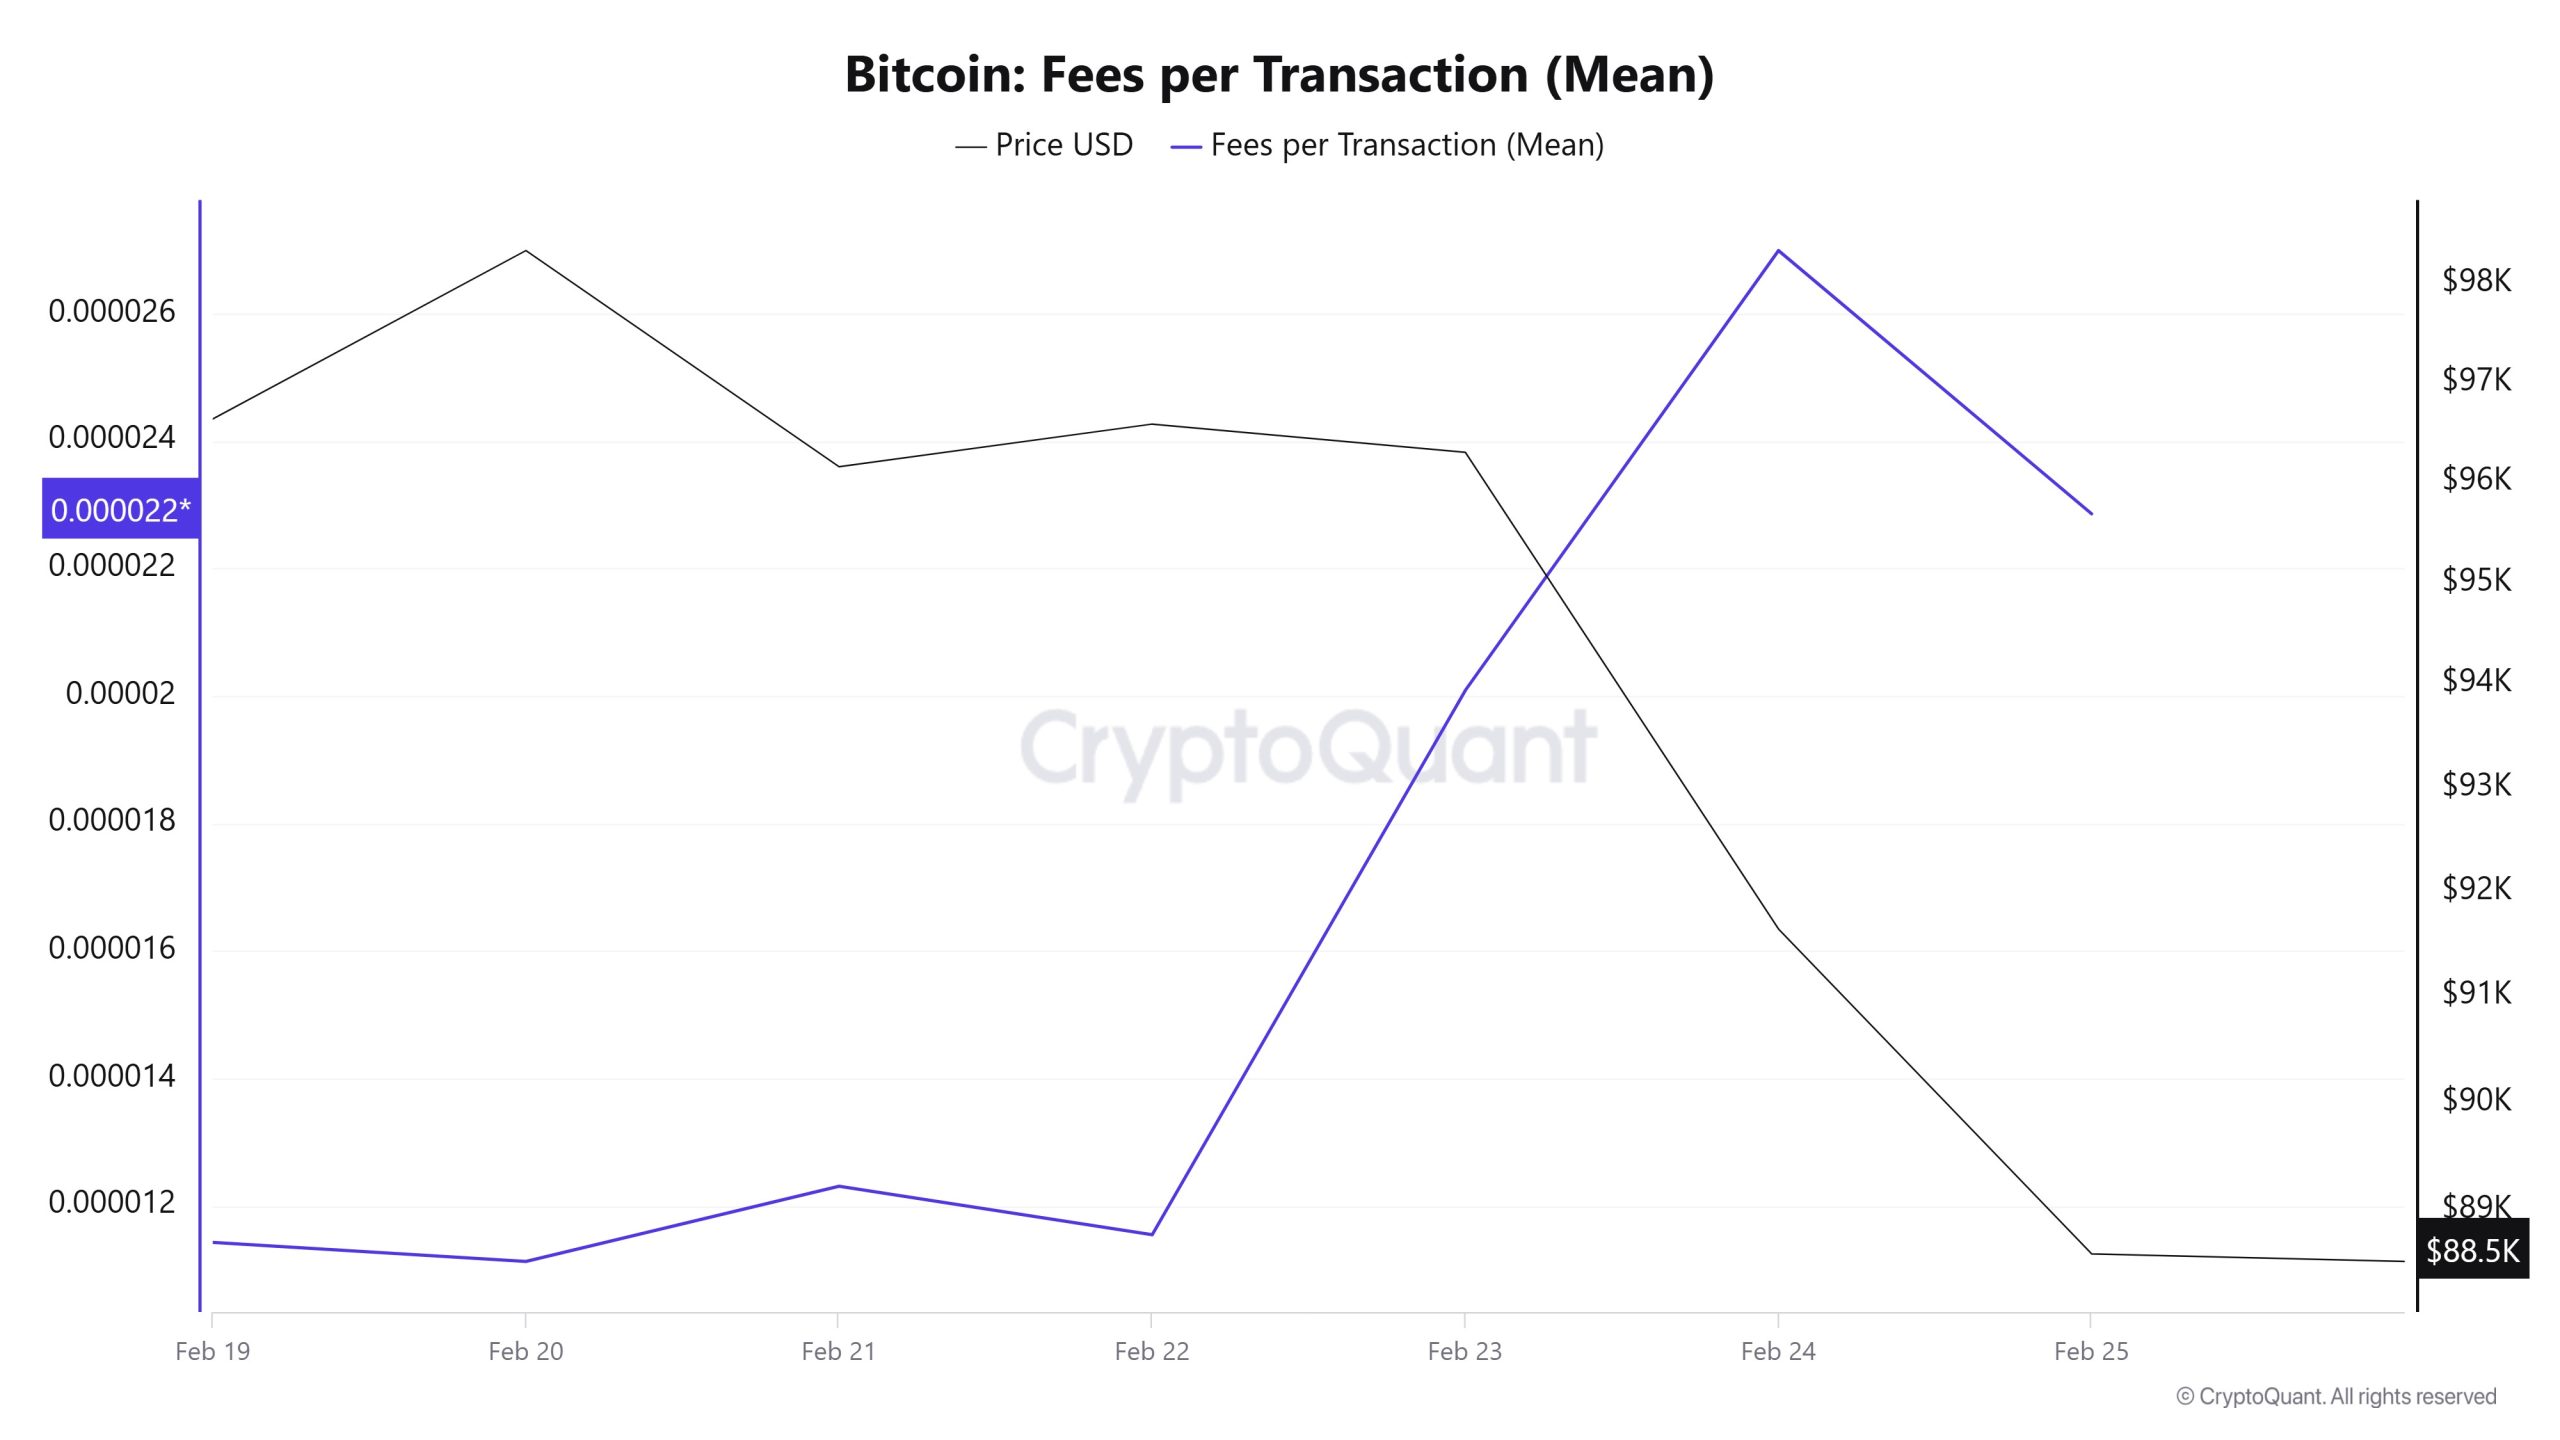
When Bitcoin Fees per Transaction (Mean) data between February 19-25 is analysed, it is seen that this value was at the level of 0.00001143 on February 19, the first day of the week. Until February 22, the value, which followed a horizontal course in correlation with the Bitcoin price, showed an upward trend due to the sharp retracement in the Bitcoin price after February 22. Fees per Transaction (Mean), which showed an upward trend in this regard, reached 0.on February 24, recording the highest value of the week.
However, on February 25, the last day of the weekly period, there was some retracement, and the value closed at 0.00002286.
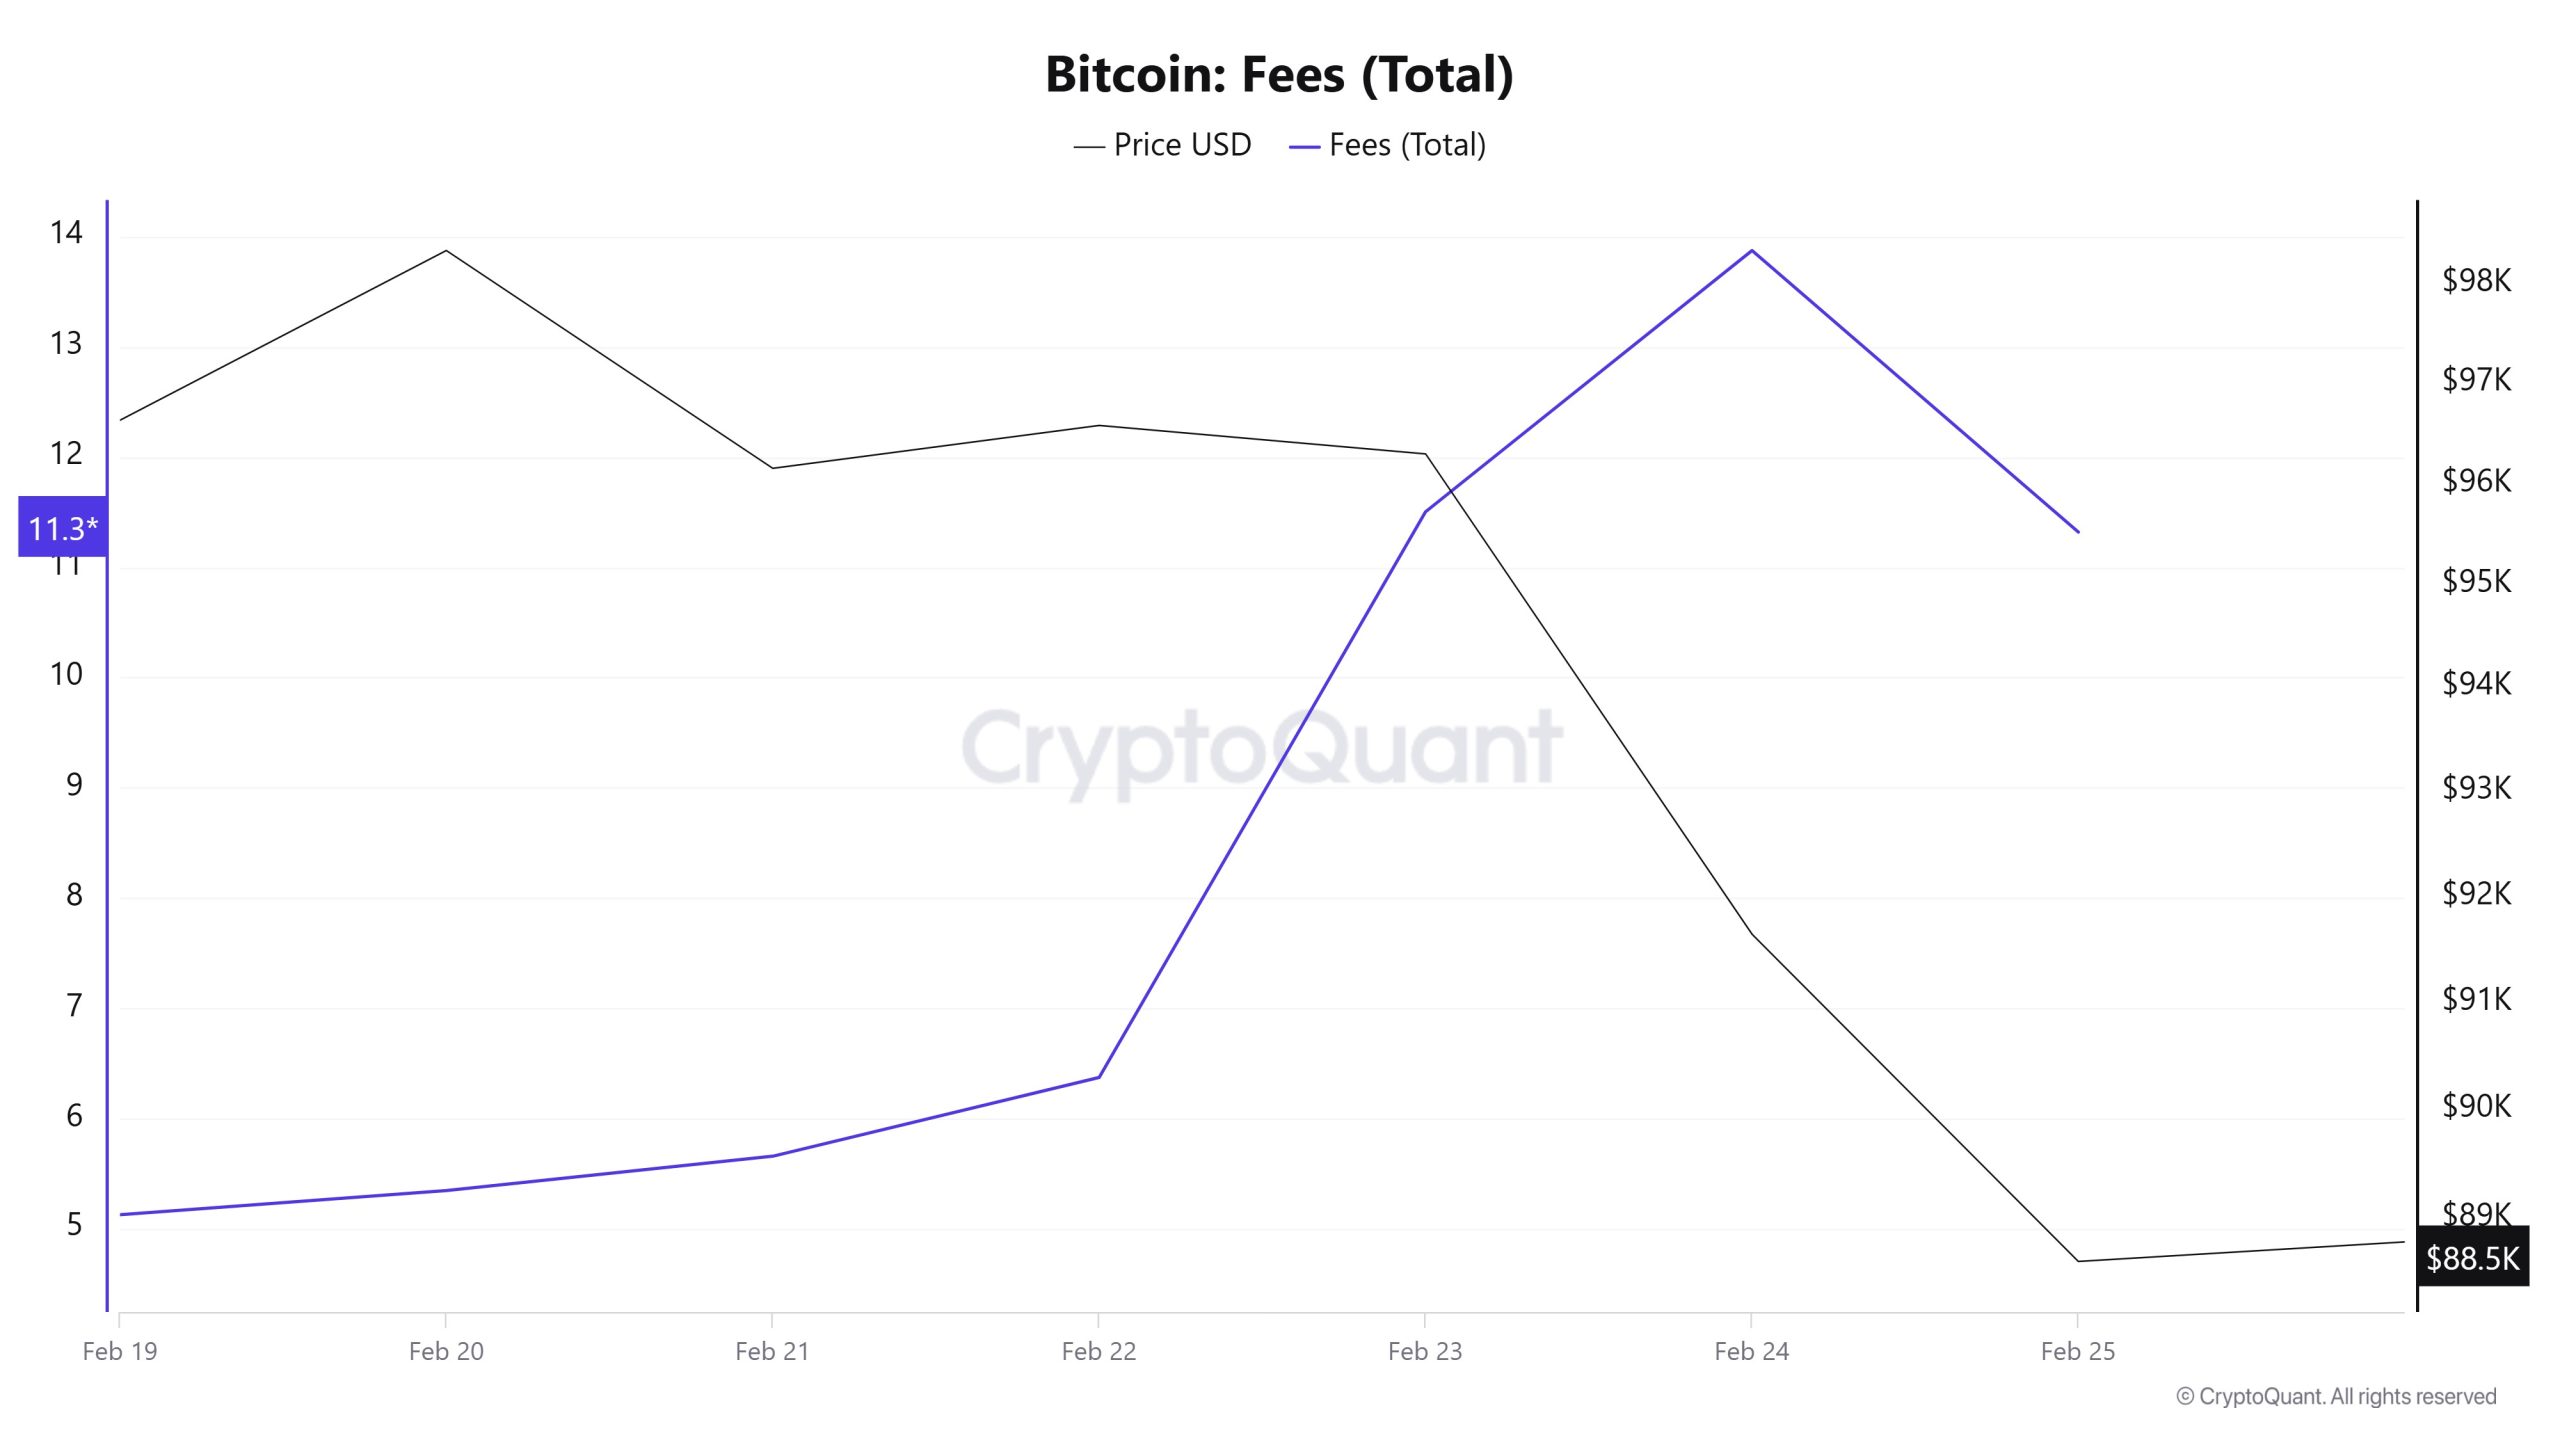 Similarly, when Bitcoin Fees (Total) data for February 19-25 were analysed, it was observed that this value was at 5.12711265 on February 19, the first day of the week. Until February 22, the value, which followed a horizontal course in correlation with the Bitcoin price, showed an upward trend after February 22 due to the sharp retracement in the Bitcoin price. Fees (Total), which showed an upward trend in this regard, reached 13.87325245 on February 24, recording the highest value of the week.
However, on February 25, the last day of the weekly period, there was some retracement, and the value closed at 11.
Miner Flows
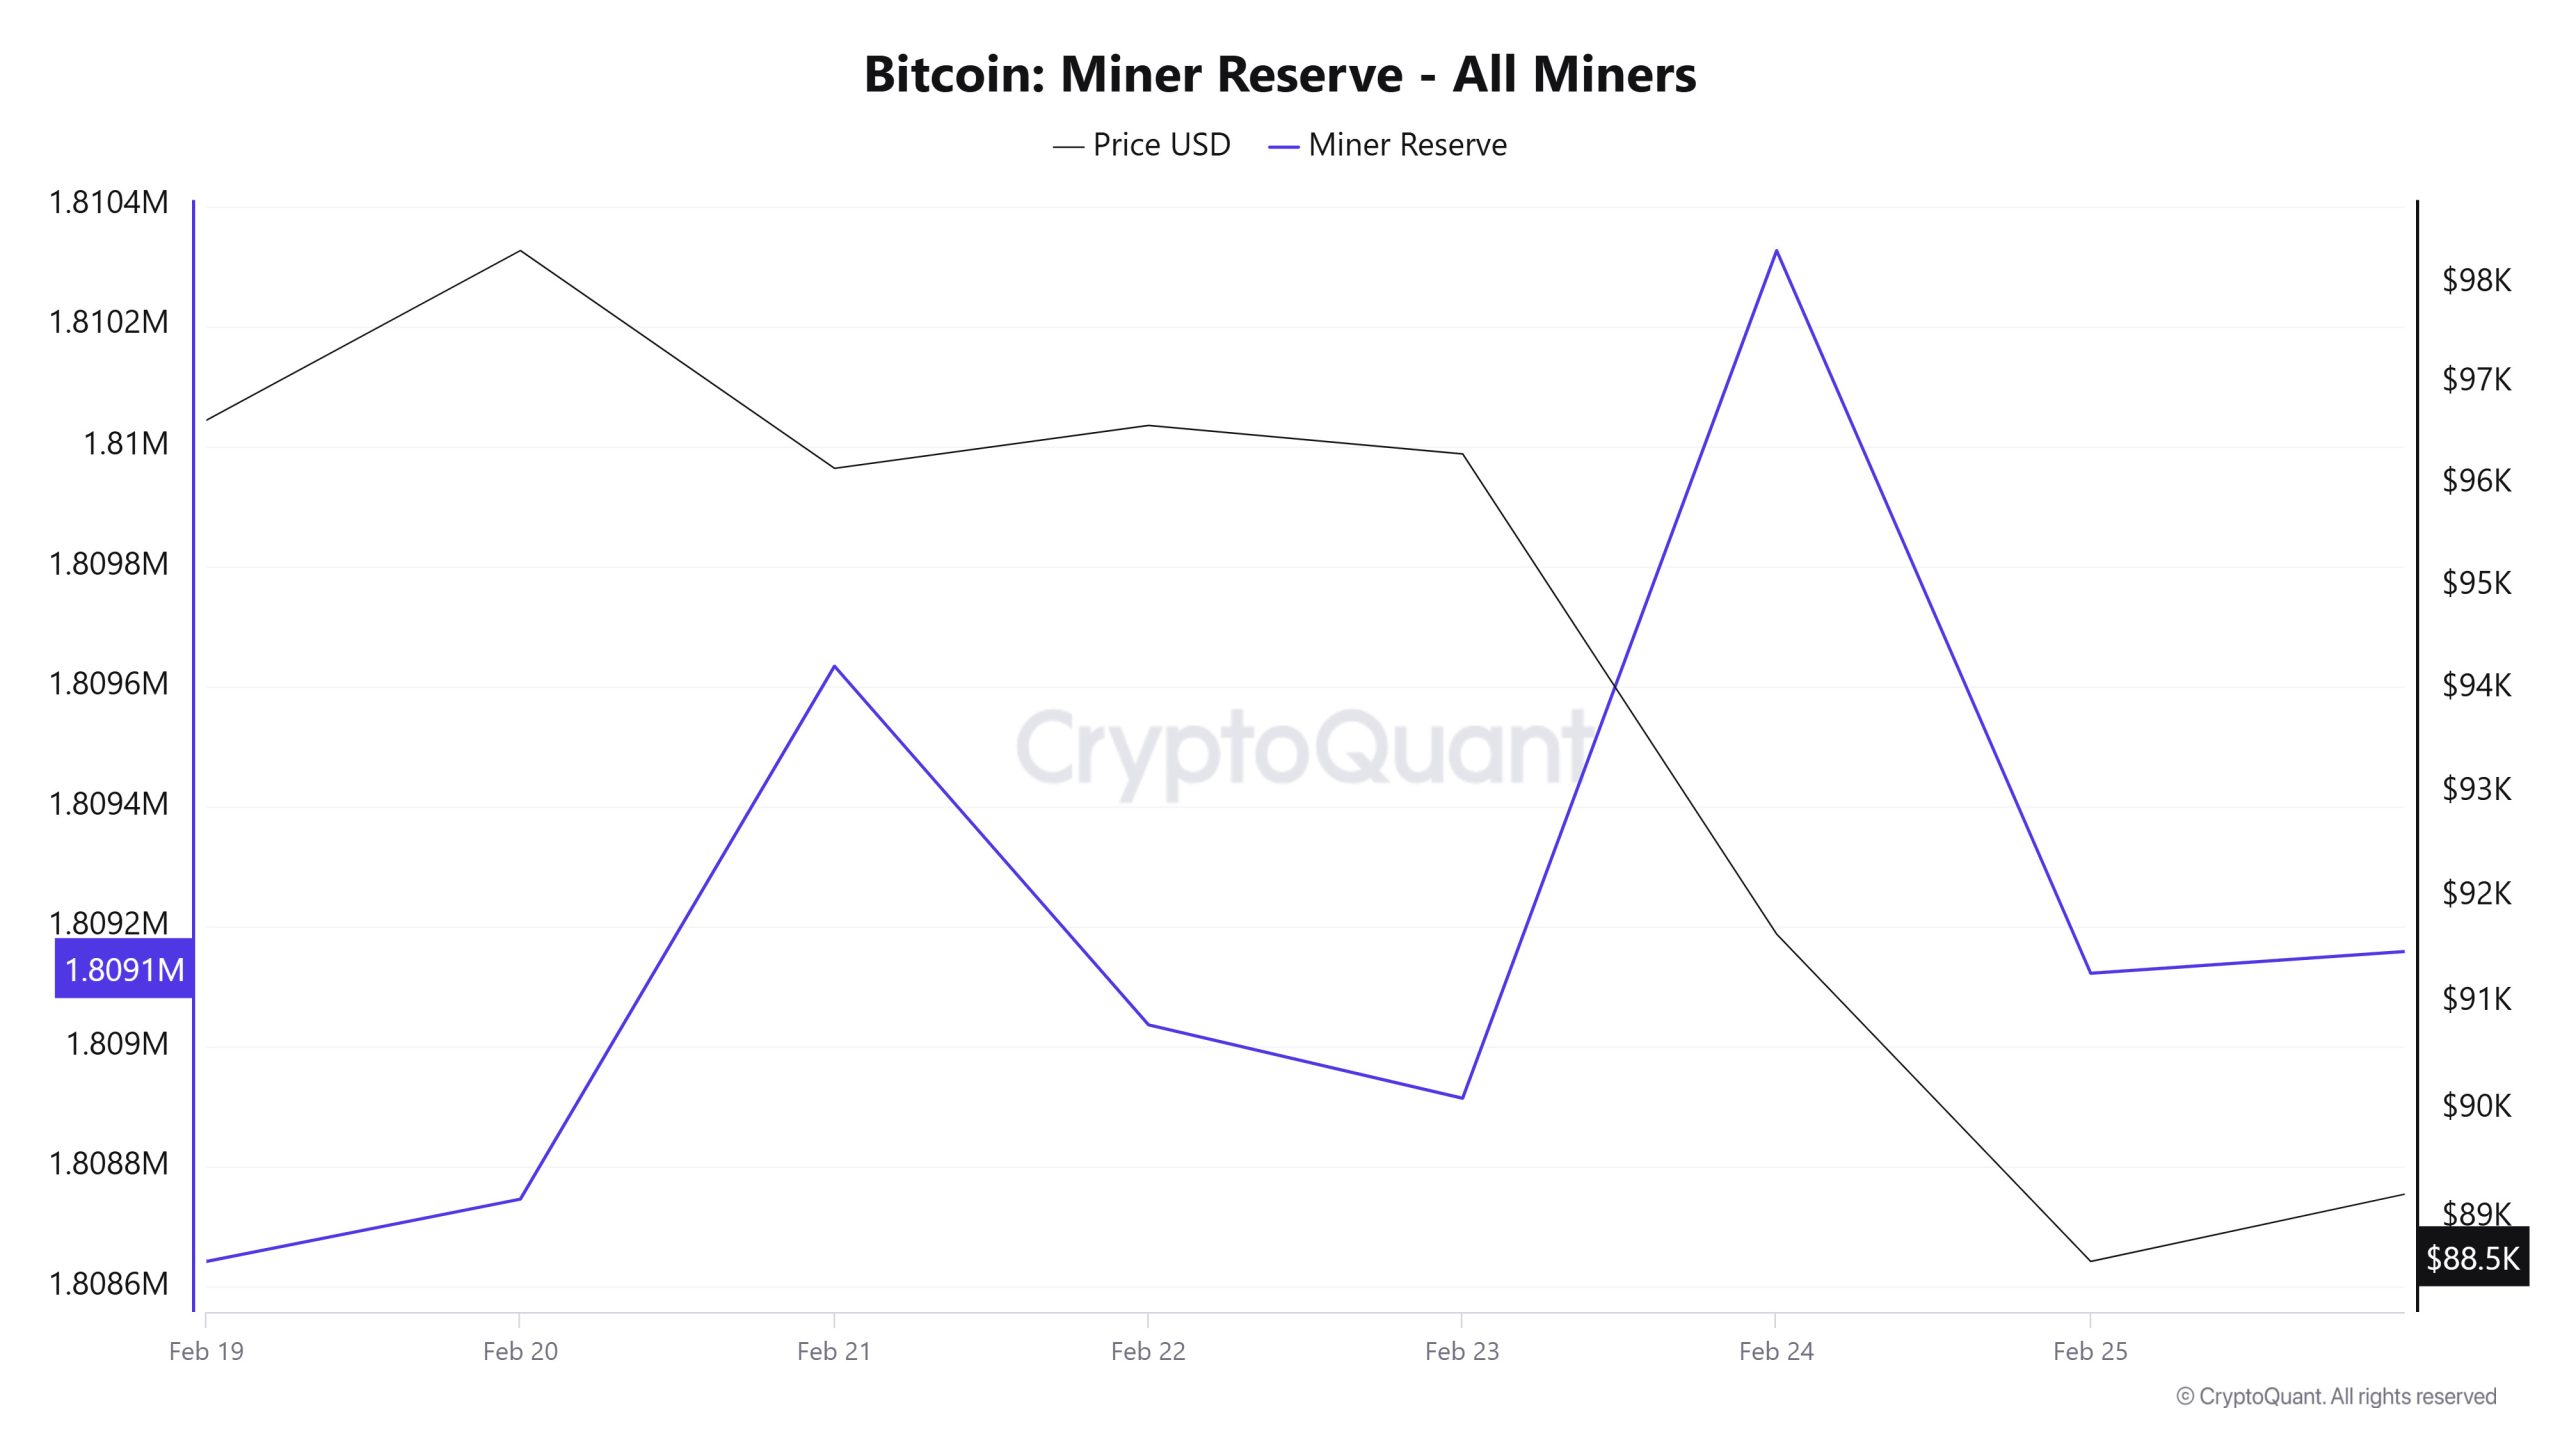
As can be seen in the Miner Reserve table, the number of Bitcoins in miners’ wallets decreased this week. Although Miner Reserve and Bitcoin price seemed to be negatively correlated throughout this week, it is seen that Miner Reserve and Bitcoin price turned into a positive correlation towards the end of the week.
Miner Inflow, Outflow and NetFlow
Between February 19 and February 25, 63,789 Bitcoins exited miners’ wallets, and 63,636 Bitcoins entered miners’ wallets between the same dates. The Miner NetFlow for this week was -153 Bitcoin. Meanwhile, the Bitcoin price was $96,633 on February 19 and $88,598 on February 25.
For the week, the net flow (Miner NetFlow) was negative as Bitcoin inflow into miner wallets (Miner Inflow) was less than Bitcoin outflow from miner wallets (Miner Outflow).
Miner Data
| Date | February 19 | February 20 | February 21 | February 22 | February 23 | February 24 | February 25 |
|---|---|---|---|---|---|---|---|
| Miner Inflow | 5,700.36 | 5,467.19 | 11,242.40 | 7,858.49 | 4,613.59 | 8,283.34 | 20,471.42 |
| Miner Outflow | 6,332.69 | 5,363.43 | 10,355.24 | 8,455.66 | 4,735.59 | 6,872.31 | 21,674.57 |
| Miner Netflow | -632.33 | 103.76 | 887.16 | -597.17 | -121.99 | 1,411.03 | -1,203.14 |
Transaction
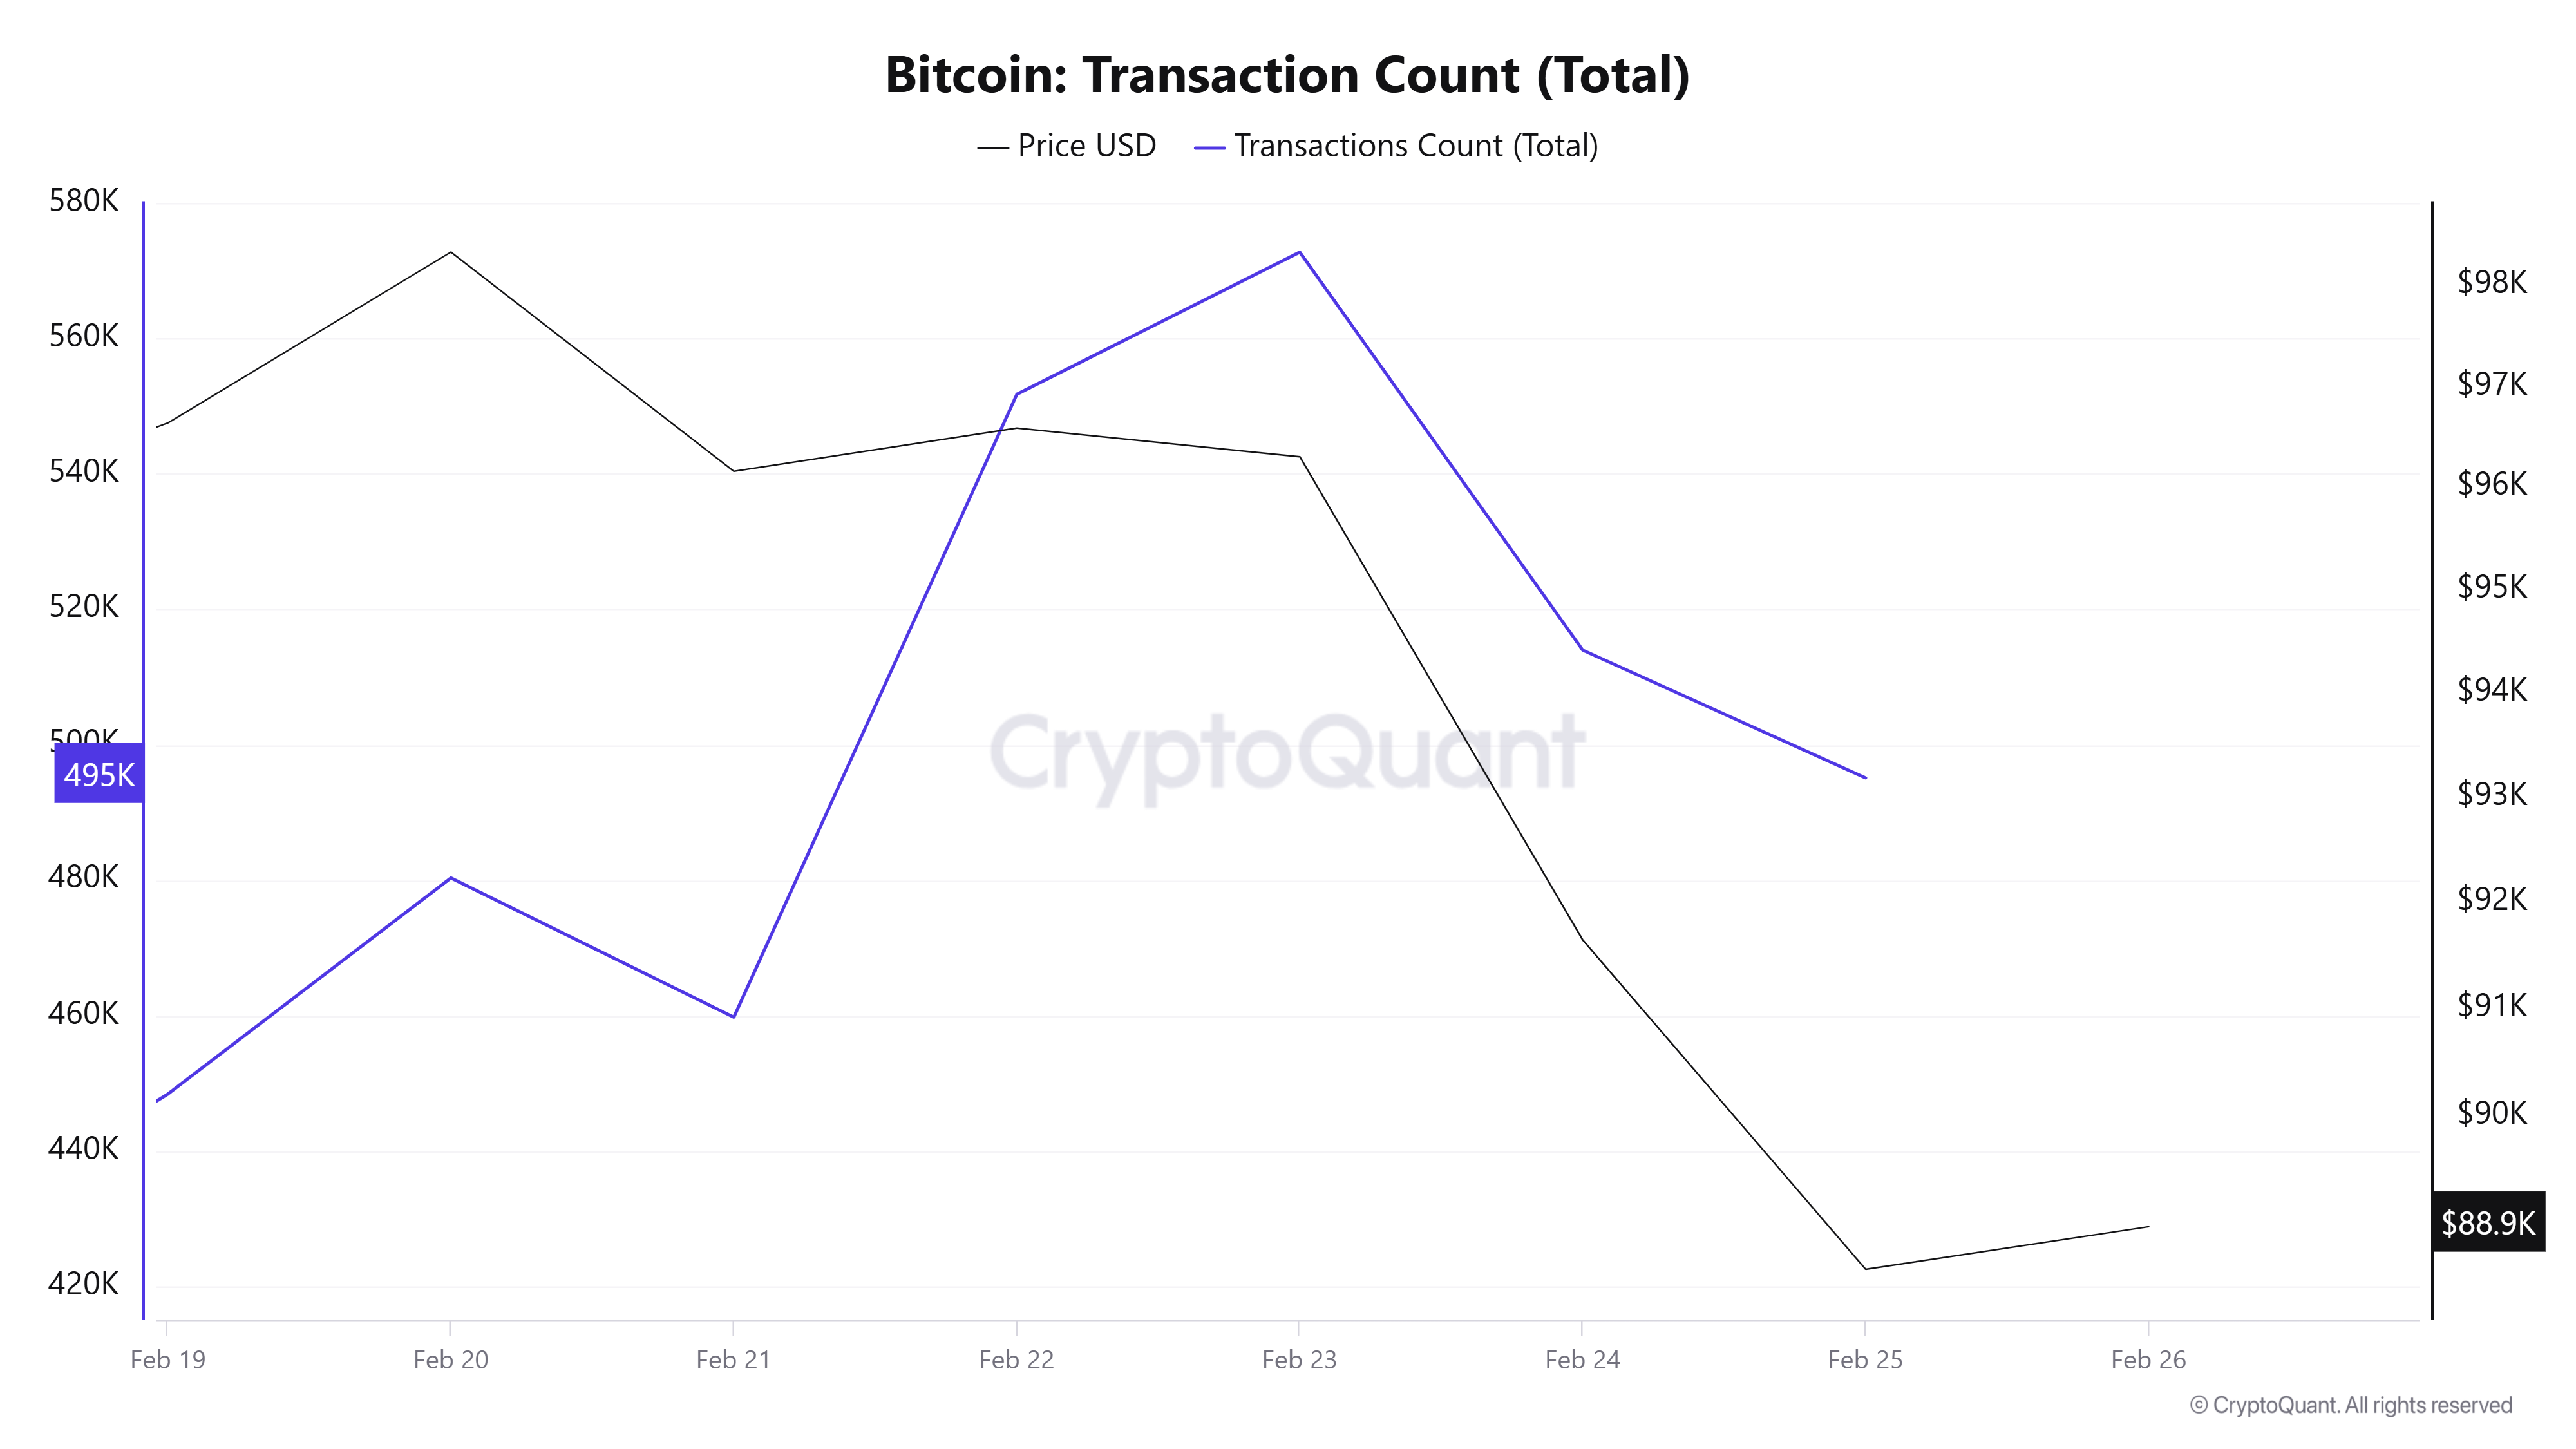
While there were 2,474,612 transactions last week, this number increased by 42.3% to 3,521,992 between February 19-25. The highest number of transactions was 572,685 on February 23, while the lowest number of transactions was 448,443 on February 19. The fact that the number of transactions on the network has increased compared to last week, but the price has decreased, strengthens the possibility that the transfers were carried out to be sold on exchanges.
(Decline)
Tokens Transferred
While the number of Bitcoins transferred between February 12-18 was 3,932,866, between February 19-25, this number increased to 5,487,803, an increase of 39.5%. February 25 recorded the highest number of Bitcoins transferred in a single day in 2025 with 1,331,914 Bitcoins. This record may be linked to the $1.01 billion outflow in ETFs on February 25. On the other hand, February 23rd was the day with the lowest transfer amount of the week with only 514,110 Bitcoin transfers.
This week’s high number of transactions and transfers compared to the previous week, but the negative movement of the price indicates that the transfers are sales intensive. Especially this week, we may be seeing the effect of the outflows in spot Bitcoin ETFs on onchaine.
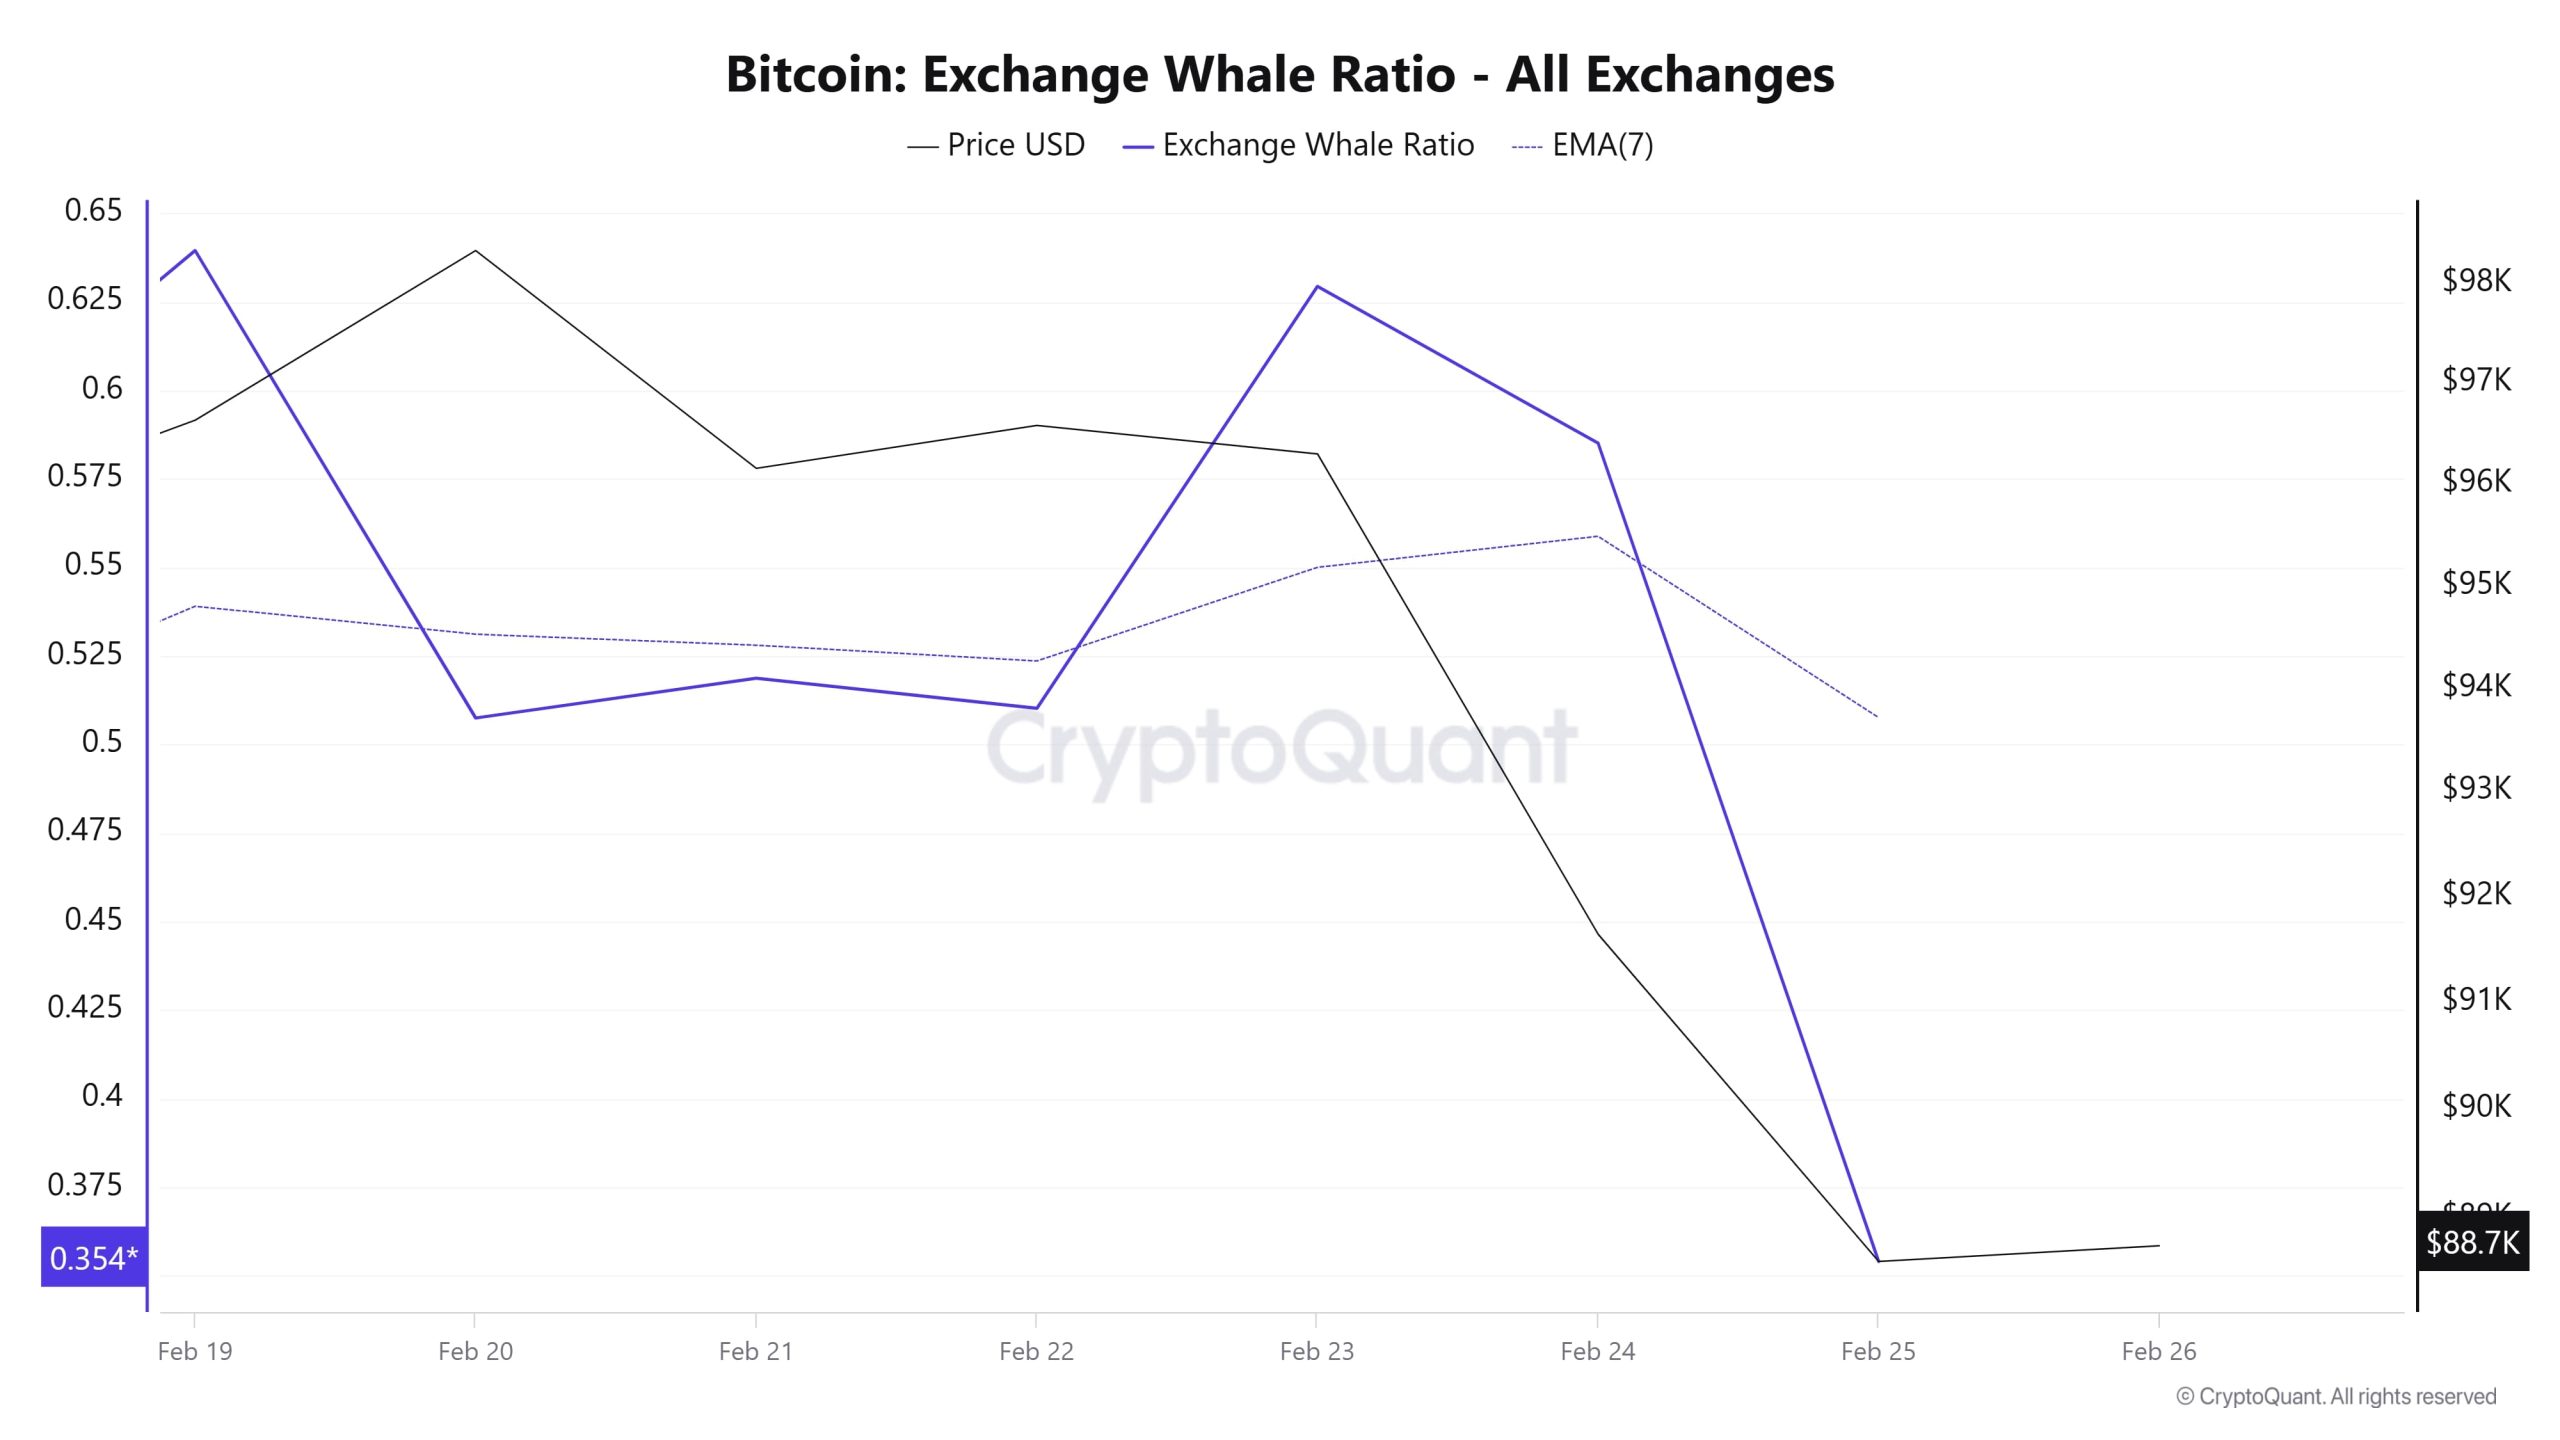
Whale Activities
According to data from CryptoQuant, whale accumulation addresses received over 26,430 BTC, surpassing the 20,000 BTC warning threshold. This significant inflow suggests that high-net-worth investors are taking advantage of current price levels to accumulate Bitcoin. Such activity is often interpreted as a sign of confidence in Bitcoin’s long-term value, as whales often buy in large quantities when they anticipate a future price increase. On the other hand, Strategy founder Michael Saylor, speaking at the CPAC conference in Washington DC, stated that the US could own 20% of the Bitcoin network, which would strengthen the country’s economy. According to Saylor, the purchase of 4-6 million BTC could potentially pay off the US national debt. Crypto Quant analyst Axel Adler shared an important market analysis on X, revealing that the slow accumulation of small addresses reflects a cautious stance of retail investors. Historically, retail investors tend to increase their holdings during bull markets, expecting further price increases. However, this trend is currently absent, suggesting that small investors are not confident in Bitcoin’s short-term price action
Cryptoquant Data: According to notable data in the cryptocurrency market over the last 7 days, whale activity on centralized exchanges was high in the early days. When we look at the Exchange Whale Ratio metric, it showed that whales used central exchanges a lot at the beginning of the 7-day period and the value was measured as 0.64. This metric reached 0.51 in the middle of the process, indicating that whales started to use the central exchange less than at the beginning of the process. At the time of writing, the value is 0.354, indicating that whales are slowly abandoning the central exchange. When this ratio is above 0.350, it usually means that whales use centralized exchanges frequently. At the same time, total BTC transfers increased by nearly 40% compared to last week, with 5,487,803 BTC moving. As a result, although the failure to break the 90,000-level led to a new low, Bitcoin whales signalled long-term confidence by withdrawing large amounts of BTC from exchanges.
BTC Onchain Overall
| Metric | Ascension 📈 | Decline 📉 | Neutral ➖ |
|---|---|---|---|
| Active Addresses | ✓ | ||
| Breakdowns | ✓ | ||
| Derivatives | ✓ | ||
| Supply Distribution | ✓ | ||
| Exchange Reserve | ✓ | ||
| Fees and Revenues | ✓ | ||
| Miner Flows | ✓ | ||
| Transaction | ✓ | ||
| Whale Activities | ✓ |
LEGAL NOTICE
The investment information, comments and recommendations contained in this document do not constitute investment advisory services. Investment advisory services are provided by authorized institutions on a personal basis, taking into account the risk and return preferences of individuals. The comments and recommendations contained in this document are of a general type. These recommendations may not be suitable for your financial situation and risk and return preferences. Therefore, making an investment decision based solely on the information contained in this document may not result in results that are in line with your expectations.
NOTE: All data used in Bitcoin onchain analysis is based on Cryptoqaunt.

