
BTC/USDT
As US-China economic relations undergo a period of reshaping, US Treasury Secretary Benson’s plan to meet with Chinese officials signals a new phase in trade diplomacy. In financial markets, both institutional and individual investors continue to show interest in Bitcoin. A Bitcoin whale that had been inactive for six years recently transferred approximately $649 million, while Genius Group increased its reserves by 23%. KULR Technology, meanwhile, has secured a $20 million credit line agreement with Coinbase to accelerate its Bitcoin accumulation.
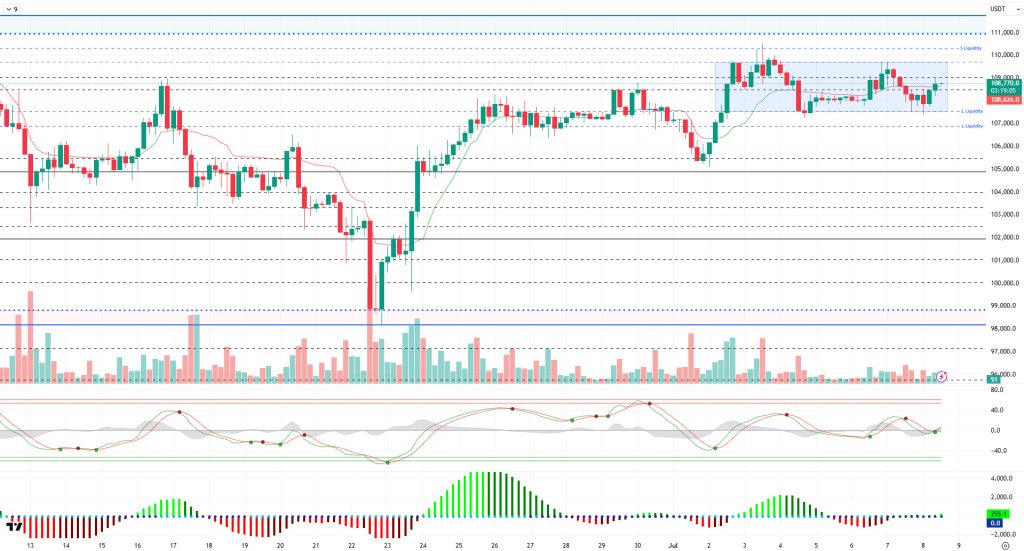
Looking at the technical picture, BTC continues to maintain its strong stance while continuing to move within the horizontal band range it formed near the ATH level. BTC, which felt a slight downward selling pressure yesterday, fell to the 107,500 level. Then, the price rebounded and settled above 108,000 once again.
Technical indicators show that the Wave Trend (WT) is reversing its direction upward in the middle band of the channel with signs of weakening, while the histogram of the Squeeze Momentum (SM) indicator has moved into the positive zone, beginning to provide support. The Kaufman moving average has crossed below the price level of 108,600, confirming the upward trend.
When examining short-term liquidity data, the liquidation of buy-side transactions above the 107,500-level occurred along with yesterday’s decline. The next buy level is concentrated at the 107,000 level. The sell level continues to accumulate at the 110,000 level.
In conclusion, while fundamental developments continue to act as catalysts for pricing, a new catalyst may be needed to gain momentum for an uptrend after this stage. Technically, the trend remains supportive of upward movements, and liquidity data may partially support this scenario. In the event of continued upward movement, we will monitor closes above the 110,000 level as a reference point for an all-time high (ATH). In the event of potential selling pressure, the 107,500 level will be monitored as the nearest liquidity zone.
Supports 108,500 – 107,500 – 106,800
Resistances 109,000 – 110,000 – 111,000
ETH/USDT
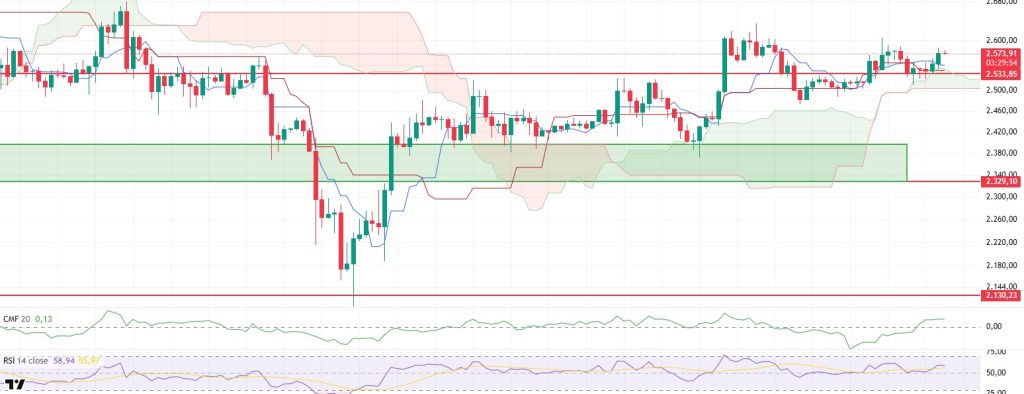
The ETH price continued its upward movement, rising to $2,570, thanks to improvements in technical indicators and strong support from the upper band of the kumo cloud. This movement, combined with increased buying appetite among market participants, indicates that short-term momentum is gaining strength. The overall technical outlook supports this upward trend. In particular, the Chaikin Money Flow (CMF) indicator’s continued presence in the positive zone and its maintenance of an upward trend signal that liquidity inflows into the market are continuing steadily. This outlook confirms that there is a strong capital inflow behind the price movement.
The Relative Strength Index (RSI) indicator is both holding above the 50 threshold level and maintaining its stability above the MA line. This technical structure is solidifying the foundation for an uptrend and supporting the price’s upward potential. Additionally, the fact that it has not yet approached the overbought zone suggests that the upward trend could continue without experiencing a short-term correction.
In the Ichimoku indicator, the price settling above the Tenkan level indicates that the positive trend is continuing in the short term. However, the price remaining above the Kumo cloud is another important factor confirming that the overall trend is upward. The slight upward slope of the Kumo cloud, rather than being horizontal, supports the view that the market structure is still controlled by buyers.
Overall, as long as there is no negative news flow that could affect market dynamics in the evening hours, it is likely that the ETH price will test the $2,600 level and even rise above it. However, on the other hand, the $2,533 level should be monitored as an important support point. A break below this level could weaken the technical structure and potentially lead to a more significant price correction. In particular, sustained movement below this region could trigger a short-term deterioration in market psychology. Therefore, both maintaining the 2,533-dollar level and ensuring that potential price movements above 2,600 dollars are supported by volume are important for preserving the current upward trend.
Suporta 2.533 - 2.329 - 2.130
Resistências 2.736 - 2.857 - 3.062
XRP/USDT
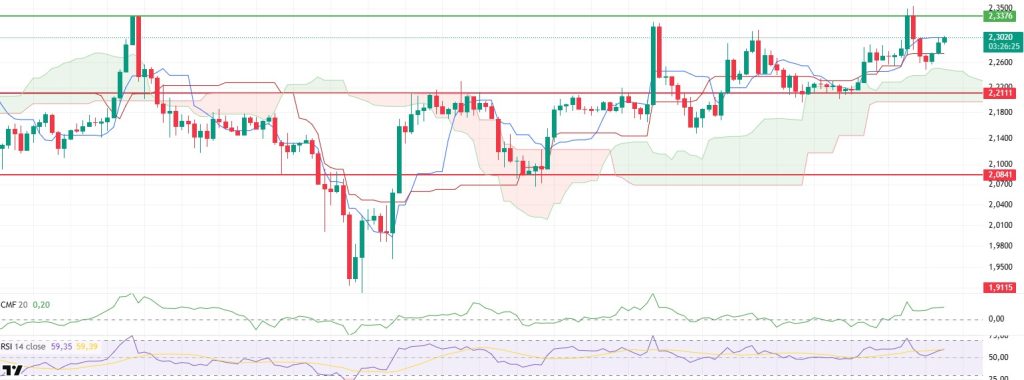
XRP rose in line with expectations during the day, reaching $2.30. This level also coincides with the tenkan line, which is the short-term trend indicator in the Ichimoku indicator. If the price manages to maintain its position above this level, the likelihood of a short-term upward trend forming could increase. This rise, particularly following the recent volatile structure, indicates that market participants are once again shifting toward buy positions.
Technical indicators support this movement. The Chaikin Money Flow (CMF) indicator remaining in positive territory and maintaining its upward trend, albeit limited, indicates that net liquidity is continuing to enter the market. In particular, this increase in liquidity serves as an early signal that prices may continue to move upward toward the evening hours.
There are also signs of recovery on the momentum side. The Relative Strength Index (RSI) indicator has rebounded from the 50 threshold level following the recent decline. The RSI’s movement toward the MA line also forms an important technical structure for a short-term positive outlook. This indicates that the buying side is regaining strength and that upward momentum could accelerate with a potential breakout. Momentum indicators also confirm that selling pressure is weakening and that short-term upward momentum is beginning to form again.
In line with this technical outlook, there is a strong possibility that the XRP price will test the short-term resistance point at $2.34 in the evening hours. If this region is broken with high volume, the upward movement could extend to higher levels. On the other hand, downside risks should not be overlooked. The 2.21 dollar level, in particular, remains a critical support level. However, a sustained move below this level could invalidate the bullish scenario and trigger sharp sell-offs that could drag the price lower.
Supports 2.2111 – 2.0841 – 1.9115
Resistances 2.3376 – 2.5900 – 2.8347
SOL/USDT
Pump. Fun’s initial public offering aimed to distribute 150 billion PUMP tokens, representing 15% of its total supply, at a price of $0.004 each. However, the public offering was halted without any explanation. Solaxy has officially launched its long-awaited Layer-2 blockchain, cross-chain bridge, and on-chain block explorer.
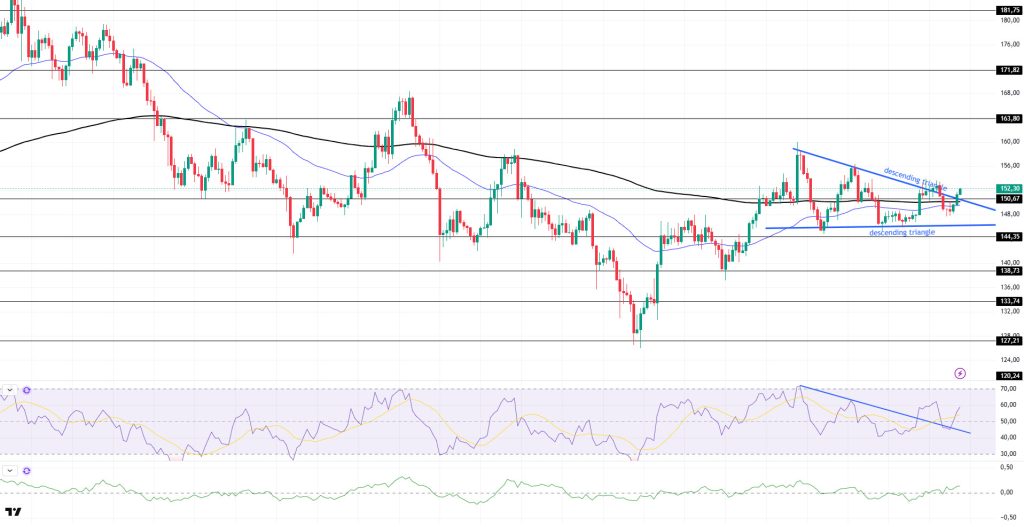
SOL price experienced an uptick during the day. The asset accelerated and broke above the strong resistance levels of the 50 EMA (Blue Line) and 200 EMA (Black Line) moving averages, opening above the apex of the descending triangle formation. If the upward momentum continues, the 163.80 dollar level could be targeted.
On the 4-hour chart, the 50 EMA (Blue Line) remained below the 200 EMA (Black Line). This indicates that the downward trend may continue in the medium term. At the same time, the price being above both moving averages shows that the market is currently trending upward in the short term. The Chaikin Money Flow (CMF-20) remained in positive territory; however, a decrease in money inflows could push the CMF into negative territory. The Relative Strength Index (RSI-14) has moved into positive territory. Additionally, it has re-entered the upper region of the downtrend that began on Junho 30. This could strengthen the upward movement. In the event of an upward movement due to positive macroeconomic data or news related to the Solana ecosystem, the $163.80 level emerges as a strong resistance point. If this level is broken upward, the upward movement is expected to continue. In the event of a pullback due to adverse developments or profit-taking, the $144.35 level could be tested. A decline to these support levels could see an increase in buying momentum, potentially presenting an opportunity for an upward move.
Suportes 150,67 - 144,35 - 138,73
Resistências 163,80 - 171,82 - 181,75
DOGE/USDT
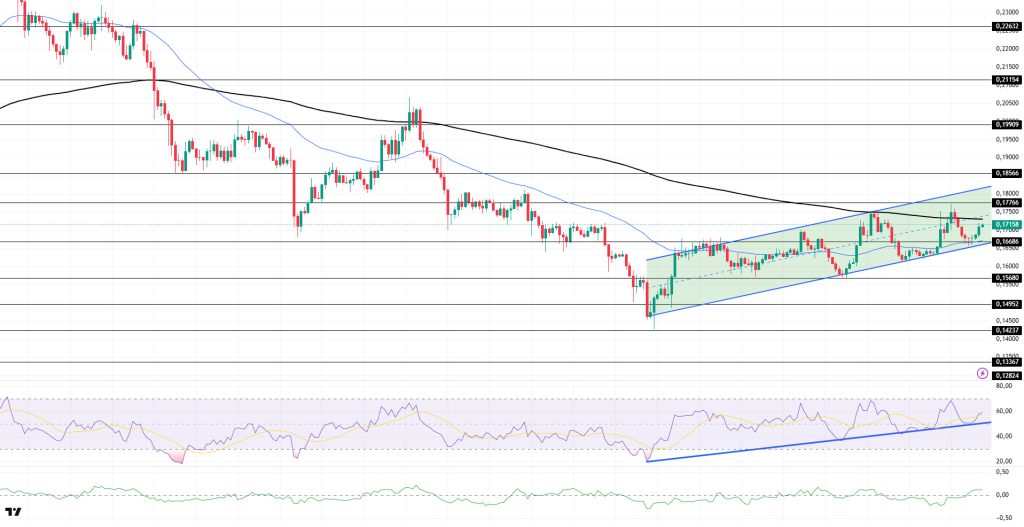
DOGE price rose during the day. The asset managed to stay above the 50 EMA (Blue Line) moving average and is currently testing the 200 EMA (Black Line) moving average as resistance. If the price continues to rise while remaining within the descending flag formation, the 0.18566 dollar level could be targeted upon a candle close above the descending flag formation.
On the 4-hour chart, the 50 EMA (blue line) remains below the 200 EMA (black line). This indicates that the asset is in a downward trend in the medium term. The price being between the two moving averages indicates that the asset is in a decision-making phase in the short term. Chaikin Money Flow (CMF-20) remains in positive territory. Additionally, positive cash inflows could push the CMF to the upper levels of the positive zone. The Relative Strength Index (RSI-14) retreated from the overbought level to the middle of the positive zone and continued to remain above the upward trend that began on Junho 22, supported by this trend. In the event of potential upward movements driven by political developments, macroeconomic data, or positive news flow within the DOGE ecosystem, the $0.17766 level emerges as a strong resistance zone. In the opposite scenario or in the event of negative news flow, the $0.16686 level could be triggered. A decline to these levels could lead to increased momentum, potentially sparking a new upward wave.
Supports 0.16686 – 0.15680 – 0.14952
Resistance levels 0.17766 – 0.18566 – 0.19909
Aviso legal
As informações sobre investimentos, os comentários e as recomendações aqui contidos não constituem consultoria de investimentos. Os serviços de consultoria de investimentos são prestados individualmente por instituições autorizadas, levando em conta as preferências de risco e retorno dos indivíduos. Os comentários e recomendações contidos neste documento são de natureza geral. Essas recomendações podem não ser adequadas à sua situação financeira e às suas preferências de risco e retorno. Portanto, tomar uma decisão de investimento com base apenas nas informações contidas neste documento pode não produzir resultados de acordo com suas expectativas.

