
BTC/USDT
The Trump administration is set to unveil a comprehensive policy report on digital assets on Julho 22, while the US Senate will take up the crypto regulatory framework on Quarta-feira. On the other hand, Treasury Secretary Bessent announced an increase in the overall level of tariffs to 20%, indicating a new phase in trade negotiations. On the institutional investor side, Strategy updated the total value of BTC reserves to exceed $64 billion, while CoinShares reported over $1 billion in digital asset inflows on a weekly basis.
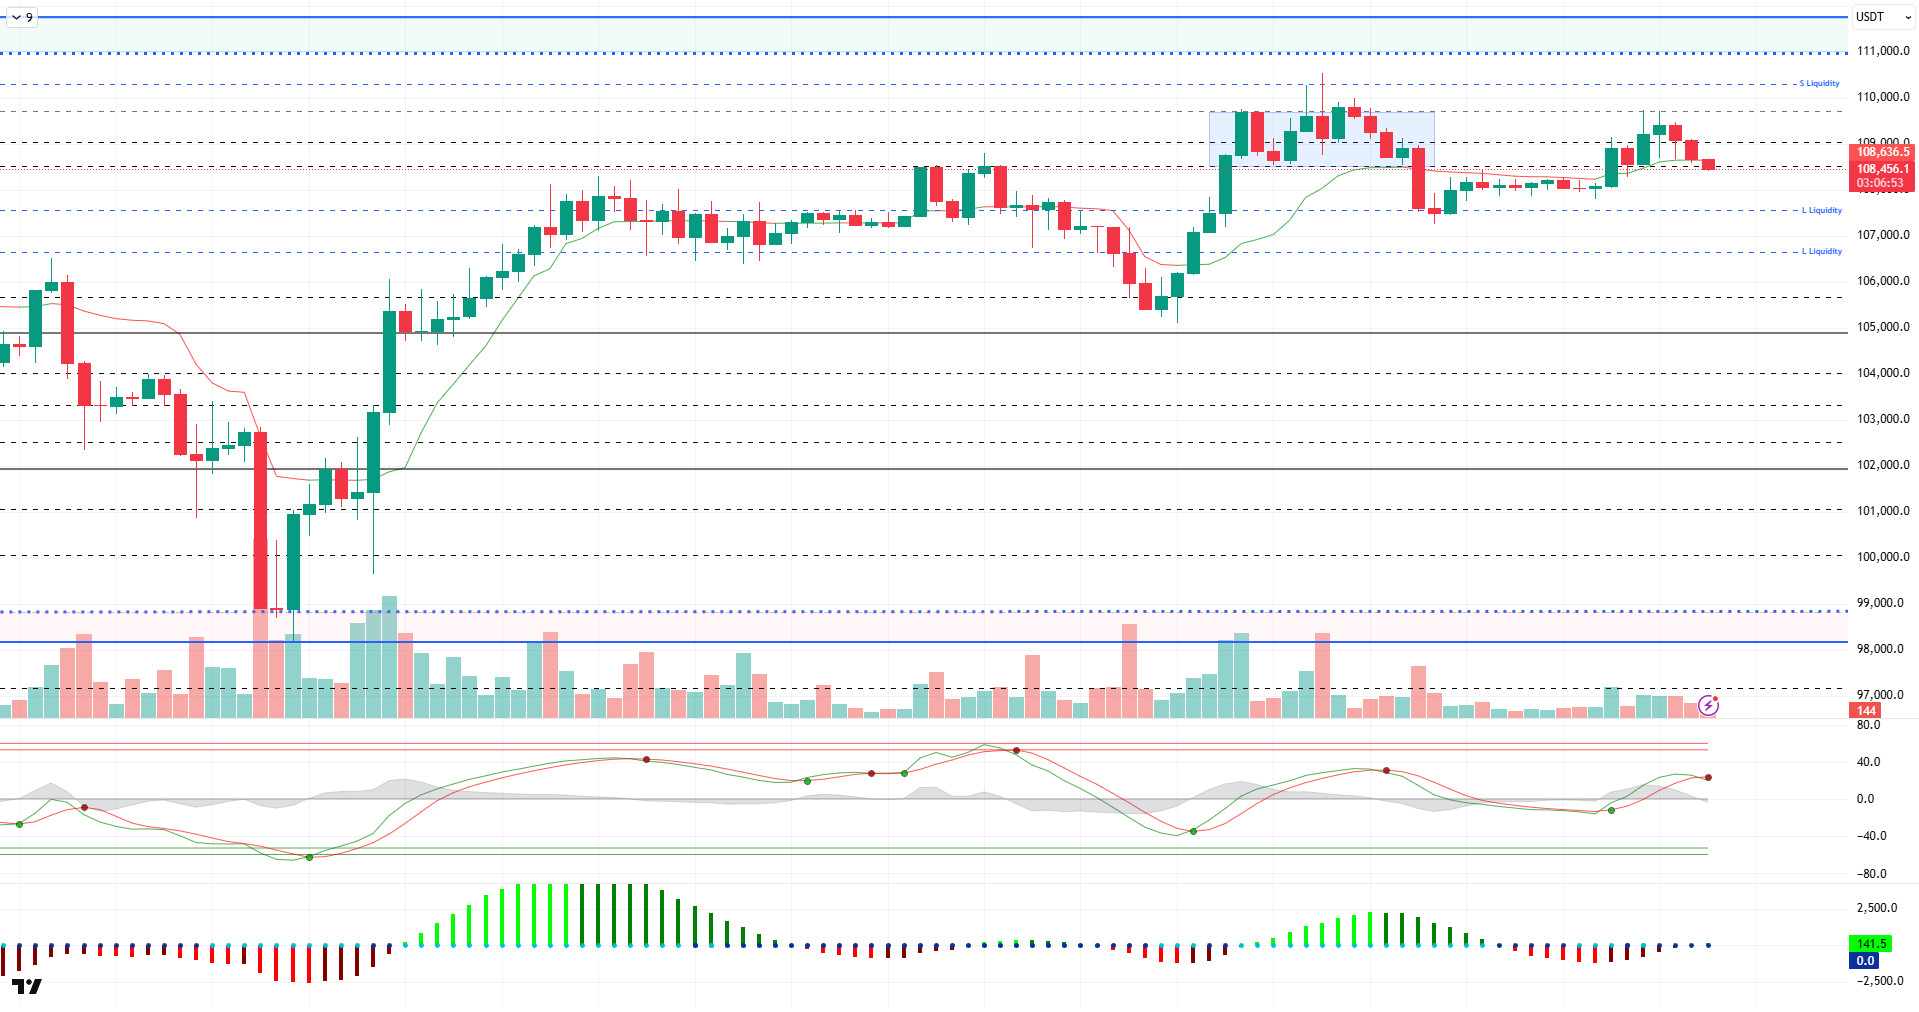
When we look at the technical outlook, BTC continues to maintain its strong stance, while the horizontal band range it formed near the ATH level attracts attention. BTC, which exhibits low volatile movements during the day, continues to trade just below 109,000.
Technical indicators, Wave Trend (WT) is showing signs of weakening, while the histogram on the Squeeze Momentum (SM) indicator continues to be in negative territory. The Kaufman moving average crossed just above the price at 108,400.
When the liquidity data is analyzed, BTC, which headed towards the liquidity area with the recent rise, continues to maintain the accumulated sell positions at 110,000. This time, the buying level has gained intensity between the 106,000 and 107,000 band.
As a result, while fundamental developments continue to be a catalyst for pricing, a new catalyst may be needed for the uptrend to gain momentum after this stage. While technicals are once again pointing in the direction of selling, liquidity data may support this scenario. In this context, while liquidity areas continue to be a reference in a possible selling pressure, we will follow the closures above 110,000 in the continuation of the rise to be a reference for us on behalf of ATH.
Supports 109,000 – 108,500 – 107,500
Resistências 110.000 - 111.000 - 111.970
ETH/USDT
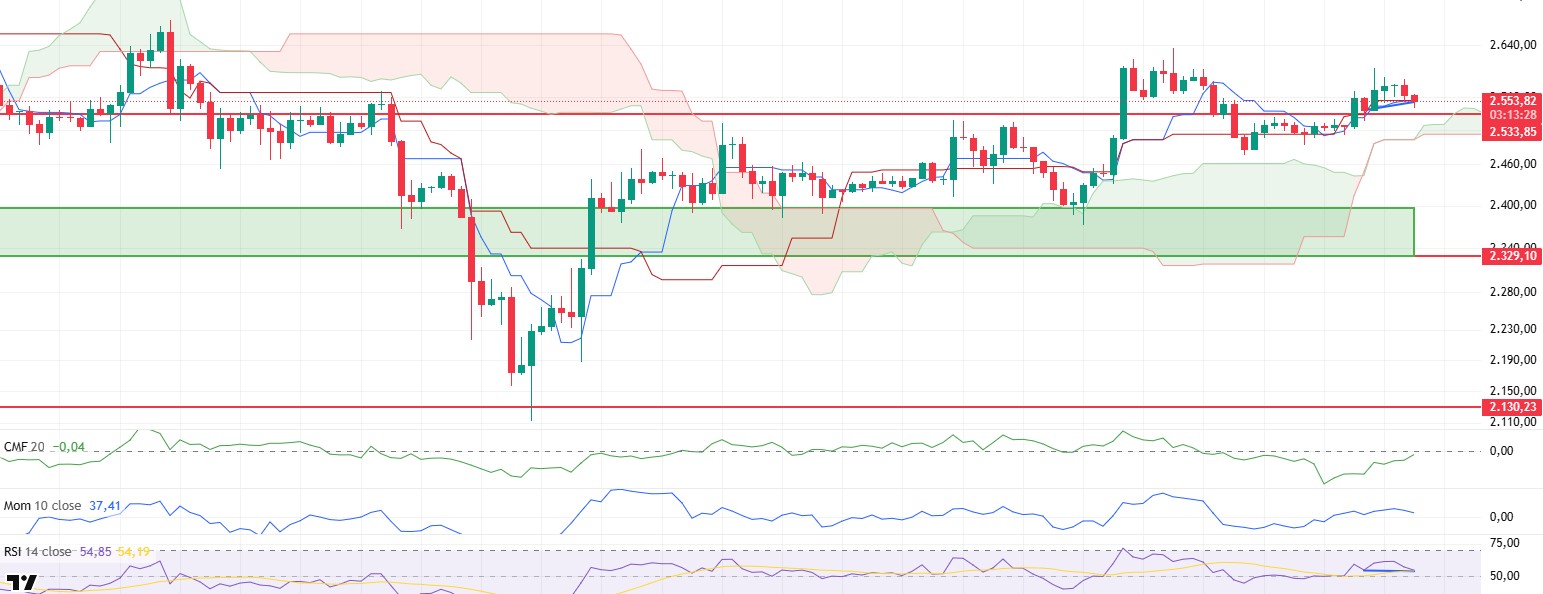
Despite the positive course in technical indicators during the day, ETH experienced a limited retreat, remaining under pressure due to the weakness seen in US stock market futures. The search for balance, especially at the $2,550 level, attracted attention. While the effort to hold at this level continues, the general positive trend in technical indicators is still maintained.
The Chaikin Money Flow (CMF) indicator climbed up to the zero line, indicating that liquidity inflows to the market continue. This activity indicates that despite the decline, buyers have not completely withdrawn and there is still some capital flow in the market. In particular, the upward acceleration of the Long/Short Ratio after the decline reveals that investors are taking the decline as an opportunity and long positions have started to increase.
The Relative Strength Index (RSI) indicator, on the other hand, retreated sharply with the price to the based MA line, but the positive divergence at this level is noteworthy. Such positive divergence usually creates potential for a rebound in the price. However, despite this positive signal, the weakening in overall momentum suggests that short-term risks are still on the table and the market is struggling to move upwards.
The Ichimoku indicator shows that the price retreated to both Tenkan and Kijun levels, but managed to stay above the kumo cloud. The fact that the cloud structure is still upward indicates that the overall trend remains positive, while the fact that the price has sagged to short-term support zones reveals that short-term fragility continues.
In summary, if the price maintains the support level of $2,533 in the evening, upward reactions are likely to come. In this case, it can be expected to test the $2,600 levels again. However, if the $2,533 support is broken, the risk of the price heading to the lower band of the kumo cloud, i.e. a deeper correction area, will increase. Therefore, this support zone is critical for the rest of the day.
Suporta 2.533 - 2.329 - 2.130
Resistências 2.736 - 2.857 - 3.062
XRP/USDT
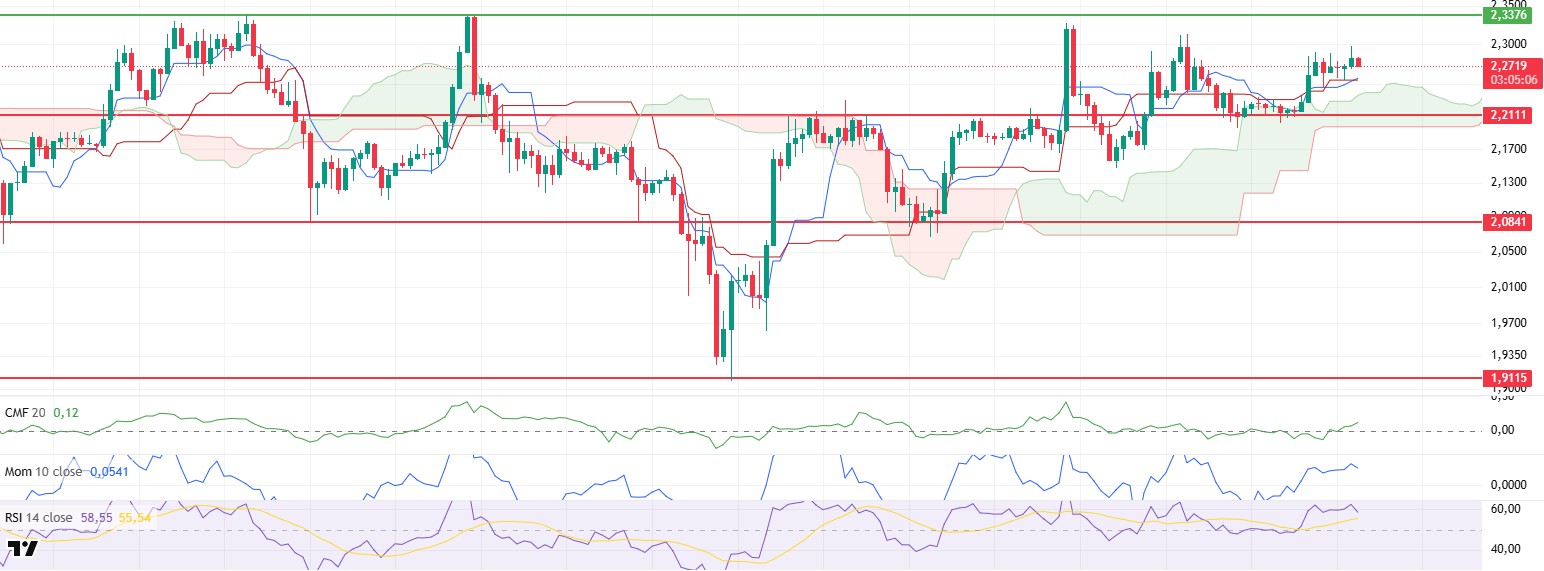
XRP, after rising as high as $2.29 during the day, remained under some pressure with the general retreat in the cryptocurrency market and fell to $2.27. However, despite this short-term decline, it is observed that the positive structures in technical indicators continue to be maintained. In particular, the fact that the price is still above critical support levels and the positive outlook in most of the indicators indicates that this retracement may remain limited.
Chaikin Money Flow (CMF) indicator continues to trend upwards in positive territory. This indicates that liquidity inflows to the market continue and investor interest continues. The strong liquidity flow supports that the appetite for buying continues despite the price remaining under pressure in the short term. However, underlying this divergence between price and indicators is the downward trend observed in the Cumulative Volume Delta (CVD) futures indicator. This weakening in CVD reveals that sellers’ pressure in futures markets is more pronounced compared to buyers in spot markets.
Although momentum indicators and Relative Strength Index (RSI) showed limited pullbacks, it is noteworthy that both indicators remain structurally in positive territory. This outlook indicates that the current price action is a healthy correction and the ground is being prepared for a continuation of the uptrend. The fact that the RSI is still above the neutral zone indicates that the buying potential is preserved and an upward movement may find technical support.
The Ichimoku indicator shows a classic buy signal as the Tenkan line crosses the Kijun level upwards. This technical structure generates a positive signal for the direction of the price. In addition, the fact that the price continues to hover above the kumo cloud and the cloud continues its upward expansion confirms that the trend remains positive and the upward momentum continues.
Given this technical outlook, it is likely that the XRP price will make a bullish move towards the $2.33 level again in the evening. However, the $2.21 level is technically critical support. If this level is broken downwards, the technical structure may weaken and the downward momentum may accelerate with more severe correction movements. Therefore, the $2.21 level should be monitored as an important threshold in terms of both maintaining the short-term trend and keeping the overall structure positive.
Supports 2.2111 – 2.0841 – 1.9115
Resistances 2.3376 – 2.5900 – 2.8347
SOL/USDT
Solana’s newest memecoin launchpad, LetsBonk, doubled Pump.fun’s daily revenue by $1.04 million.
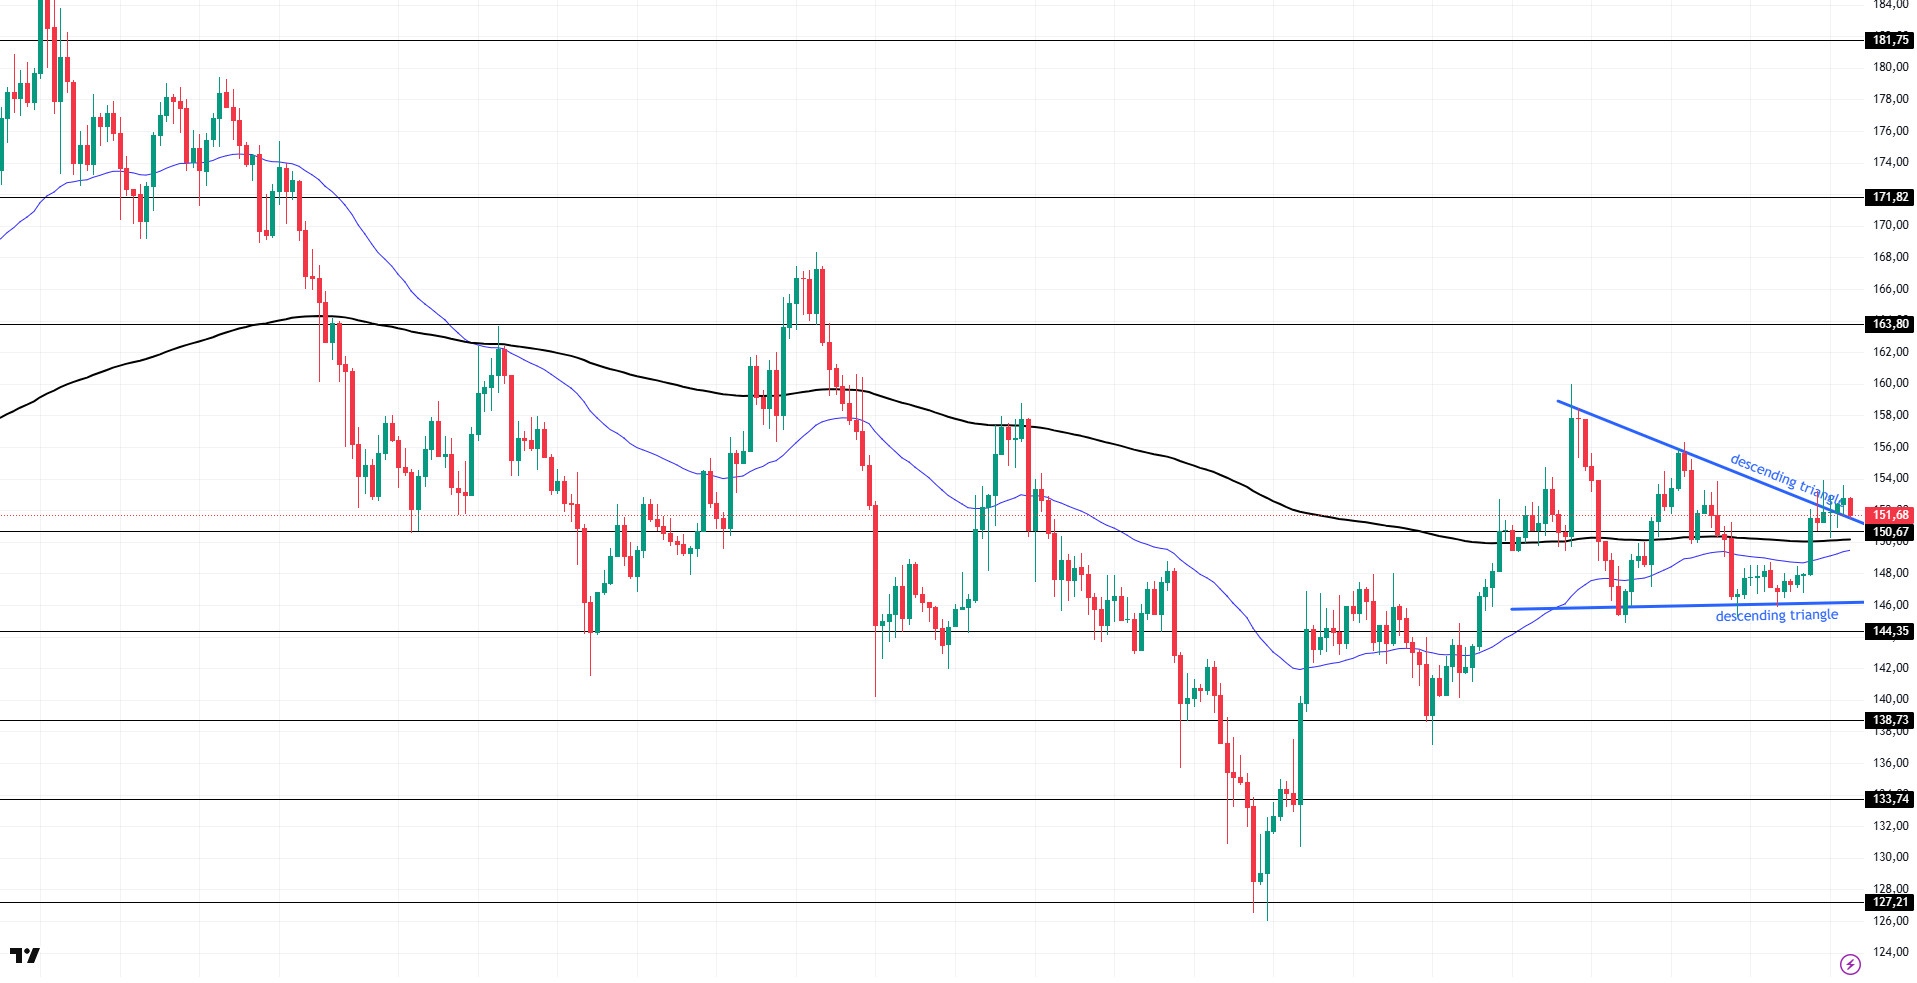
SOL price was bullish during the day. The asset took support from the 200 EMA (Black Line) moving average, a strong support location, and broke the ceiling of the descending triangle pattern with upside momentum. The price, which is currently testing the ceiling level of the descending triangle pattern as support, should follow the $ 163.80 level if it manages to stay above this level.
On the 4-hour chart, the 50 EMA (Blue Line) continued to be below the 200 EMA (Black Line). This suggests that the bearish trend may continue in the medium term. At the same time, the fact that the price is above both moving averages suggests that the market is currently bullish in the short term. Chaikin Money Flow (CMF-20) has crossed into positive territory; additionally, a decline in inflows may move CMF into negative territory. Relative Strength Index (RSI-14) remained in positive territory. Additionally, it remains above the downtrend that started on Junho 30. This could be bullish. The $163.80 level stands out as a strong resistance point in the event of a rise on the back of macroeconomic data or positive news on the Solana ecosystem. If this level is broken upwards, the rise can be expected to continue. If there are pullbacks due to contrary developments or profit realizations, the $ 144.35 level can be tested. In case of a decline to these support levels, the increase in buying momentum may offer a potential bullish opportunity.
Suportes 150,67 - 144,35 - 138,73
Resistências 163,80 - 171,82 - 181,75
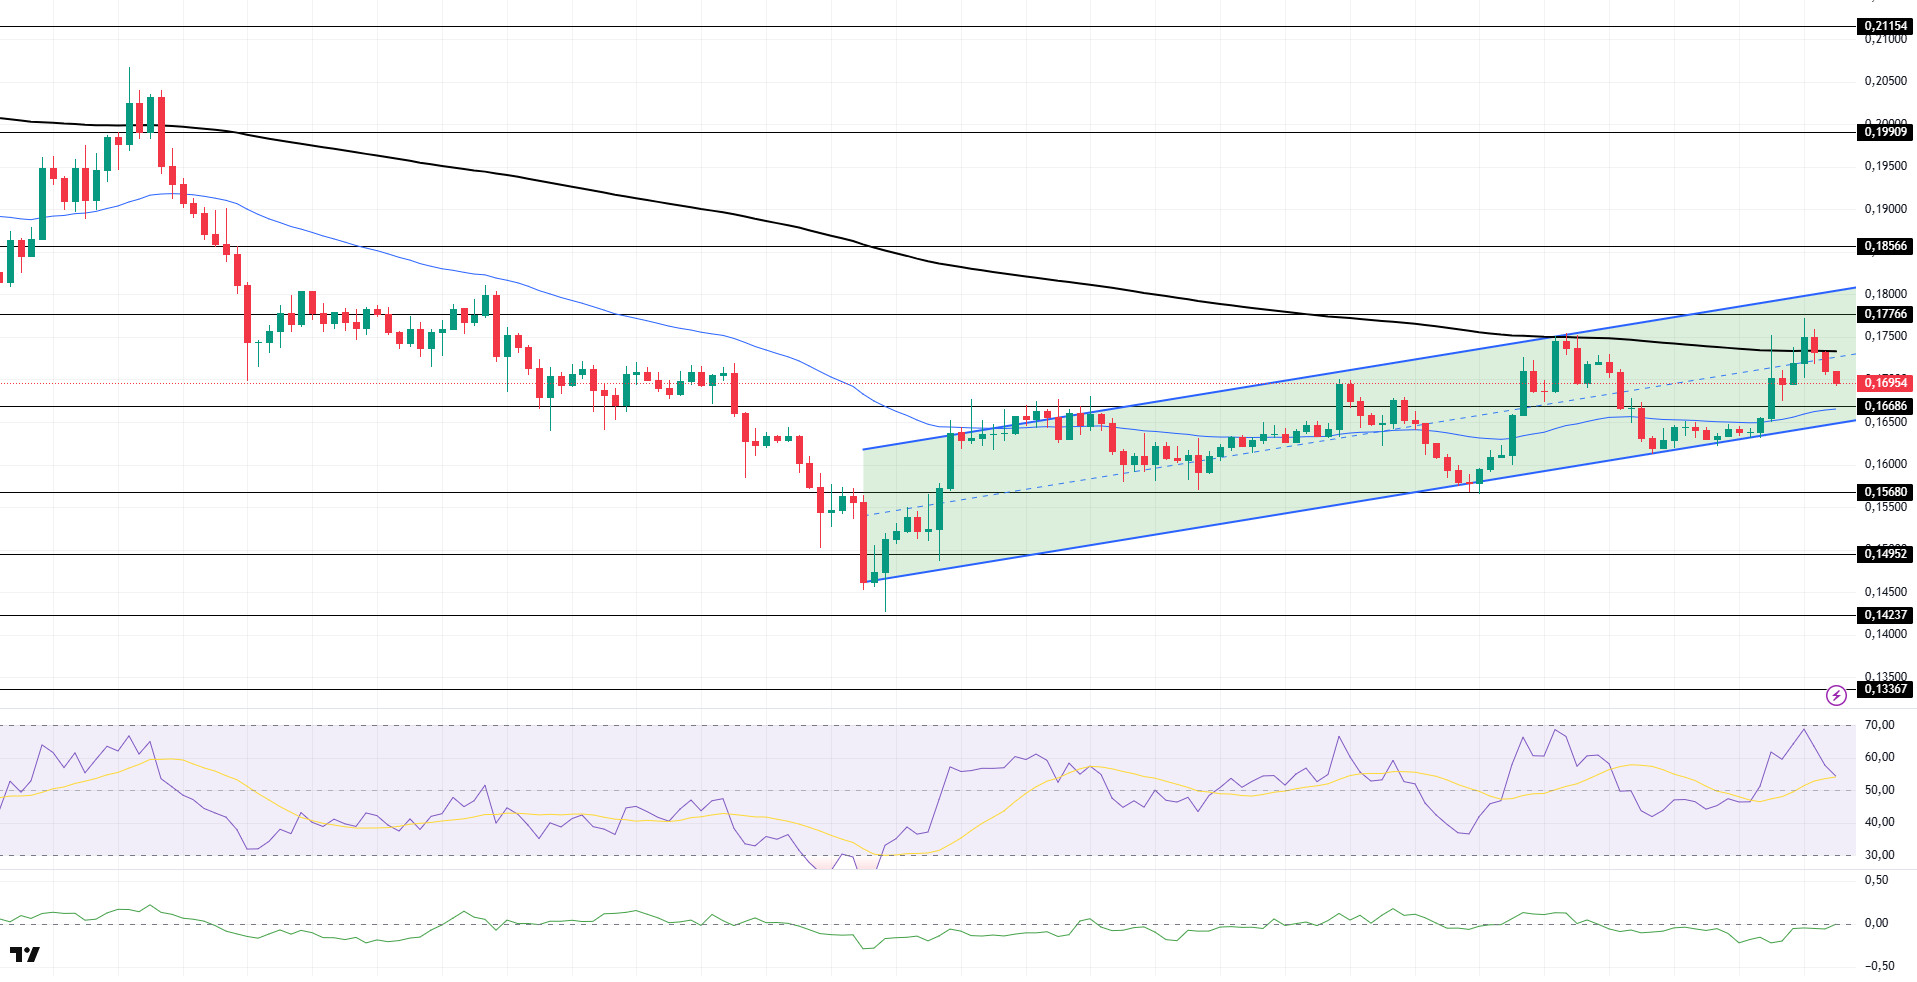
DOGE/USDT
DOGE price depreciated during the day. The asset, which managed to stay above the 50 EMA (Blue Line) moving average, failed to stay above the 200 EMA (Black Line) moving average and started pricing below the mid-level of the uptrend. If the price, which continues to stay inside the falling pennant pattern, continues to retreat, it may test the 50 EMA moving average as support.
On the 4-hour chart, the 50 EMA (Blue Line) continues to be below the 200 EMA (Black Line). This suggests that the asset is bearish in the medium term. The fact that the price is between both moving averages suggests that the asset is in the decision-making phase in the short term. Chaikin Money Flow (CMF-20) has started to be at a neutral level. In addition, negative inflows may move CMF into negative territory. Relative Strength Index (RSI-14), on the other hand, retreated from the overbought level and retreated to the middle of the positive zone, indicating that selling pressure is building. The $0.17766 level stands out as a strong resistance zone in the uptrend that may be experienced in line with political developments, macroeconomic data or positive news flow in the DOGE ecosystem. In the opposite case or possible negative news flow, the $0.16686 level may be triggered. In case of a decline to these levels, the momentum may increase and a new bullish wave may start.
Suporta 0,16686 - 0,15680 - 0,14952
Resistências 0,17766 - 0,18566 - 0,19909
Aviso legal
As informações sobre investimentos, os comentários e as recomendações aqui contidos não constituem consultoria de investimentos. Os serviços de consultoria de investimentos são prestados individualmente por instituições autorizadas, levando em conta as preferências de risco e retorno dos indivíduos. Os comentários e recomendações contidos neste documento são de natureza geral. Essas recomendações podem não ser adequadas à sua situação financeira e às suas preferências de risco e retorno. Portanto, tomar uma decisão de investimento com base apenas nas informações contidas neste documento pode não produzir resultados de acordo com suas expectativas.

