
Active Addresses
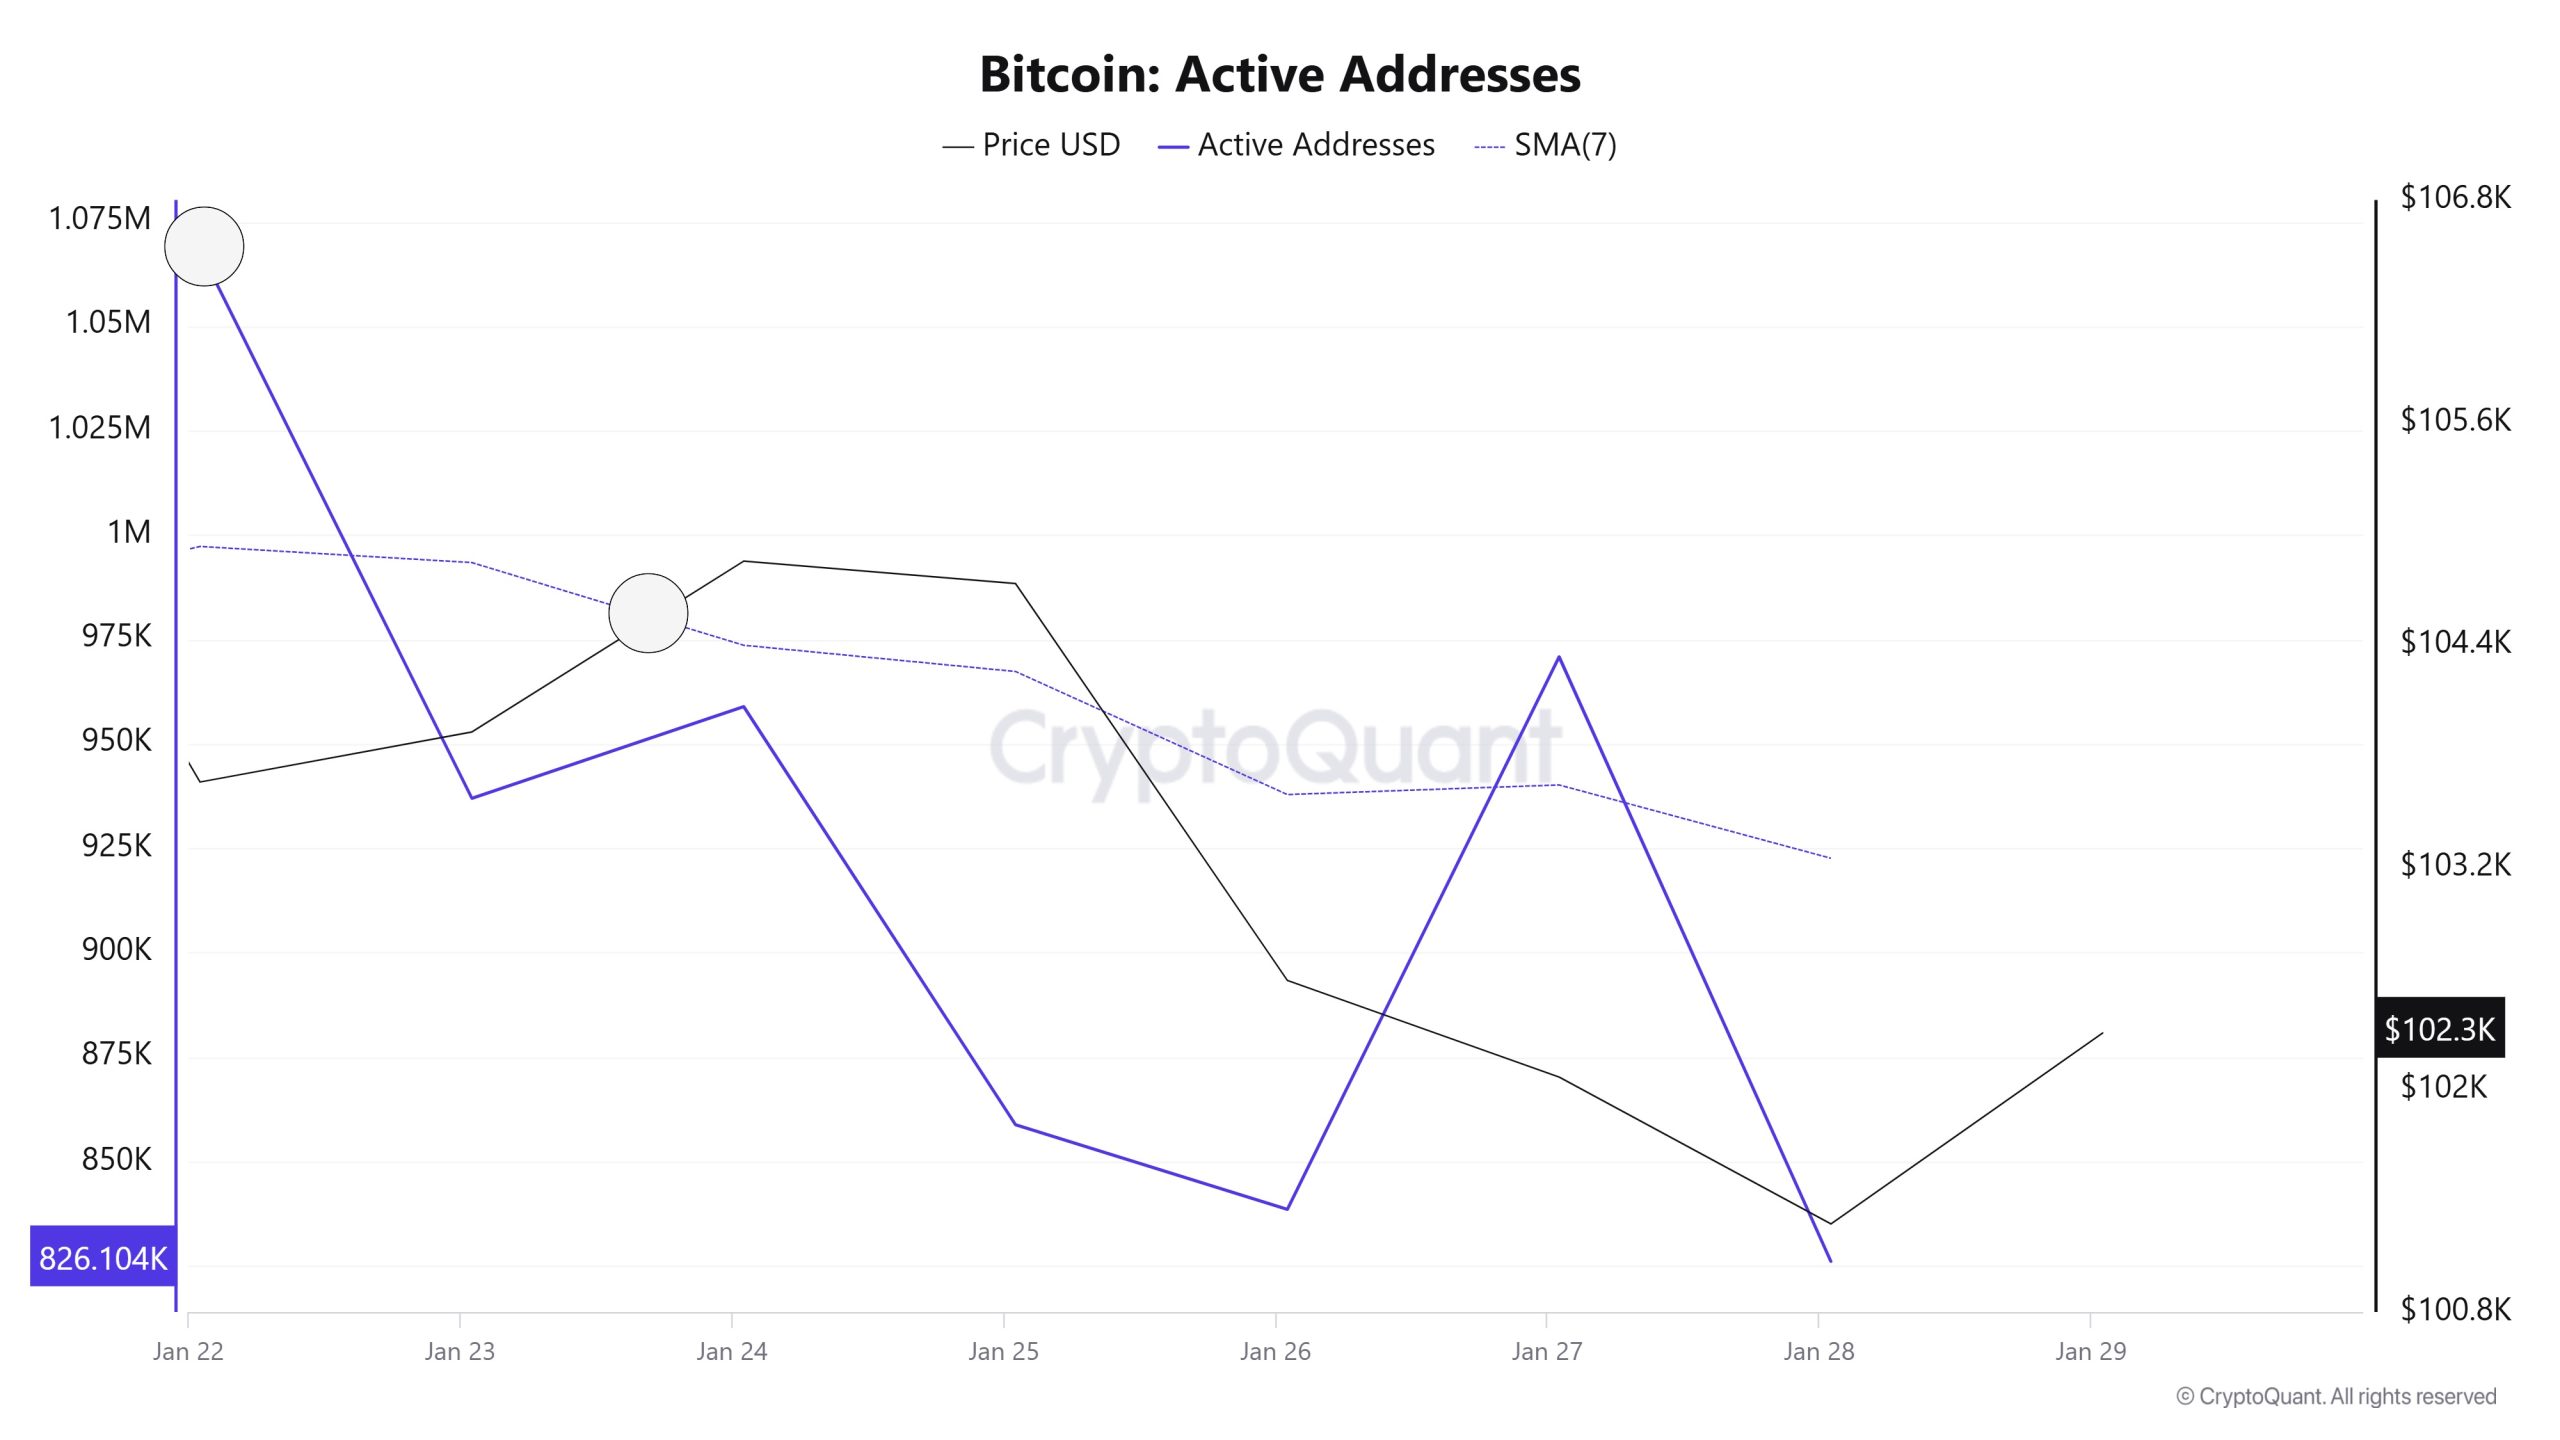
In the number of active addresses, there were 1,068,289 entries to exchanges between Janeiro 22 and Janeiro 29, 2025, this week. During this period, Bitcoin rose from 103,000 to 104,000. Bitcoin buying accelerated at the intersection of price and the number of active addresses in the region marked on the chart, which is the highest number of active addresses since the second half of Janeiro and the number of addresses ready to trade. On Janeiro 23rd, the number of active addresses rose to 1,068,289, which may indicate that the market is strengthening, and investors are more interested. When we follow the 7-day simple moving average, it is observed that the price follows an upward trend on the dates when this average cut the price. Bitcoin reached 993,708,148 in correlation with the active address EMA (7). This situation indicates that the Bitcoin price is experiencing entries from 102,000 levels.
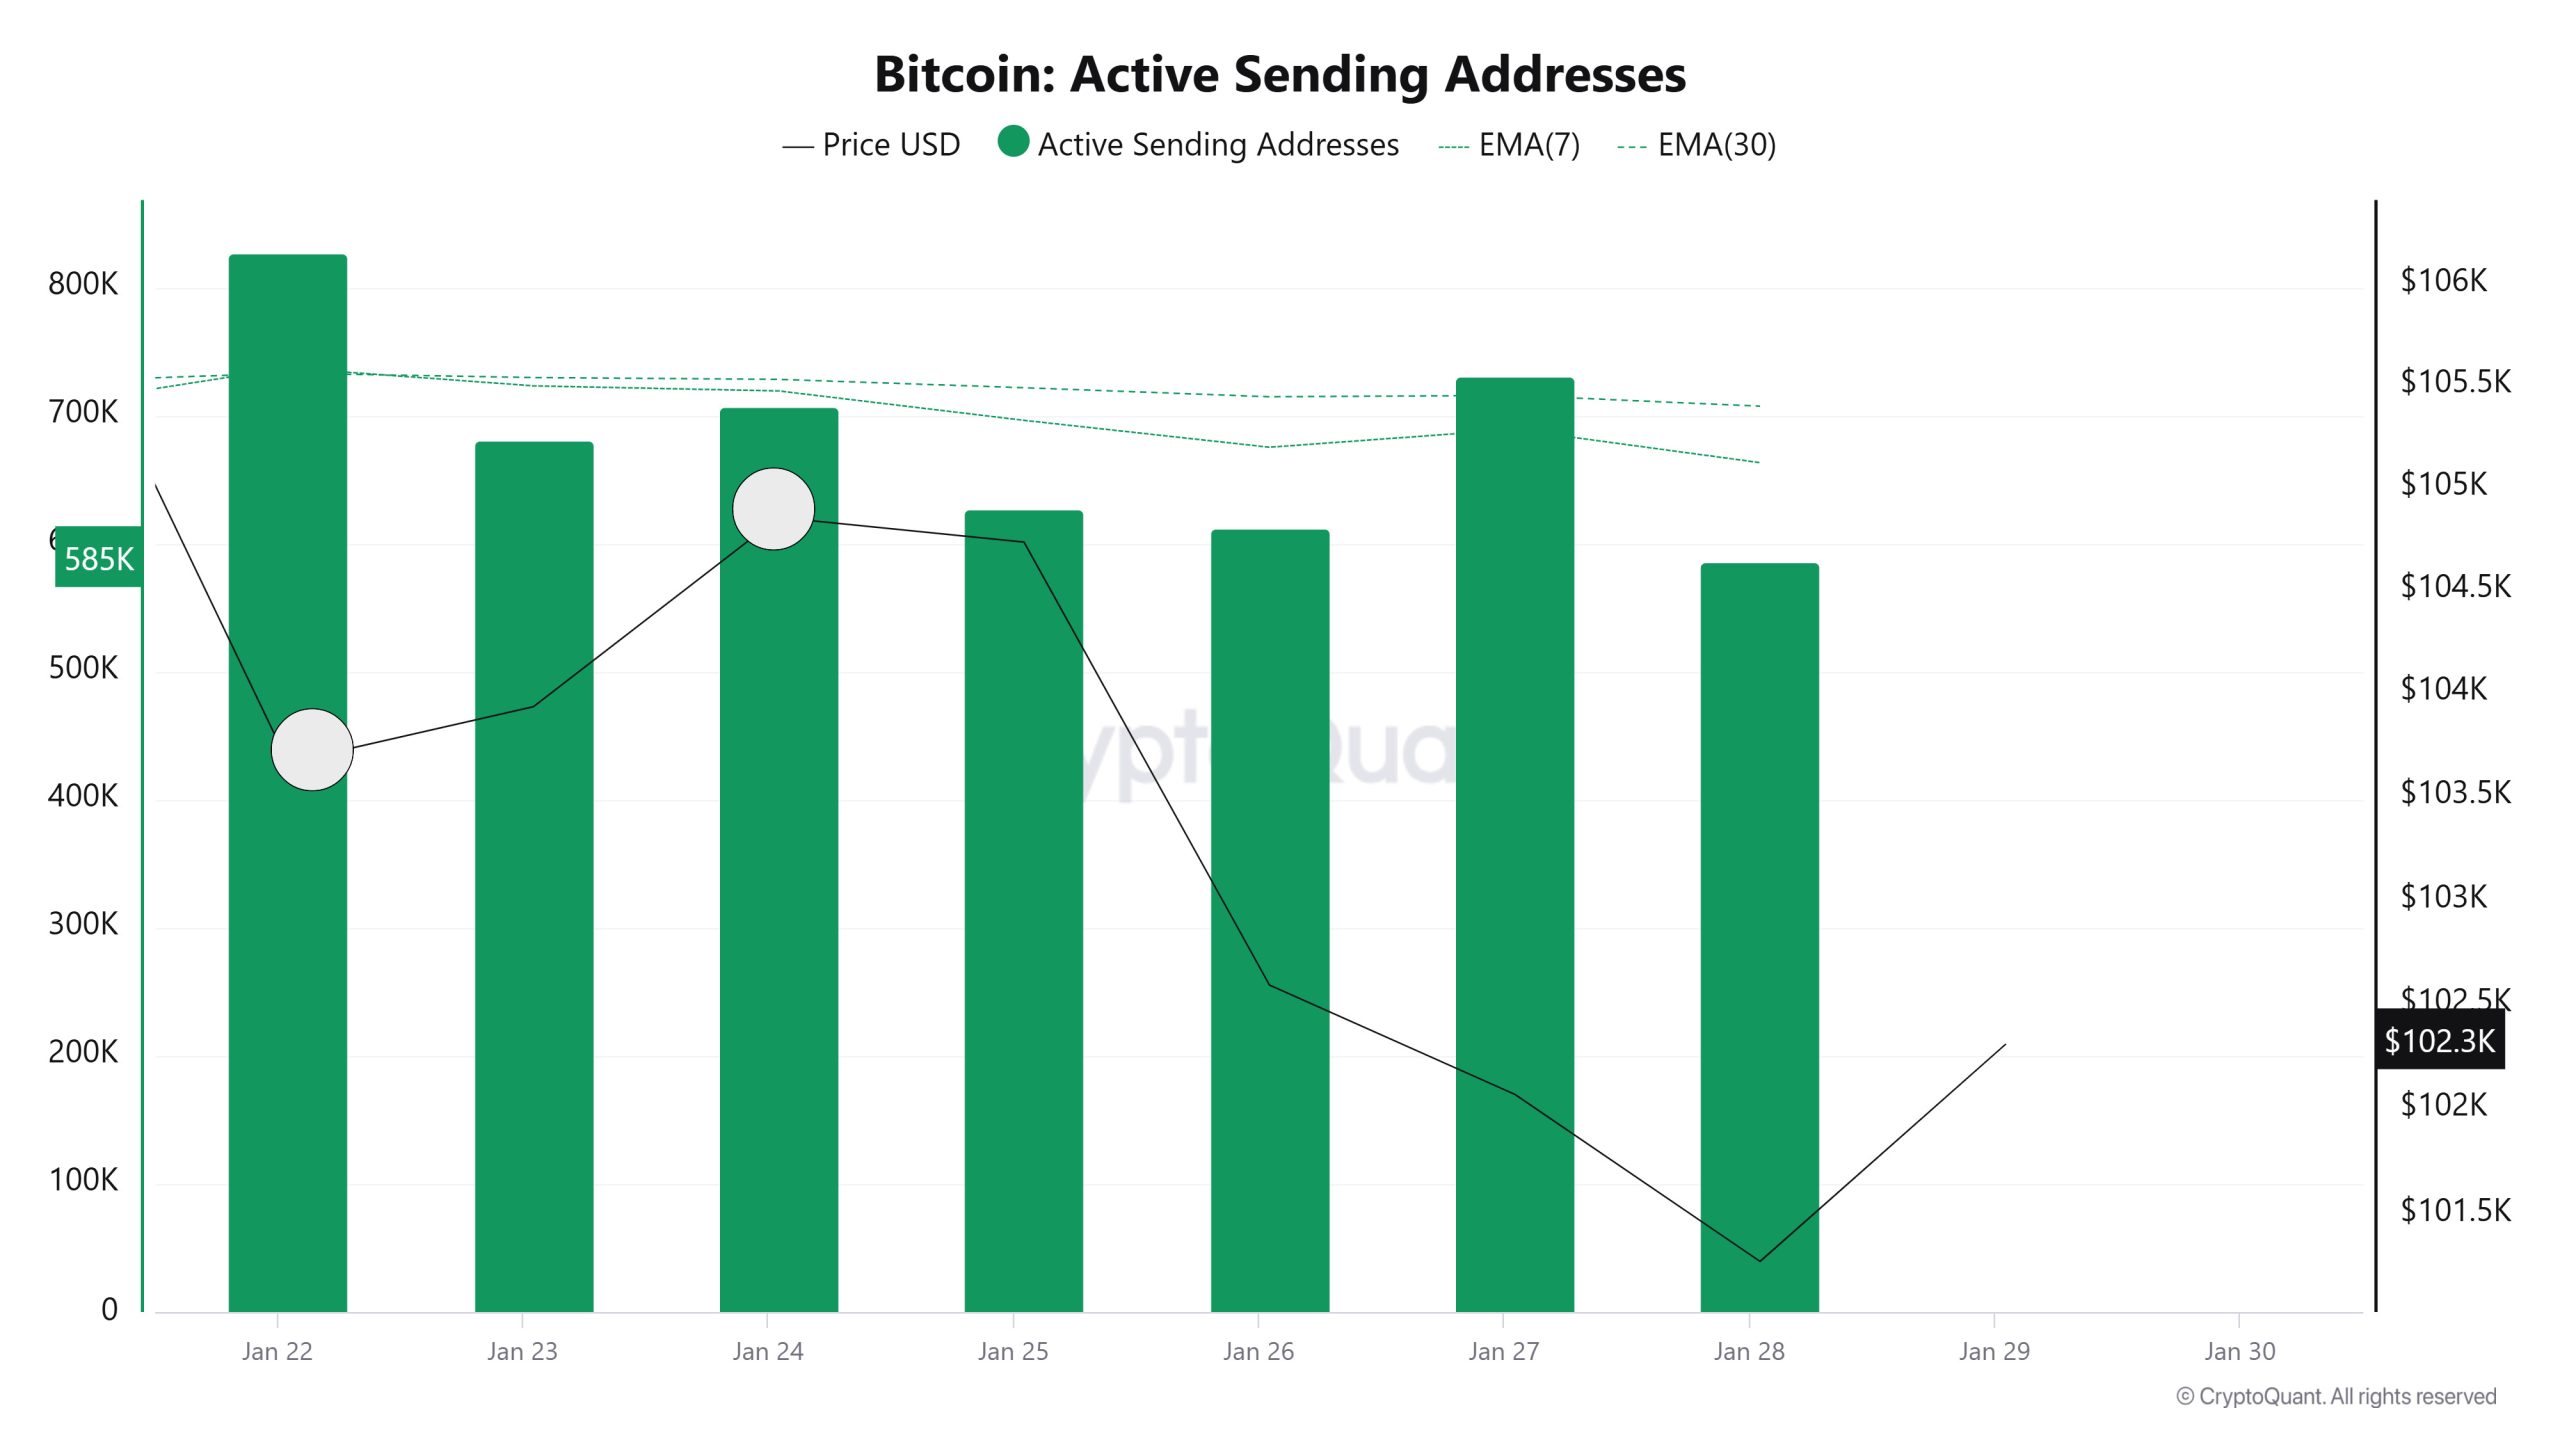
On the exits, there was a significant increase in active shipping addresses towards Janeiro 24, along with the Black Line (price line). On the day when the price peaked, the number of active sending addresses rose to 710,180 , indicating that buyers sold their positions as Bitcoin stayed around 104,000 for a while. The date with the lowest number of submissions was Janeiro 22 (price 102,000).
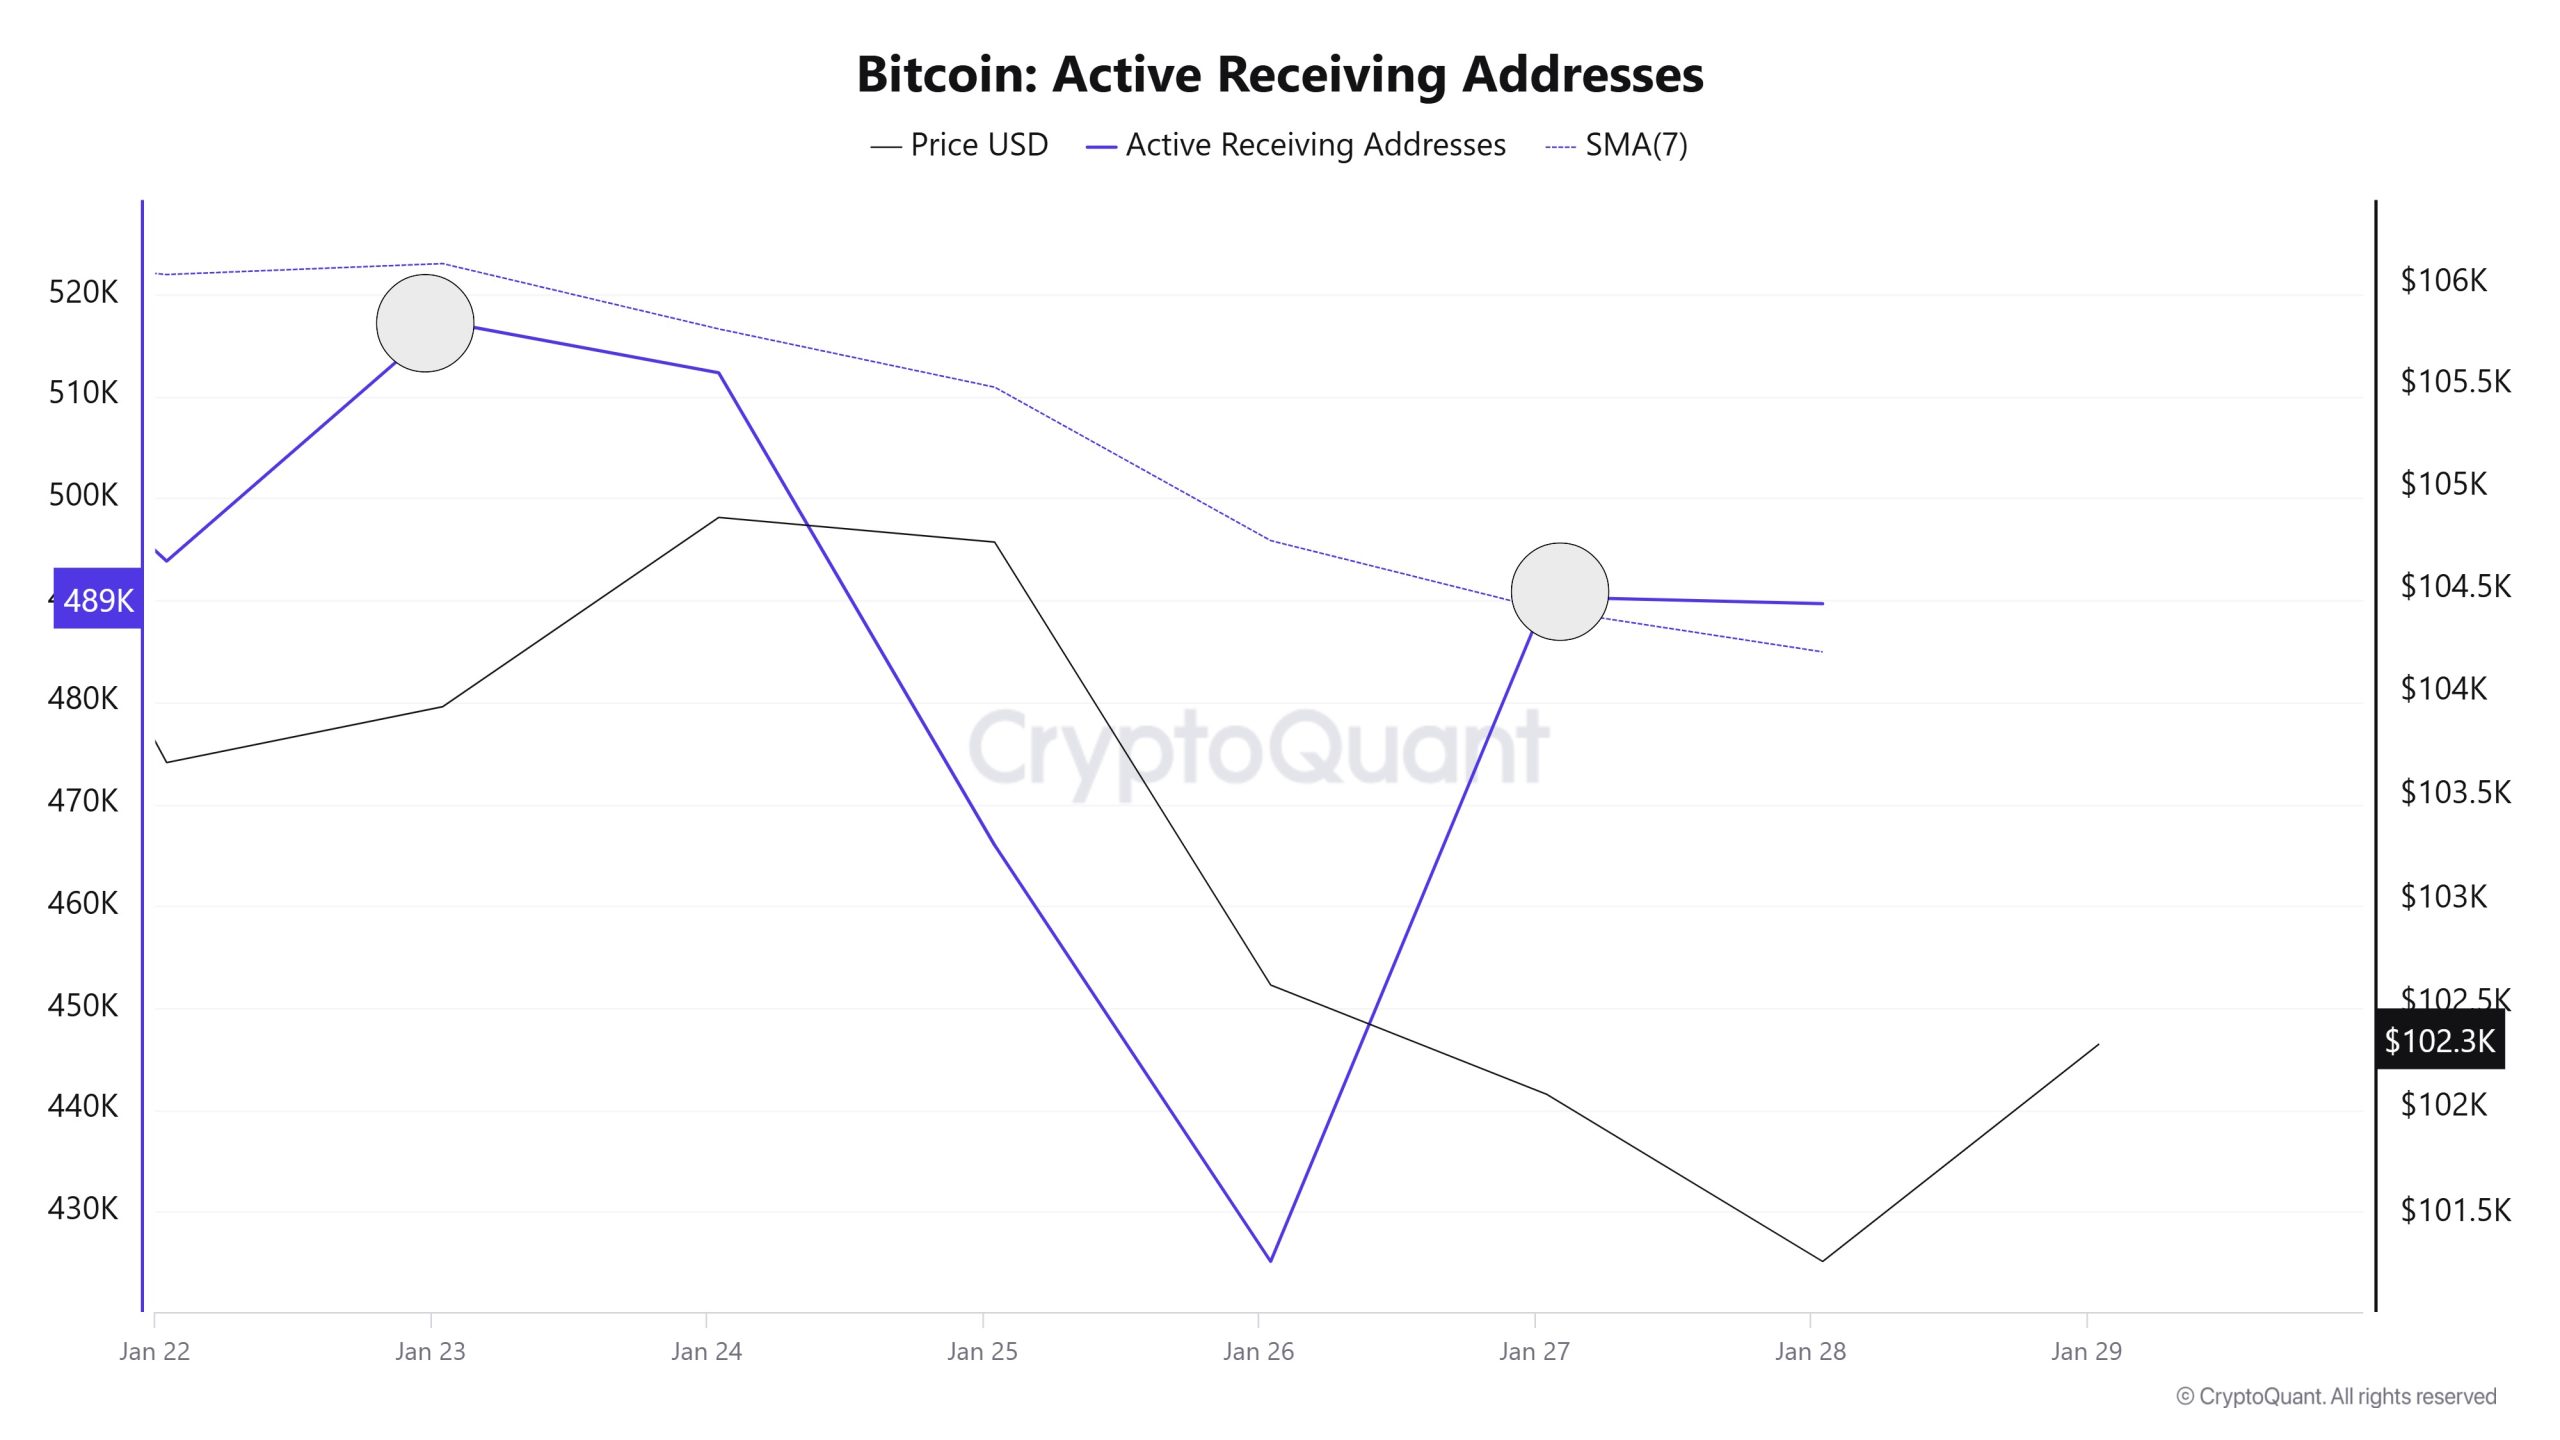
Active Receiving Addresses show that on Janeiro 23, the price (102,000 – 103,000) approached the highest level of the number of buyers (517,347) and was at the level where traders went longest to increase their bitcoin positions. However, the also shows
The SMA (7-Day) at 484.90 is close to changing the trend direction (entering the horizontal zone) at the intersection with the price. This may indicate the costing levels of buyers before the price rises.
Breakdowns
MRVR
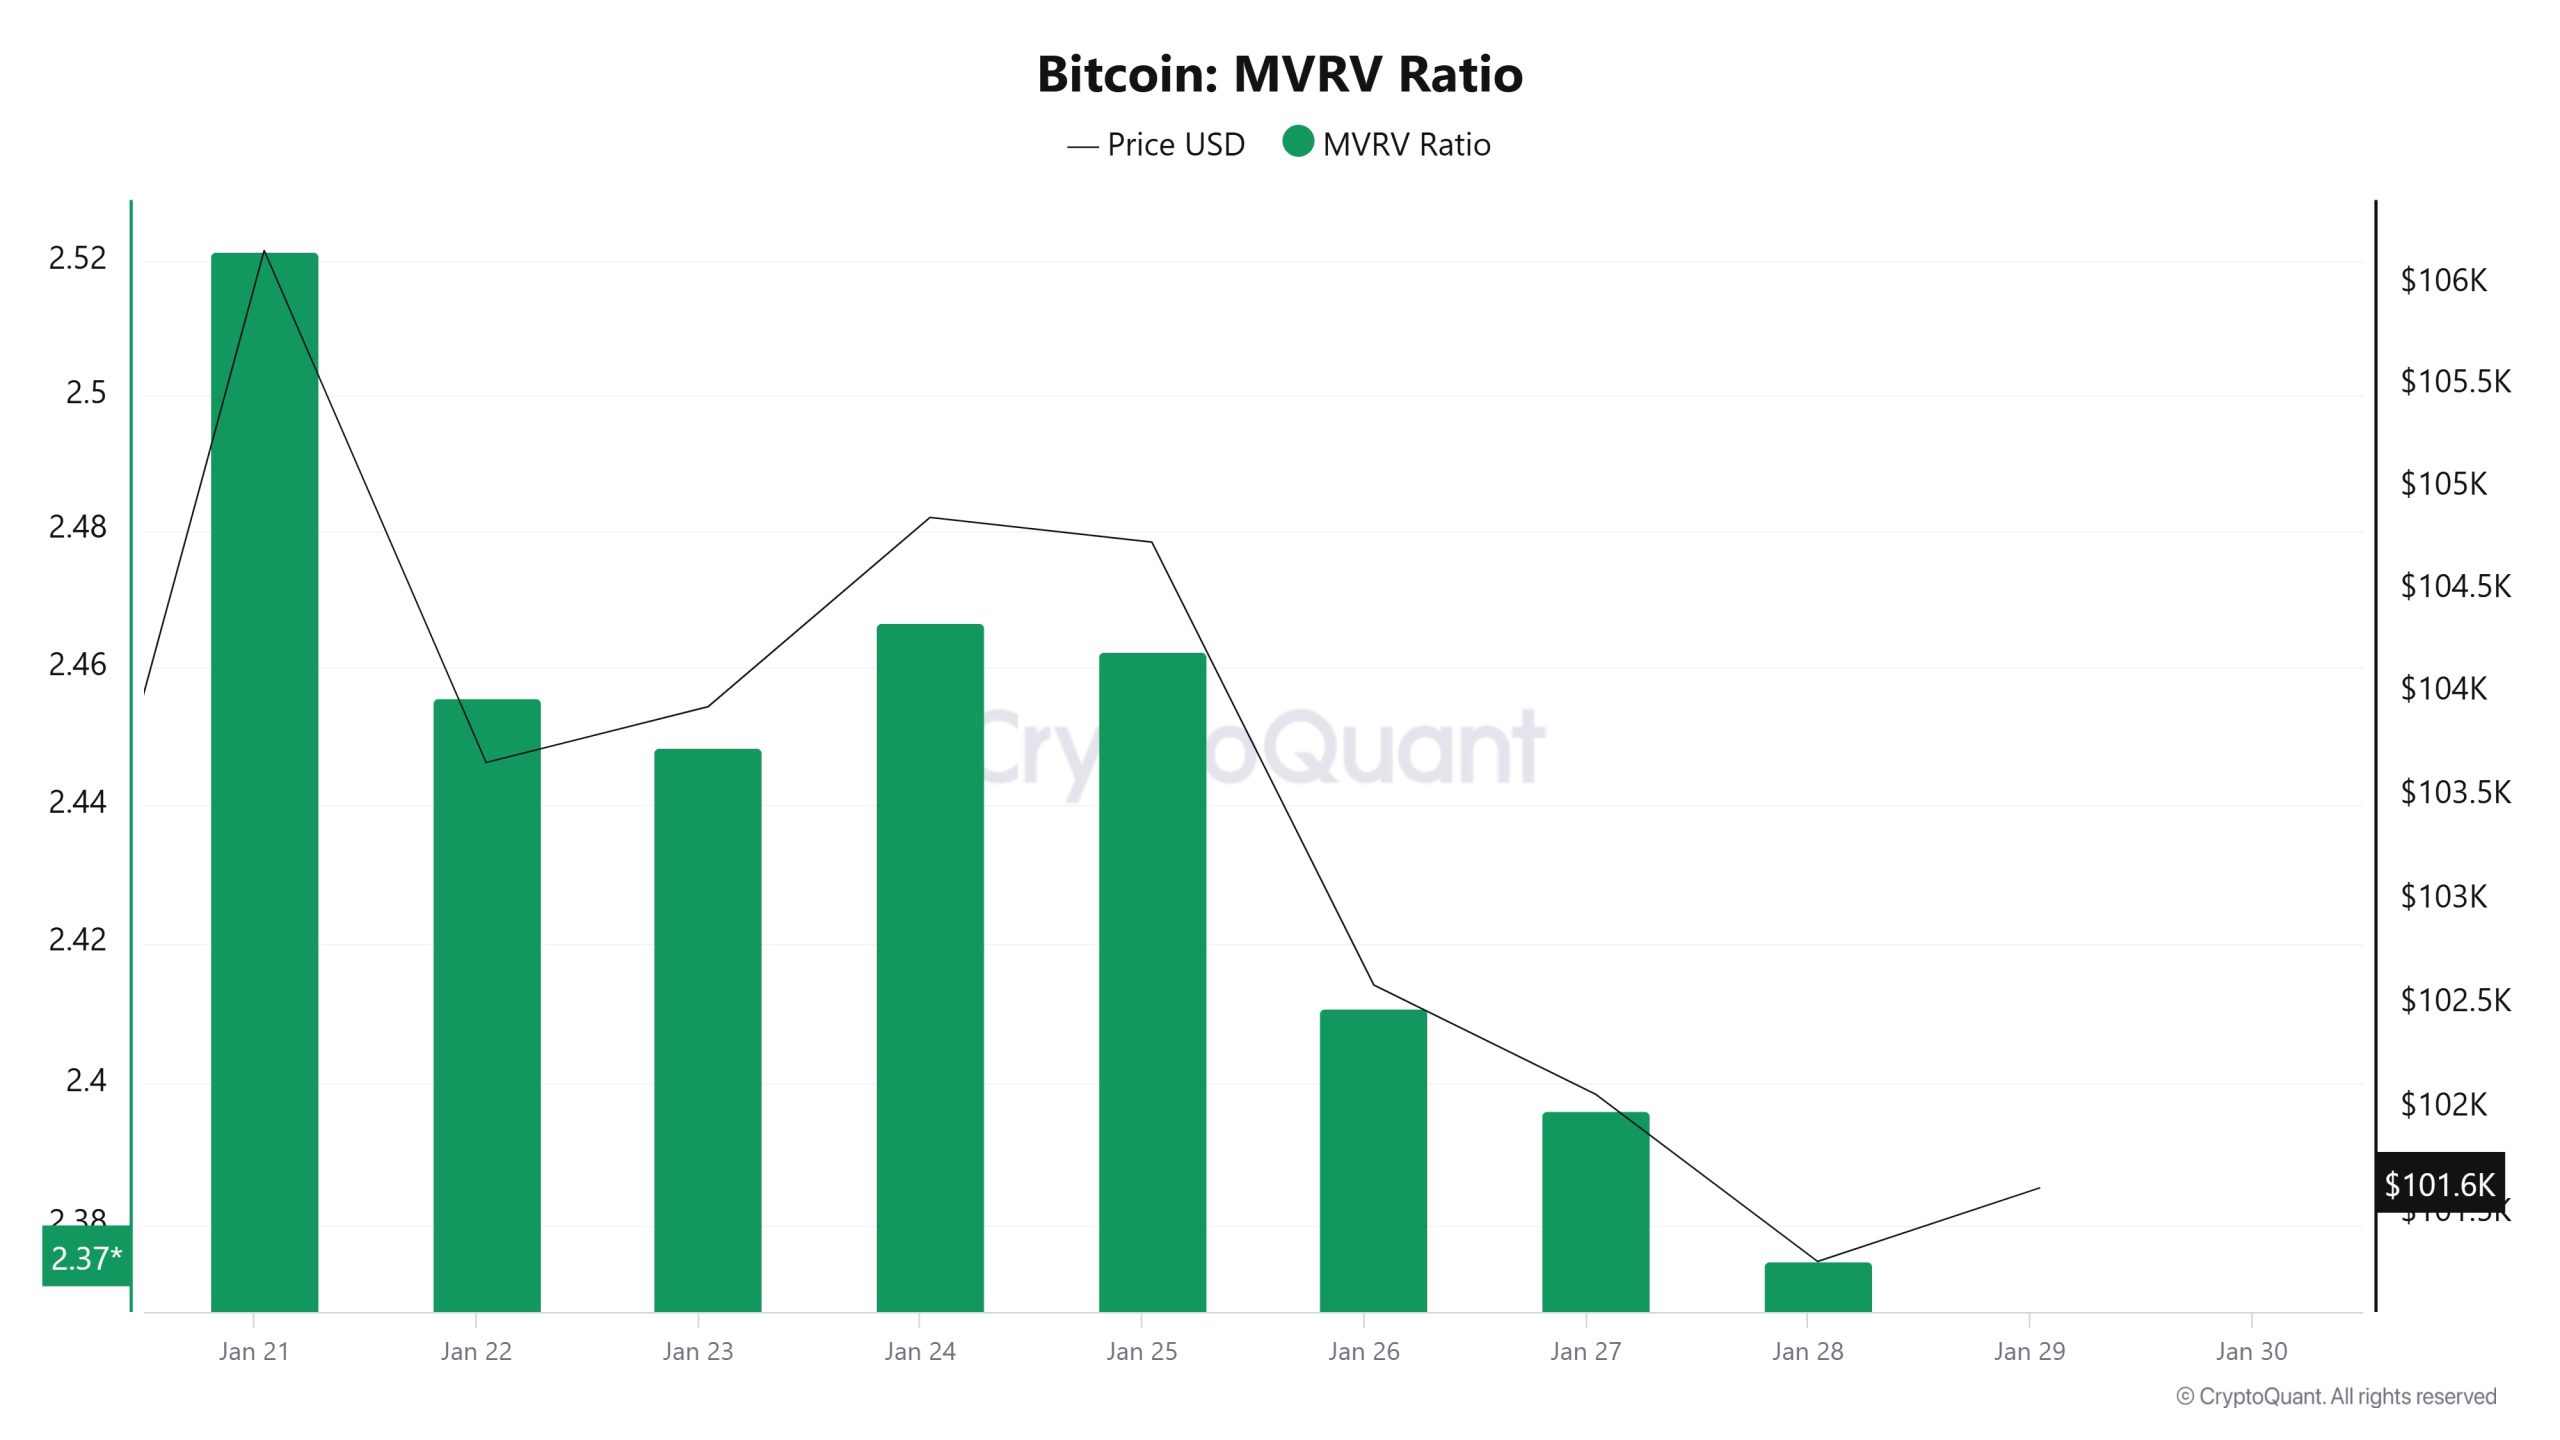
On Janeiro 22nd, the Bitcoin price was 103,659 while the MVRV Ratio was 2.45. As of Janeiro 28, the Bitcoin price was down to 101,275, while the MVRV Ratio was 2.37. Compared to last week, Bitcoin price decreased by 2.30% and MVRV Ratio decreased by 3.27%.
Realized Price
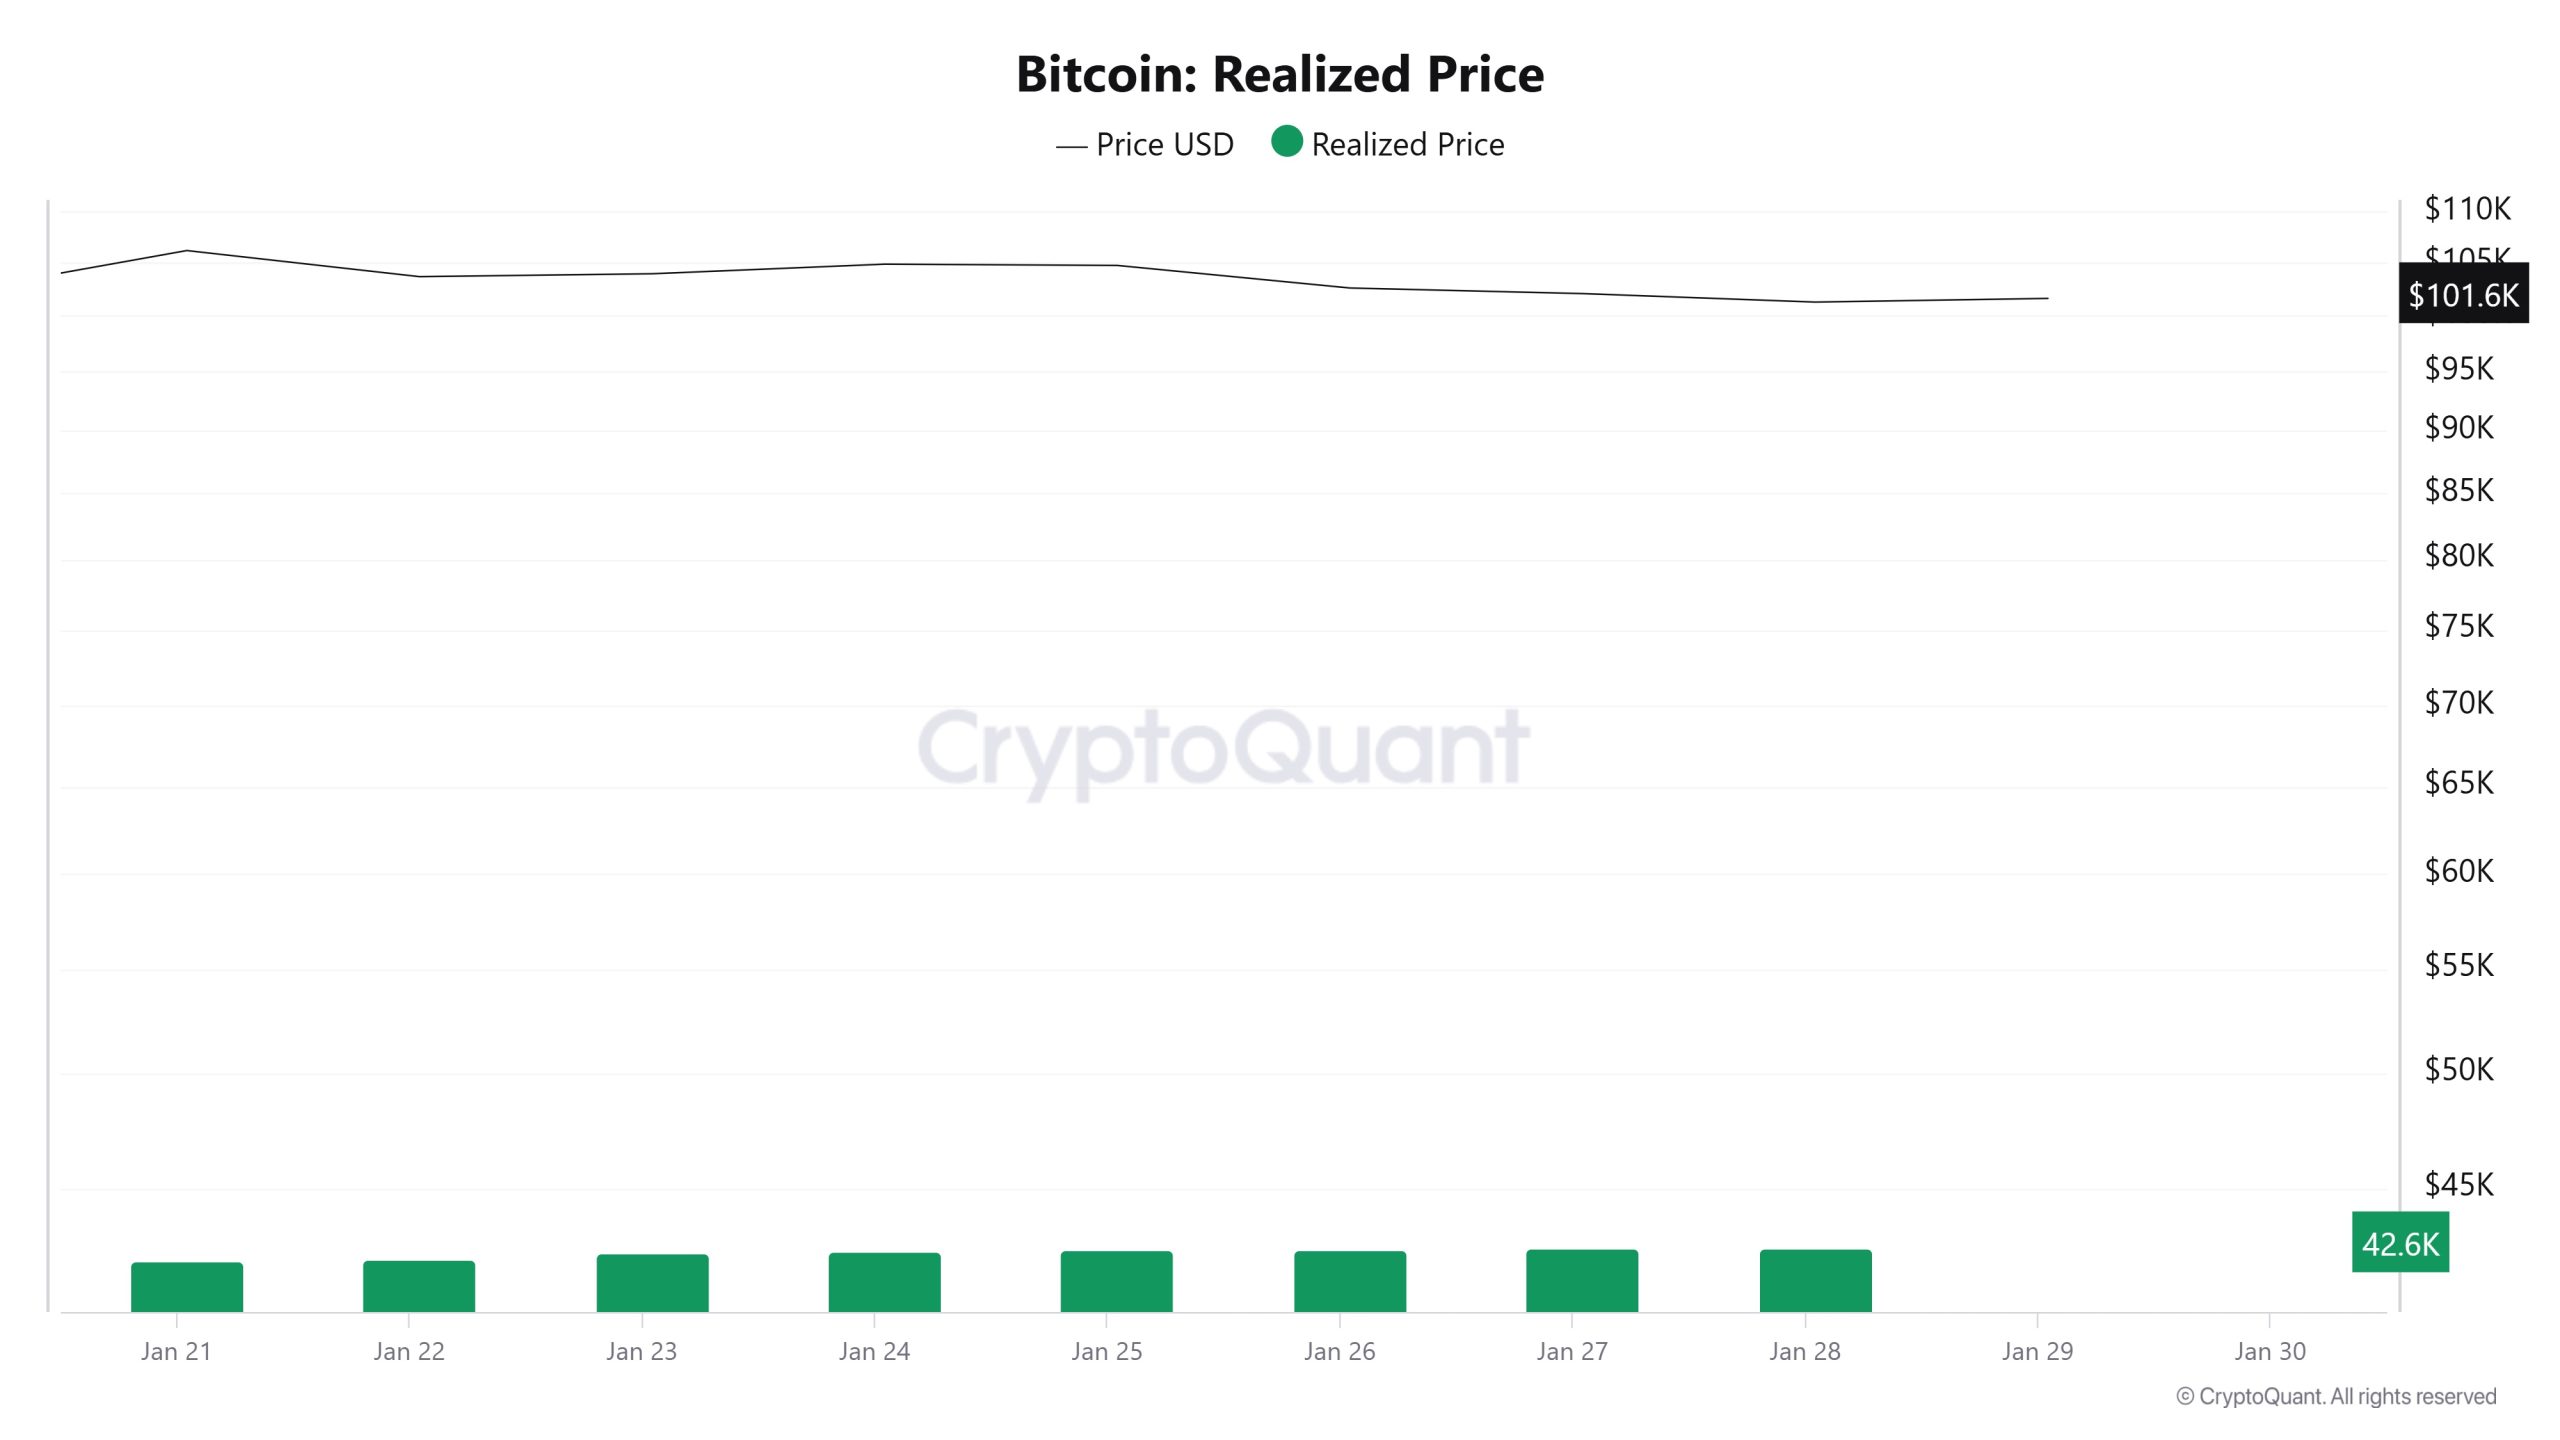
On Janeiro 22nd, the Bitcoin price was 103,659 while the Realized Price was 42,214. As of Janeiro 28, the Bitcoin price was down to 101,275 while the Realized Price was 42,645. Compared to last week, Bitcoin price decreased by 2.30% while Realized Price increased by 1.02%.
Spent Output Profit Ratio (SOPR)
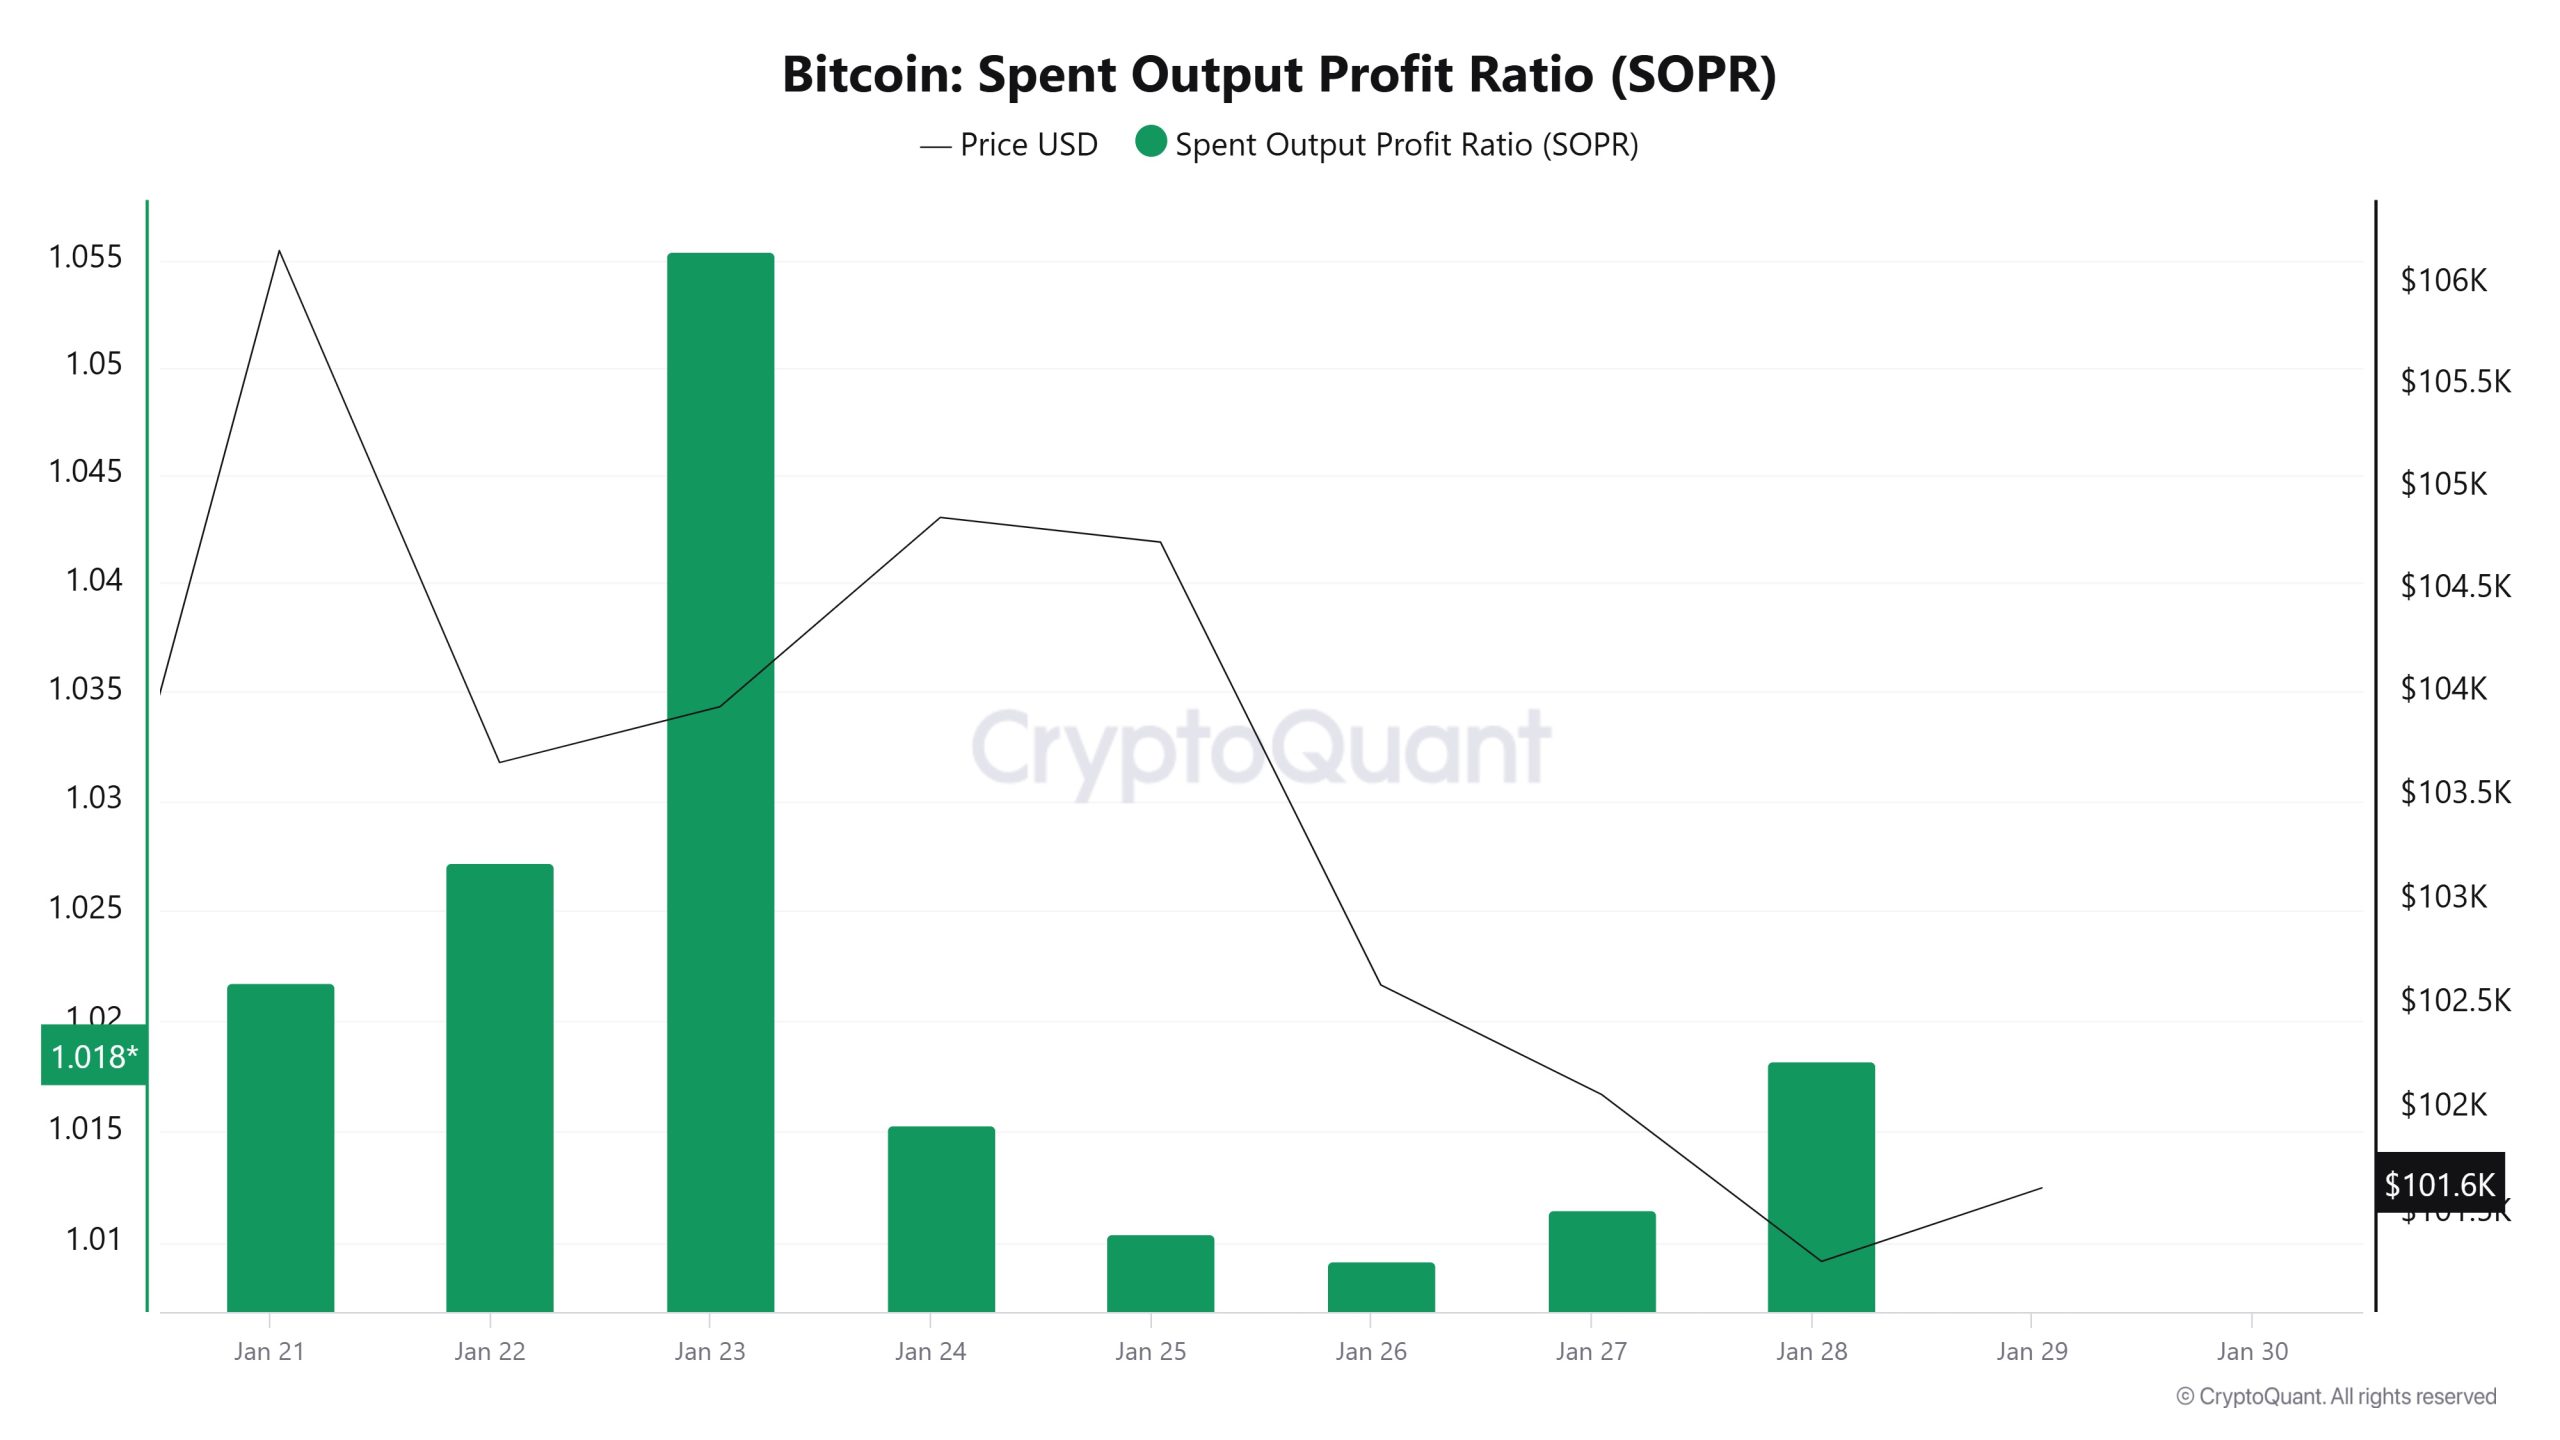
On Janeiro 22, the Bitcoin price was 103,659, while the SOPR metric was 1.02. As of Janeiro 28, the Bitcoin price fell to 101,275 while the SOPR metric dropped to 1.01. Compared to last week, the Bitcoin price has decreased by 2.30% and the SOPR metric has decreased by about 0.98%.
Derivatives
Open Interest
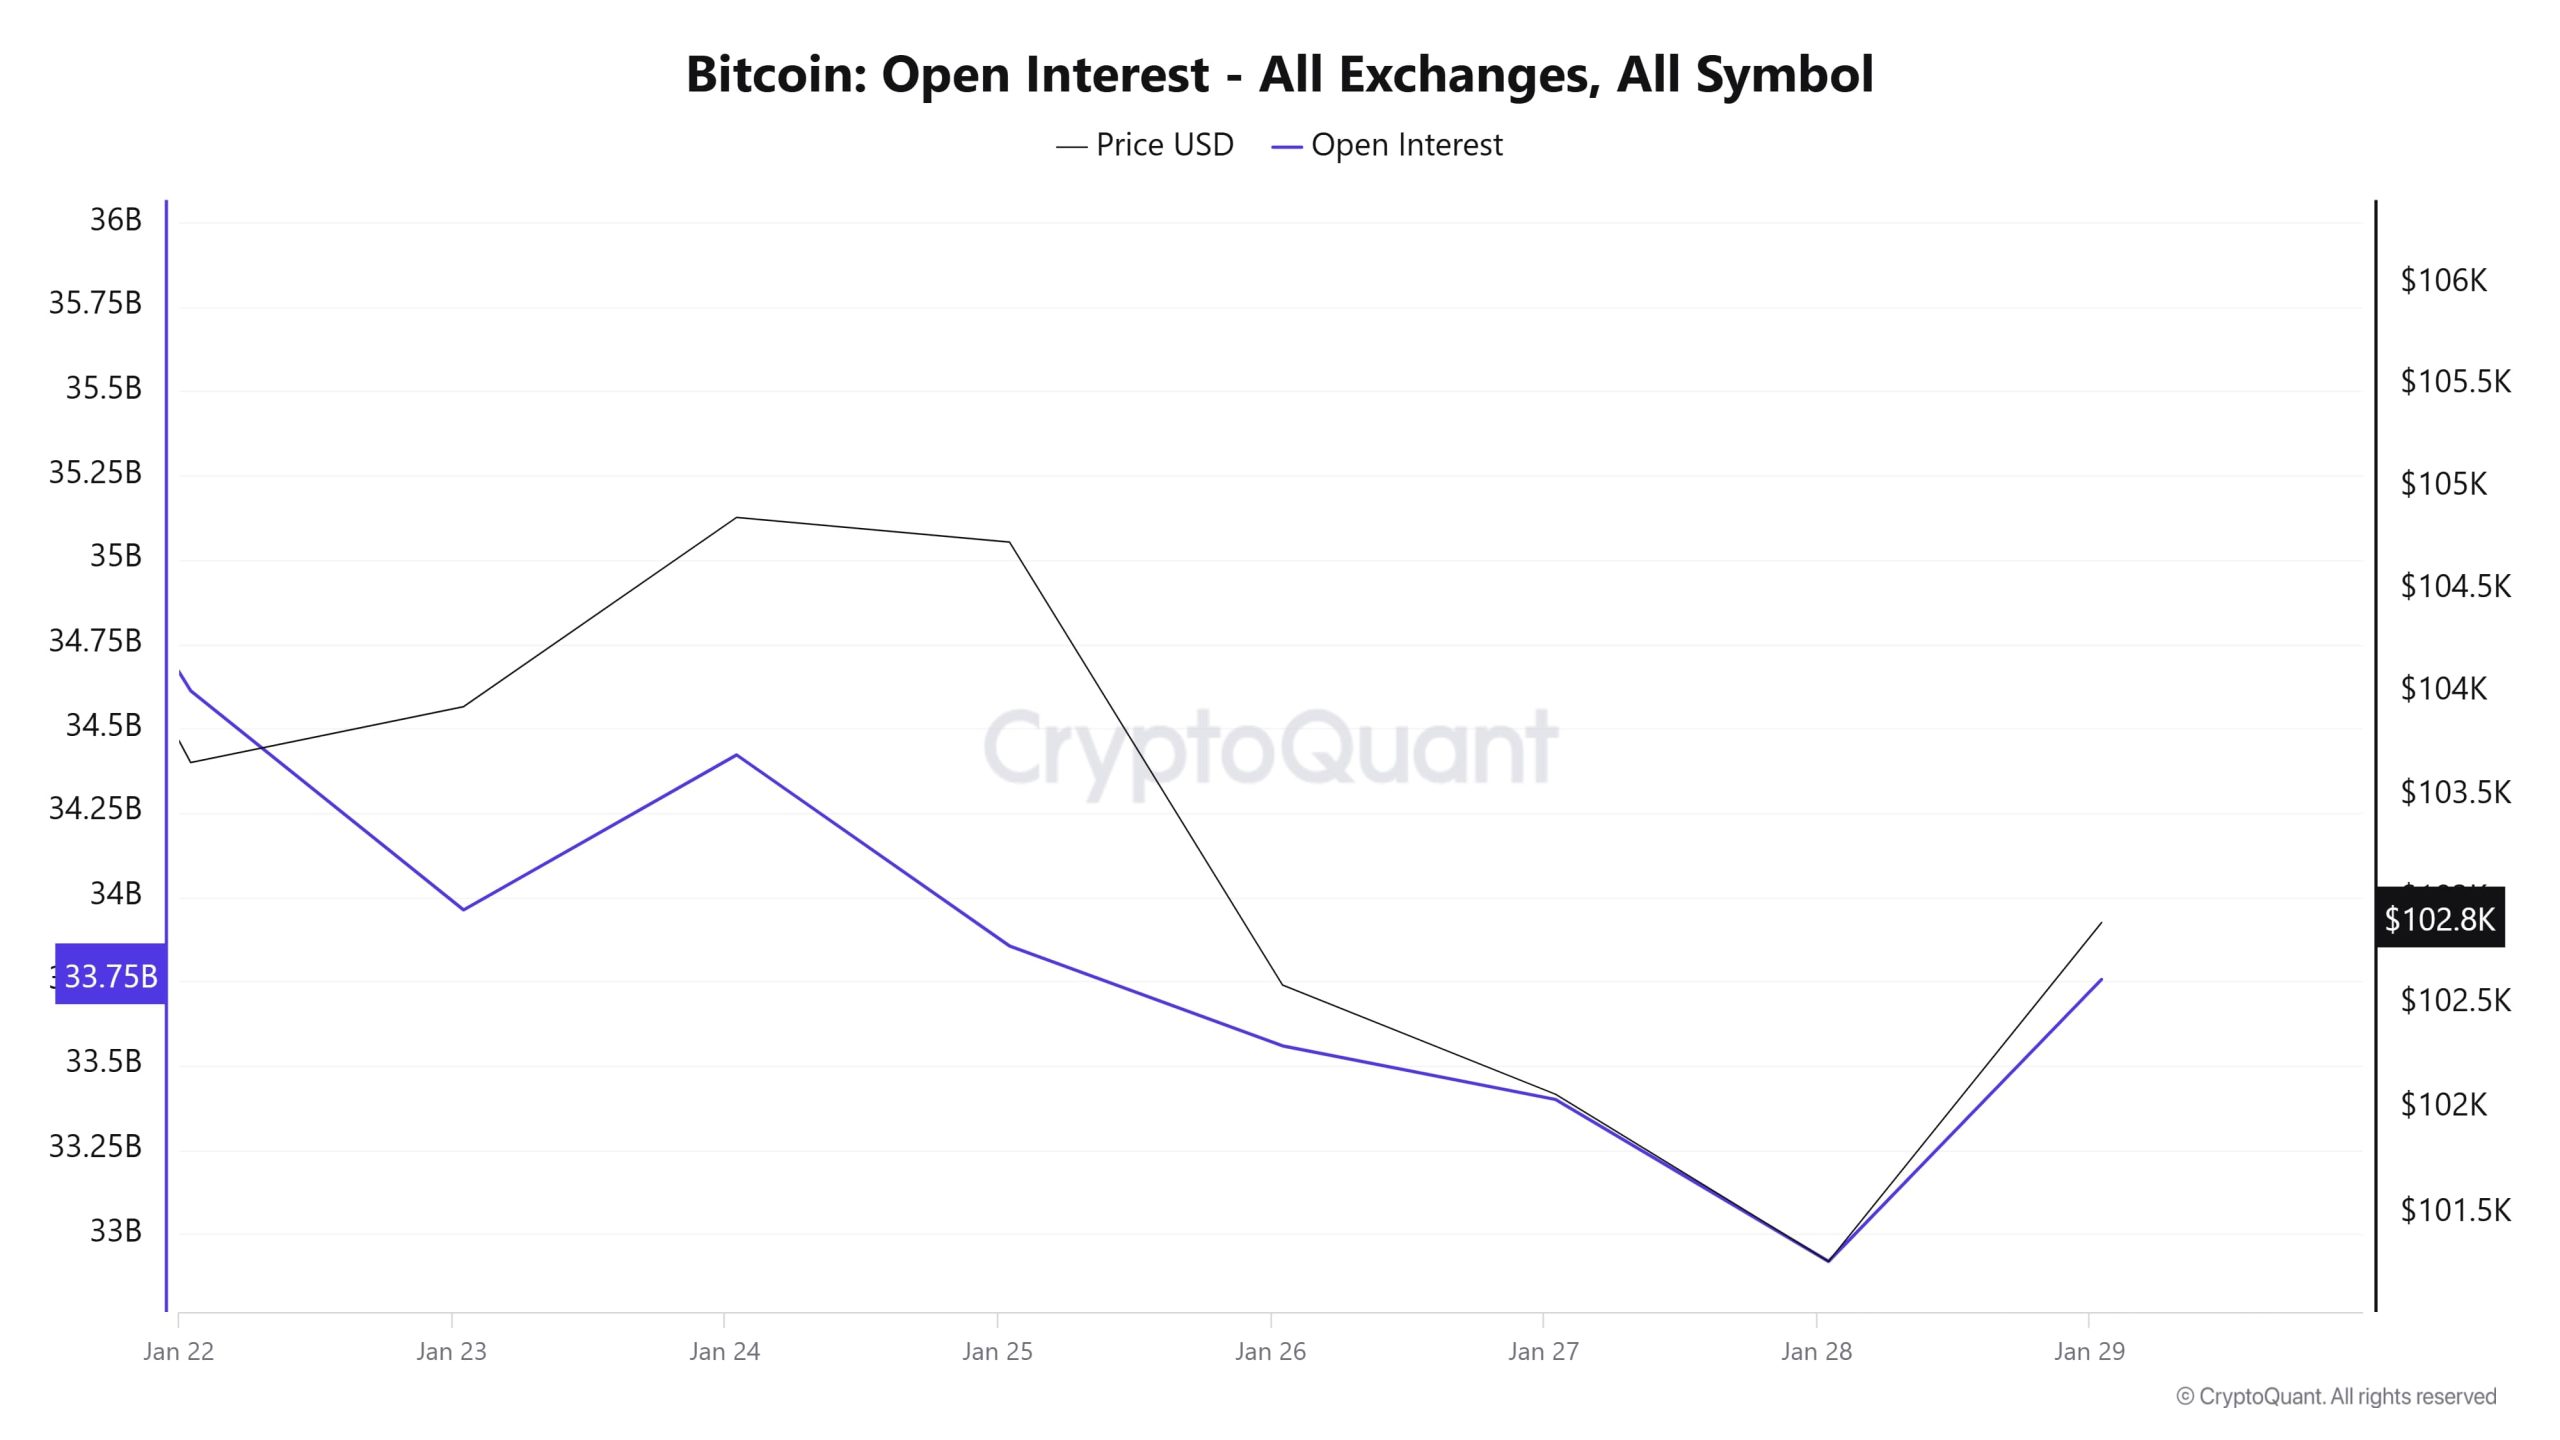 On Janeiro 22, Bitcoin Open Interest was at 34.75 billion. On Janeiro 23, it dropped to around 34 billion. On Janeiro 24 and 25, it started to rise again and rose above $34 billion. During the same period, the price was also moving upwards, and it is seen that new positions were opened in the market. Between Janeiro 26-28, both the price and Open Interest fell sharply. It can be said that large positions were closed or liquidations took place. As of Janeiro 29, Open Interest increased again and recovered along with the price. It seems that there are new entries into the market or investors are repositioning. It is noteworthy that Open Interest and price generally move in parallel. Especially the sharp decline between Janeiro 26-28 suggests that highly leveraged positions were liquidated. With the recovery on Janeiro 29, it can be said that there is a new interest in the market.
Funding Rate
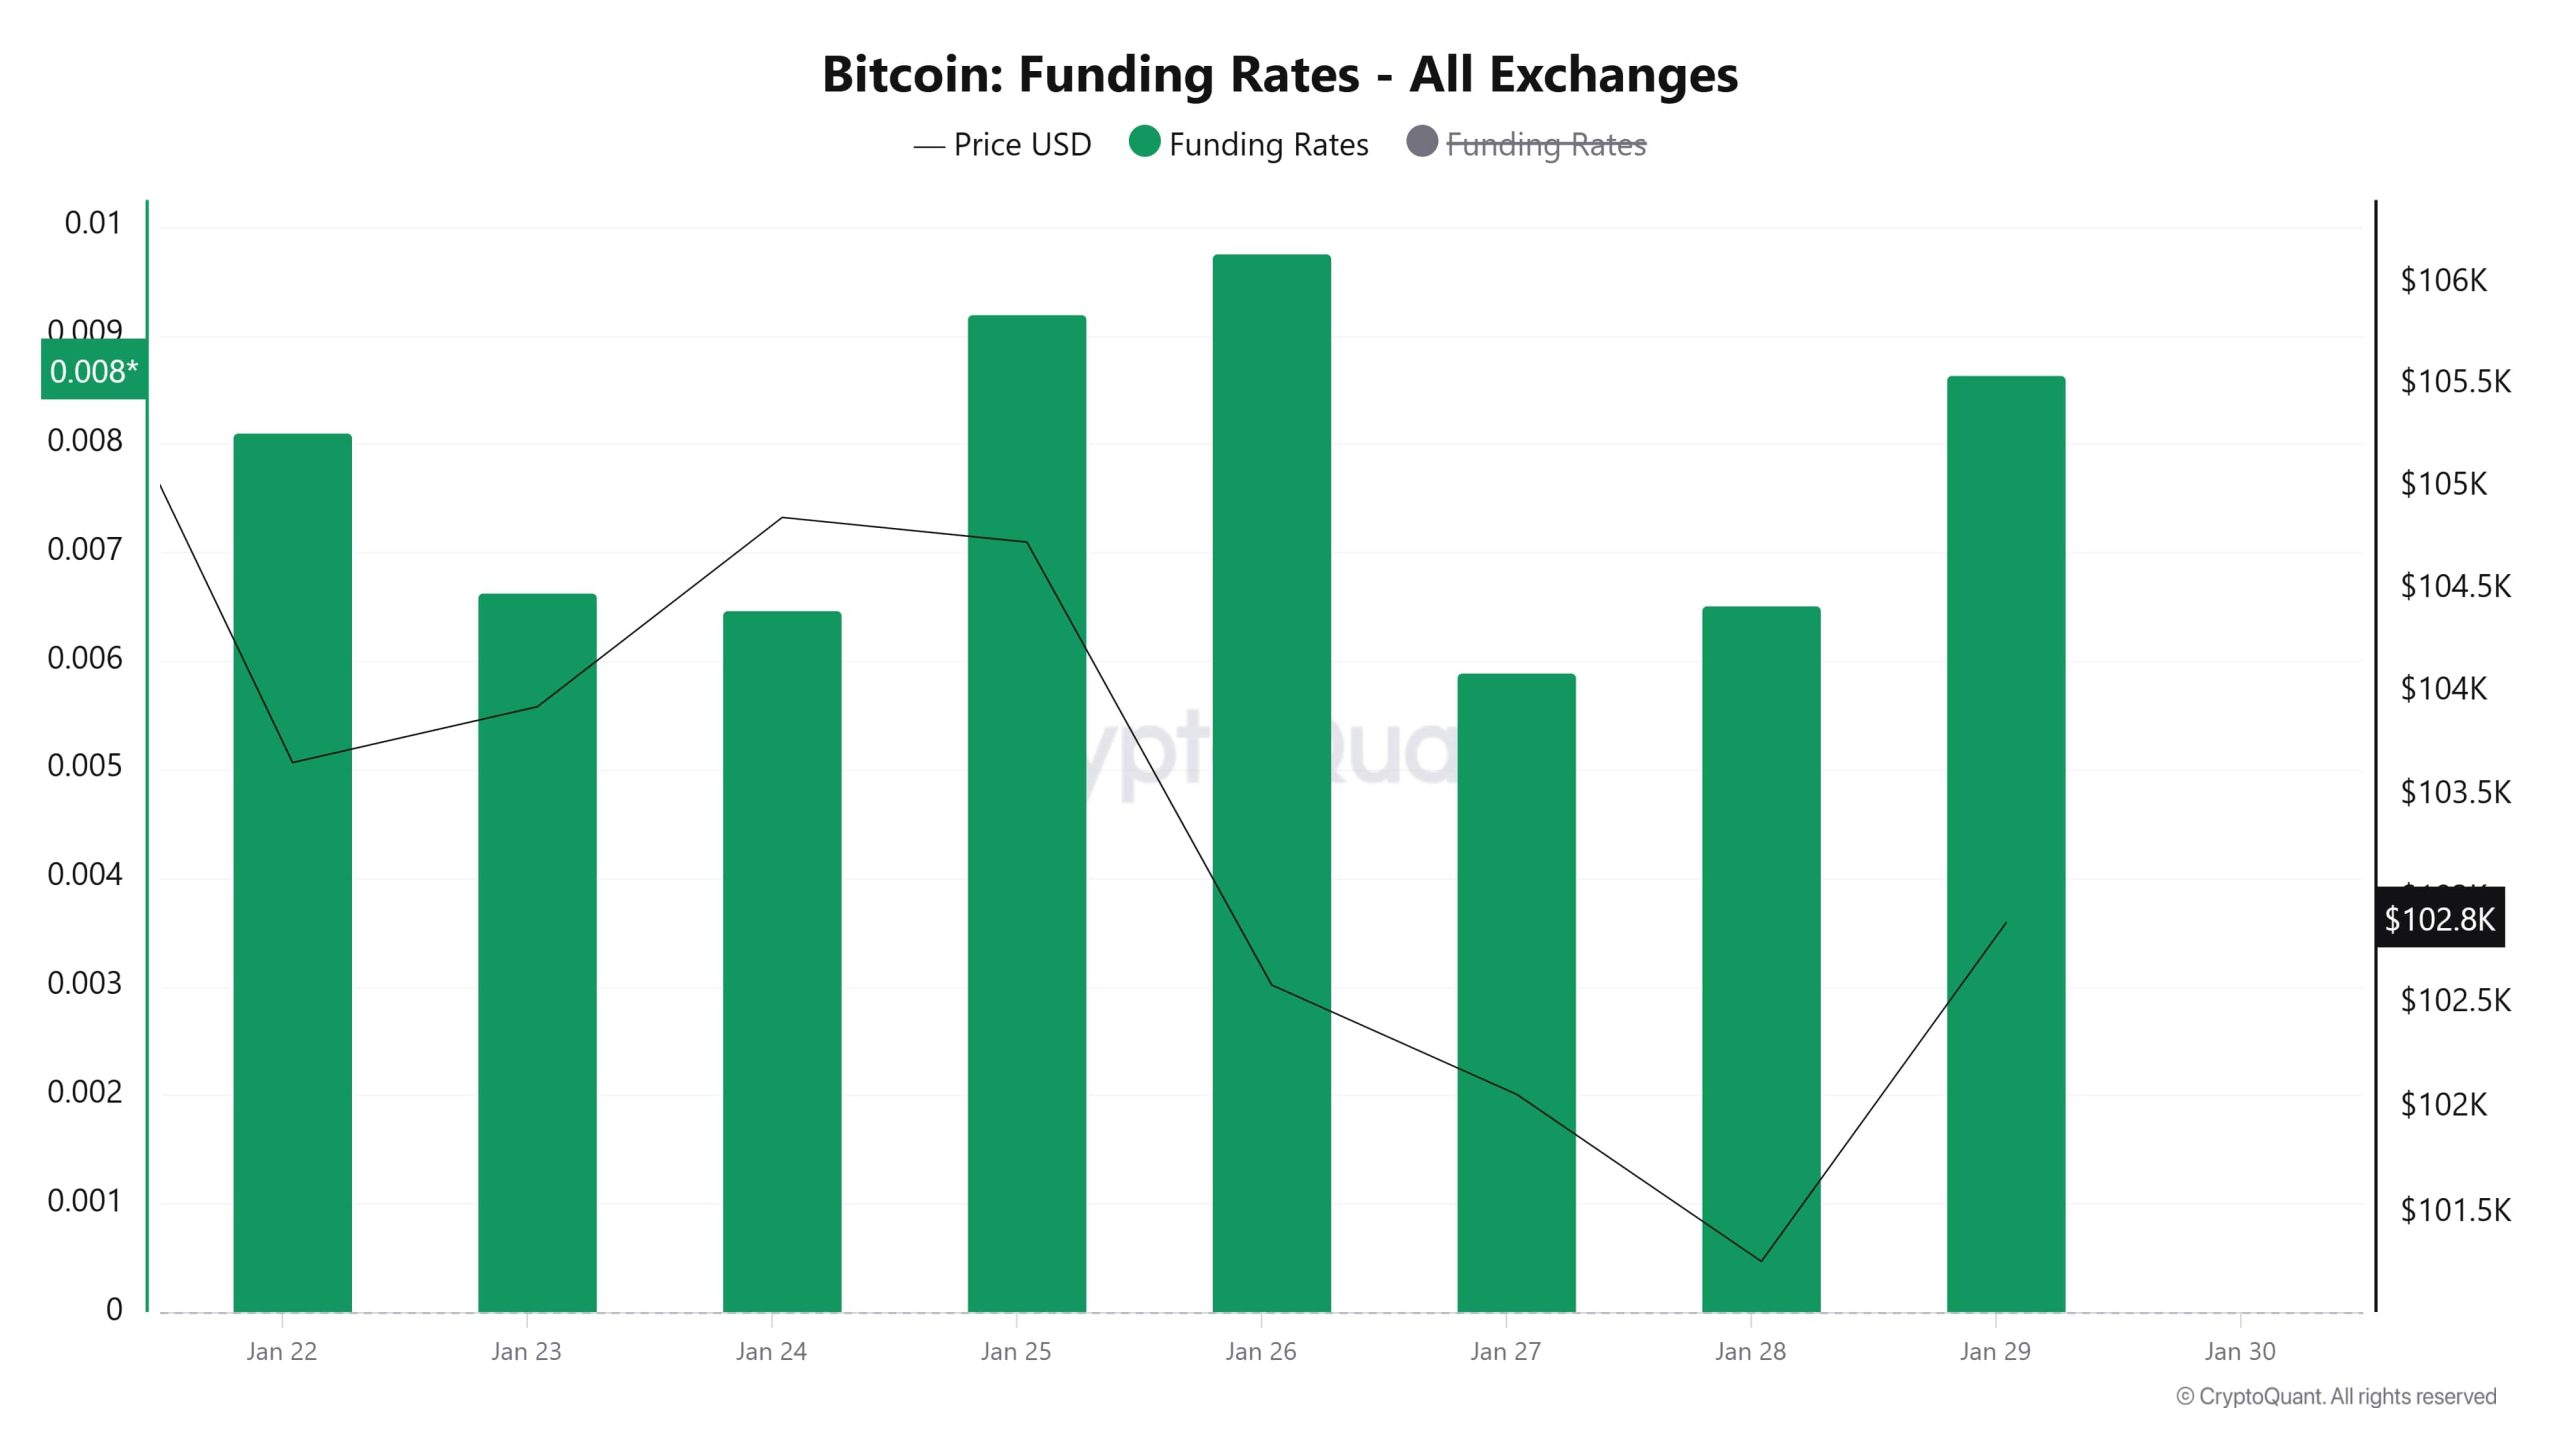
On Janeiro 22nd, the Bitcoin funding rate was at 0.008. There was some decline in the first few days, but it recovered and moved upwards as of Janeiro 24. On Janeiro 25 and 26, the funding rate reached its highest levels and approached 0.01. During this period, the market was dominated by long positions. After Janeiro 26, the funding rate fell sharply along with the price. On Janeiro 28, the Bitcoin price hit a low and then rebounded quickly on Janeiro 29. In general, it can be said that there is a funding rate fluctuation in line with price movements. In particular, the decline between Janeiro 26-28 may indicate the liquidation of leveraged long positions. The rise on Janeiro 29 suggests that the market is showing long interest again.
“Funding Rate Image to be Added”
Long & Short Liquidations
This week, when BTC fell from 106,500 to 97,700, mainly long positions were liquidated. From Janeiro 22 to today, $125.73 million worth of long positions have been liquidated. In the same time period, 47.24 million dollars worth of short positions have been liquidated.
| Date | Long Amount (Million $) | Short Amount (Million $) |
|---|---|---|
| Janeiro 22 | 10.15 | 3.26 |
| Janeiro 23 | 22.90 | 15.83 |
| Janeiro 24 | 6.20 | 4.43 |
| Janeiro 25 | 1.25 | 2.92 |
| Janeiro 26 | 9.25 | 1.21 |
| Janeiro 27 | 67.86 | 11.90 |
| Janeiro 28 | 8.12 | 7.69 |
| Total | 125.73 | 47.24 |
Supply Distribution
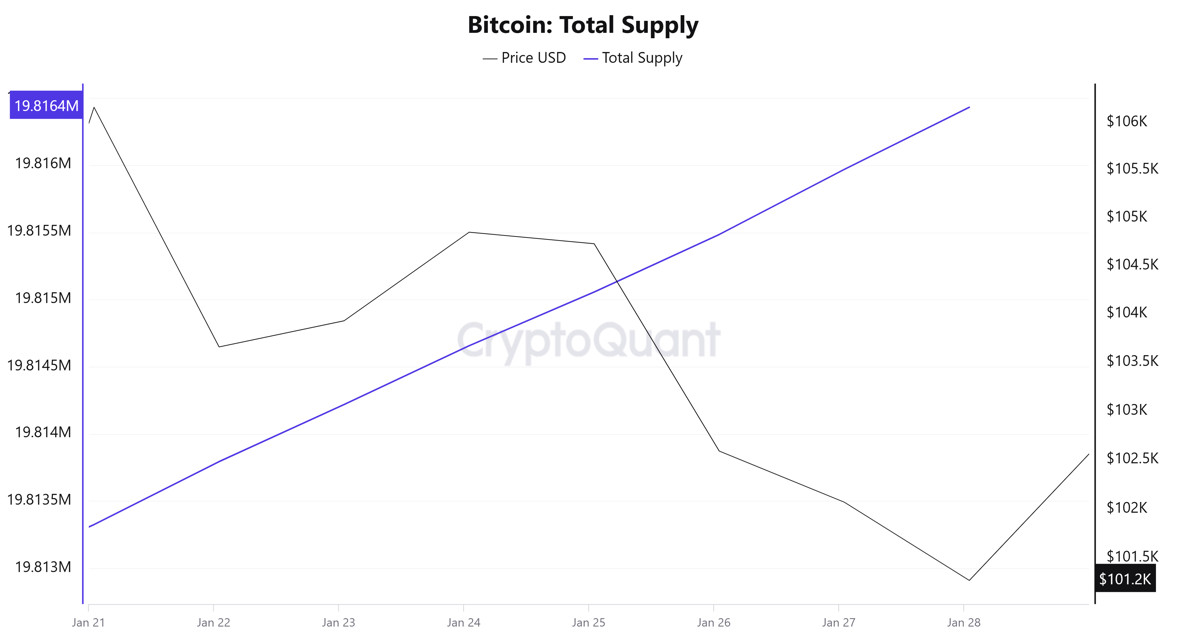
Total Supply: It reached 19,813,324 units, up about 0.0157% from last week.
New Supply: The amount of BTC produced this week was 3,106.
Velocity: Continued decline compared to the previous week.
| Wallet Category | 21.01.2025 | 28.01.2025 | Change (%) |
|---|---|---|---|
| < 0.1 BTC | 1.590% | 1.592% | 0.13% |
| 0.1 – 1 BTC | 5.409% | 5.408% | -0.02% |
| 1 – 100 BTC | 32.266% | 32.316% | 0.15% |
| 100 – 1k BTC | 22.646% | 22.918% | 1.20% |
| 1k – 100k BTC | 34.818% | 34.443% | -1.08% |
| > 100k BTC | 3.270% | 3.269% | -0.03% |
When we look at the Bitcoin supply distribution, there was a slight increase of 0.13% in the “< 0.1 BTC” category, while there was a very small decrease of 0.02% in the “0.1 – 1 BTC” category. The “1 – 100 BTC” category saw an increase of 0.15%, with the largest change occurring in the “100 – 1k BTC” category with an increase of 1.20%, indicating that the number of wallets at this level has grown significantly. In contrast, there was a 1.08% decrease in the “1k – 100k BTC” category, indicating that some of the large investors reduced their holdings. The “>100k BTC” category saw a small decline of 0.03%. In general, medium-sized investors (100 – 1k BTC) were more active in the market, while large investors (1k+ BTC) sold some.
Exchange Reserve
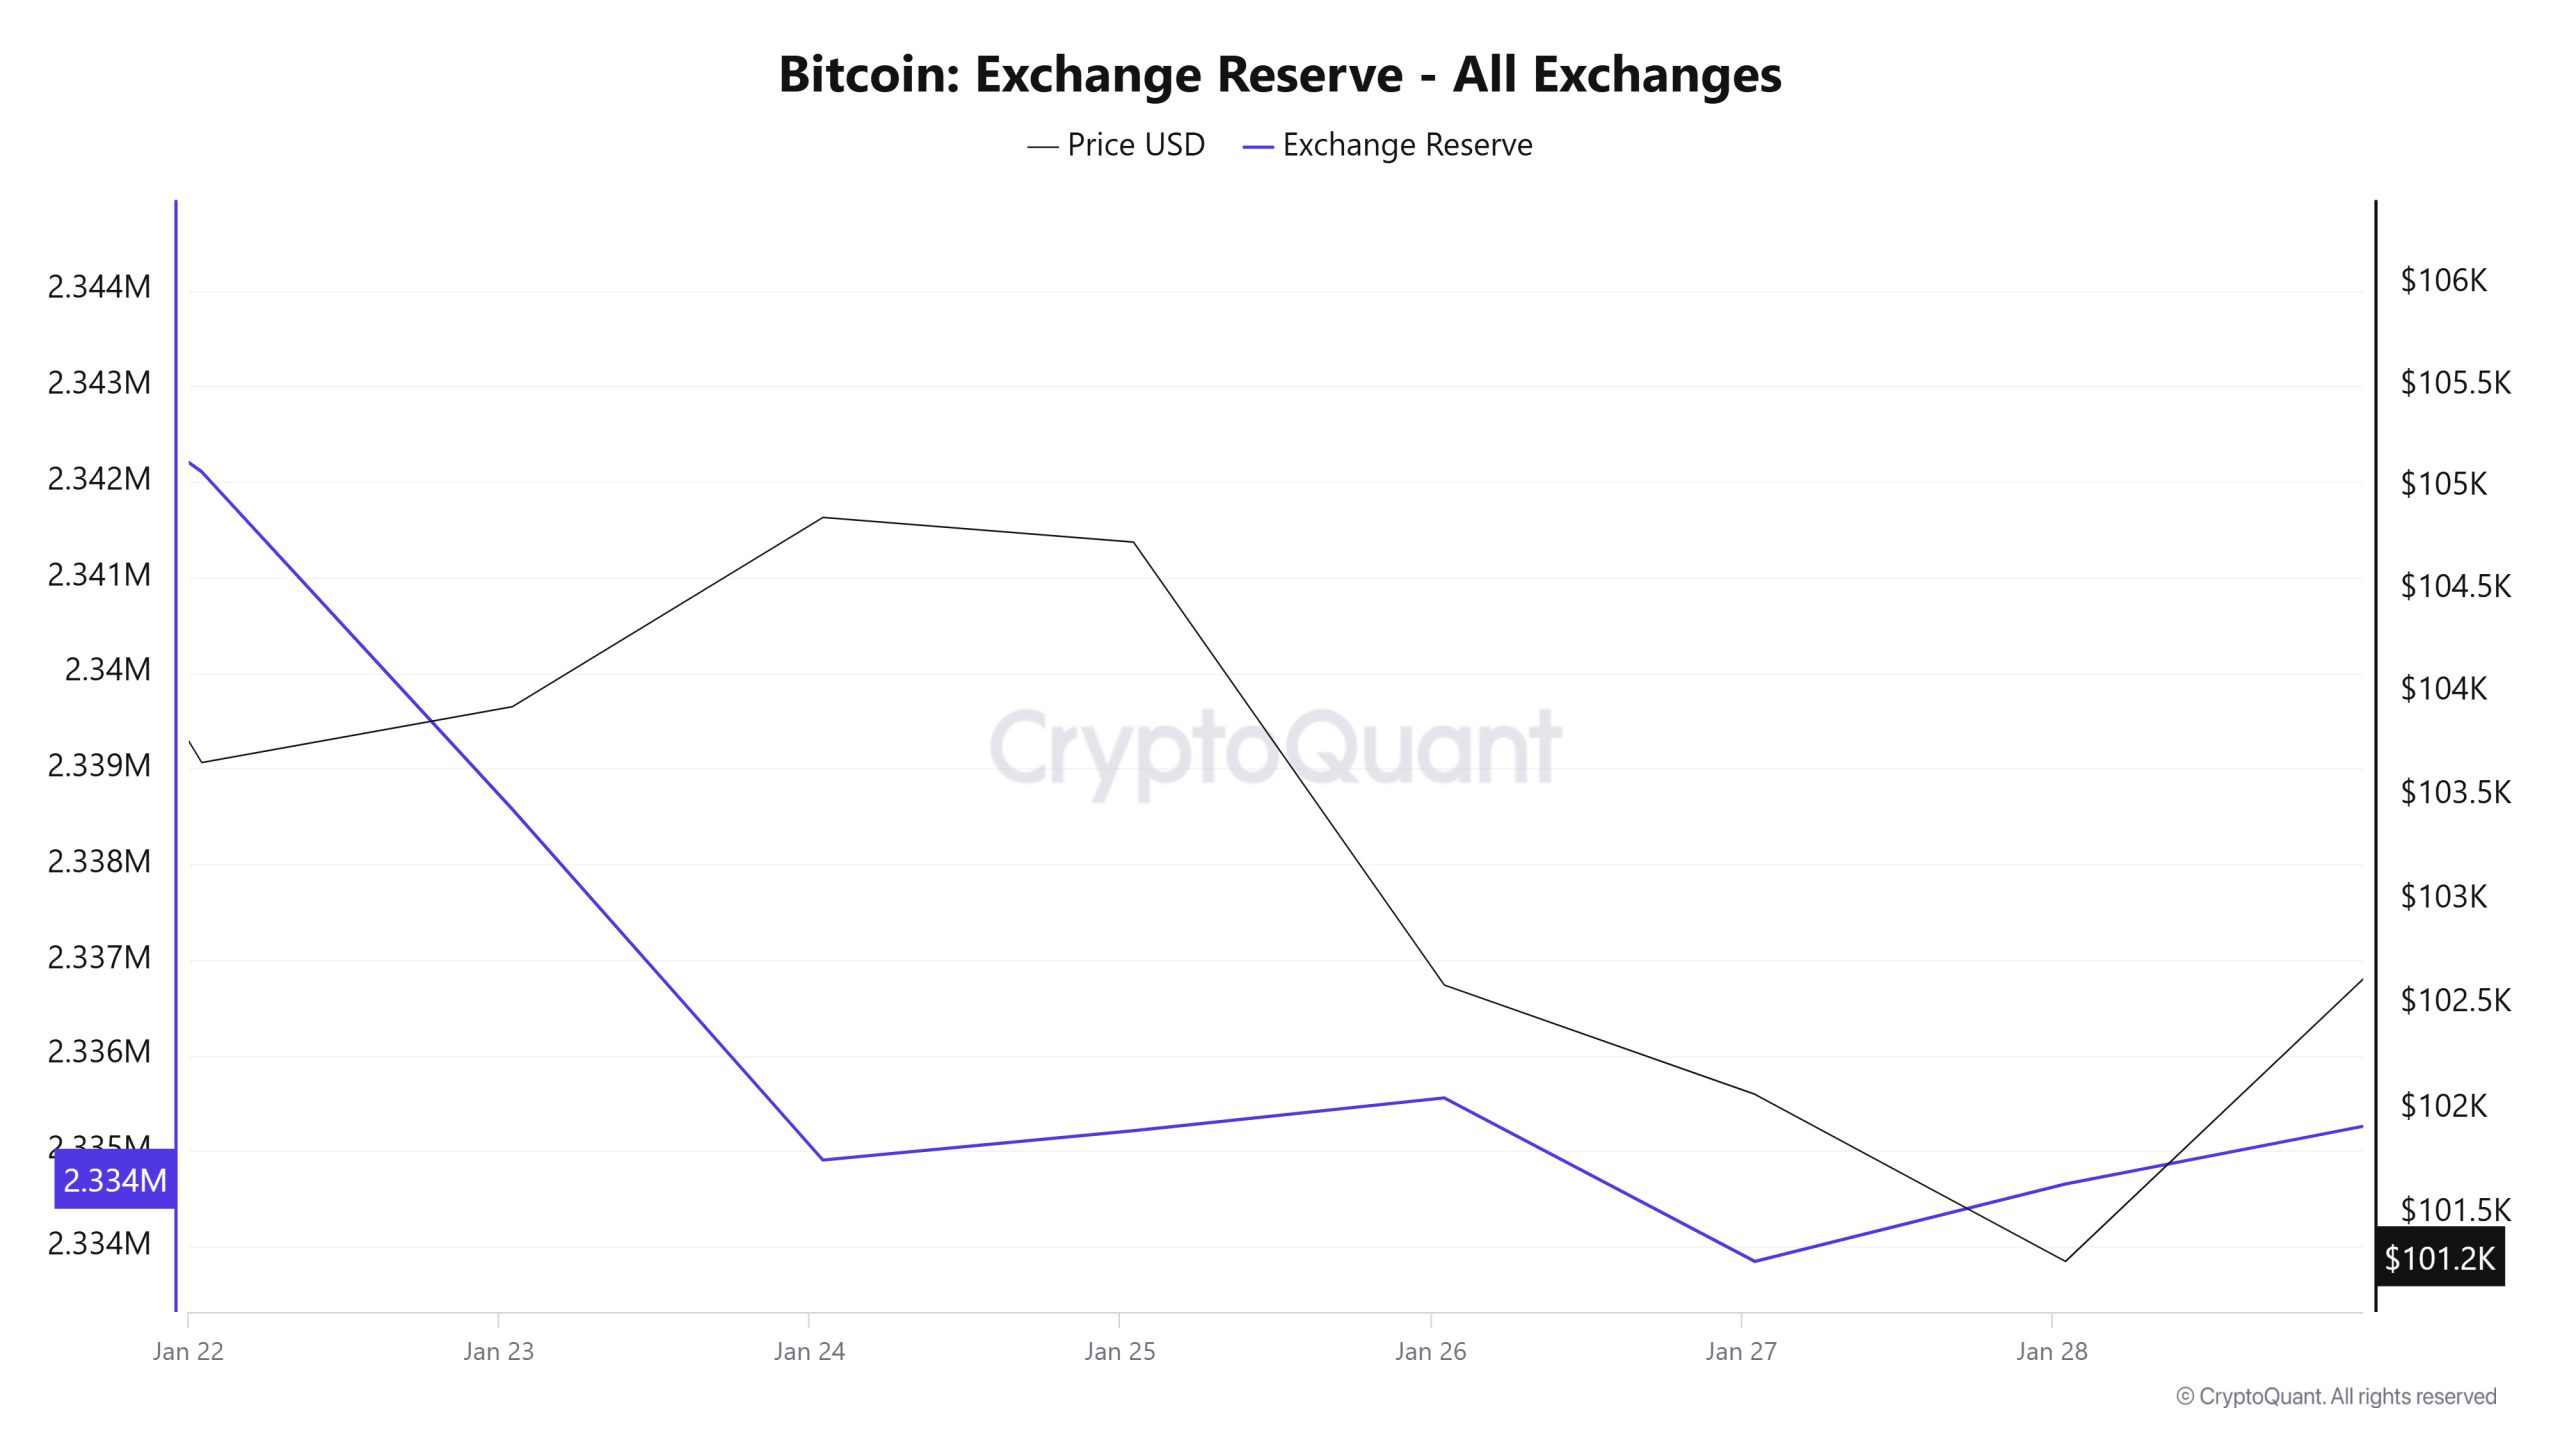
Between Janeiro 22-28, 2025, Bitcoin reserves on exchanges decreased from 2,342,103 BTC to 2,334,654 BTC. In total, there was a net outflow of 7,449 BTC during this period, and exchanges’ Bitcoin reserves decreased by 0.32%. The Bitcoin price fell by approximately 2.3% during this period. Bitcoin, which closed at $103,660 on Janeiro 22, 2025, closed at $101,275 on Janeiro 28, 2025.
| Date | 22-Jan | 23-Jan | 24-Jan | 25-Jan | 26-Jan | 27-Jan | 28-Jan |
|---|---|---|---|---|---|---|---|
| Exchange Inflow | 44,865 | 44,790 | 37,215 | 16,254 | 13,334 | 40,587 | 30,045 |
| Exchange Outflow | 47,179 | 48,321 | 40,884 | 15,947 | 12,991 | 42,297 | 29,235 |
| Exchange NetFlow | -2,314 | -3,530 | -3,669 | 307 | 343 | -1,711 | 811 |
| Exchange Reserve | 2,342,103 | 2,338,573 | 2,334,904 | 2,335,211 | 2,335,554 | 2,333,843 | 2,334,654 |
| BTC Price* | 103,660 | 103,930 | 104,851 | 104,731 | 102,589 | 102,068 | 101,275 |
Fees and Revenues
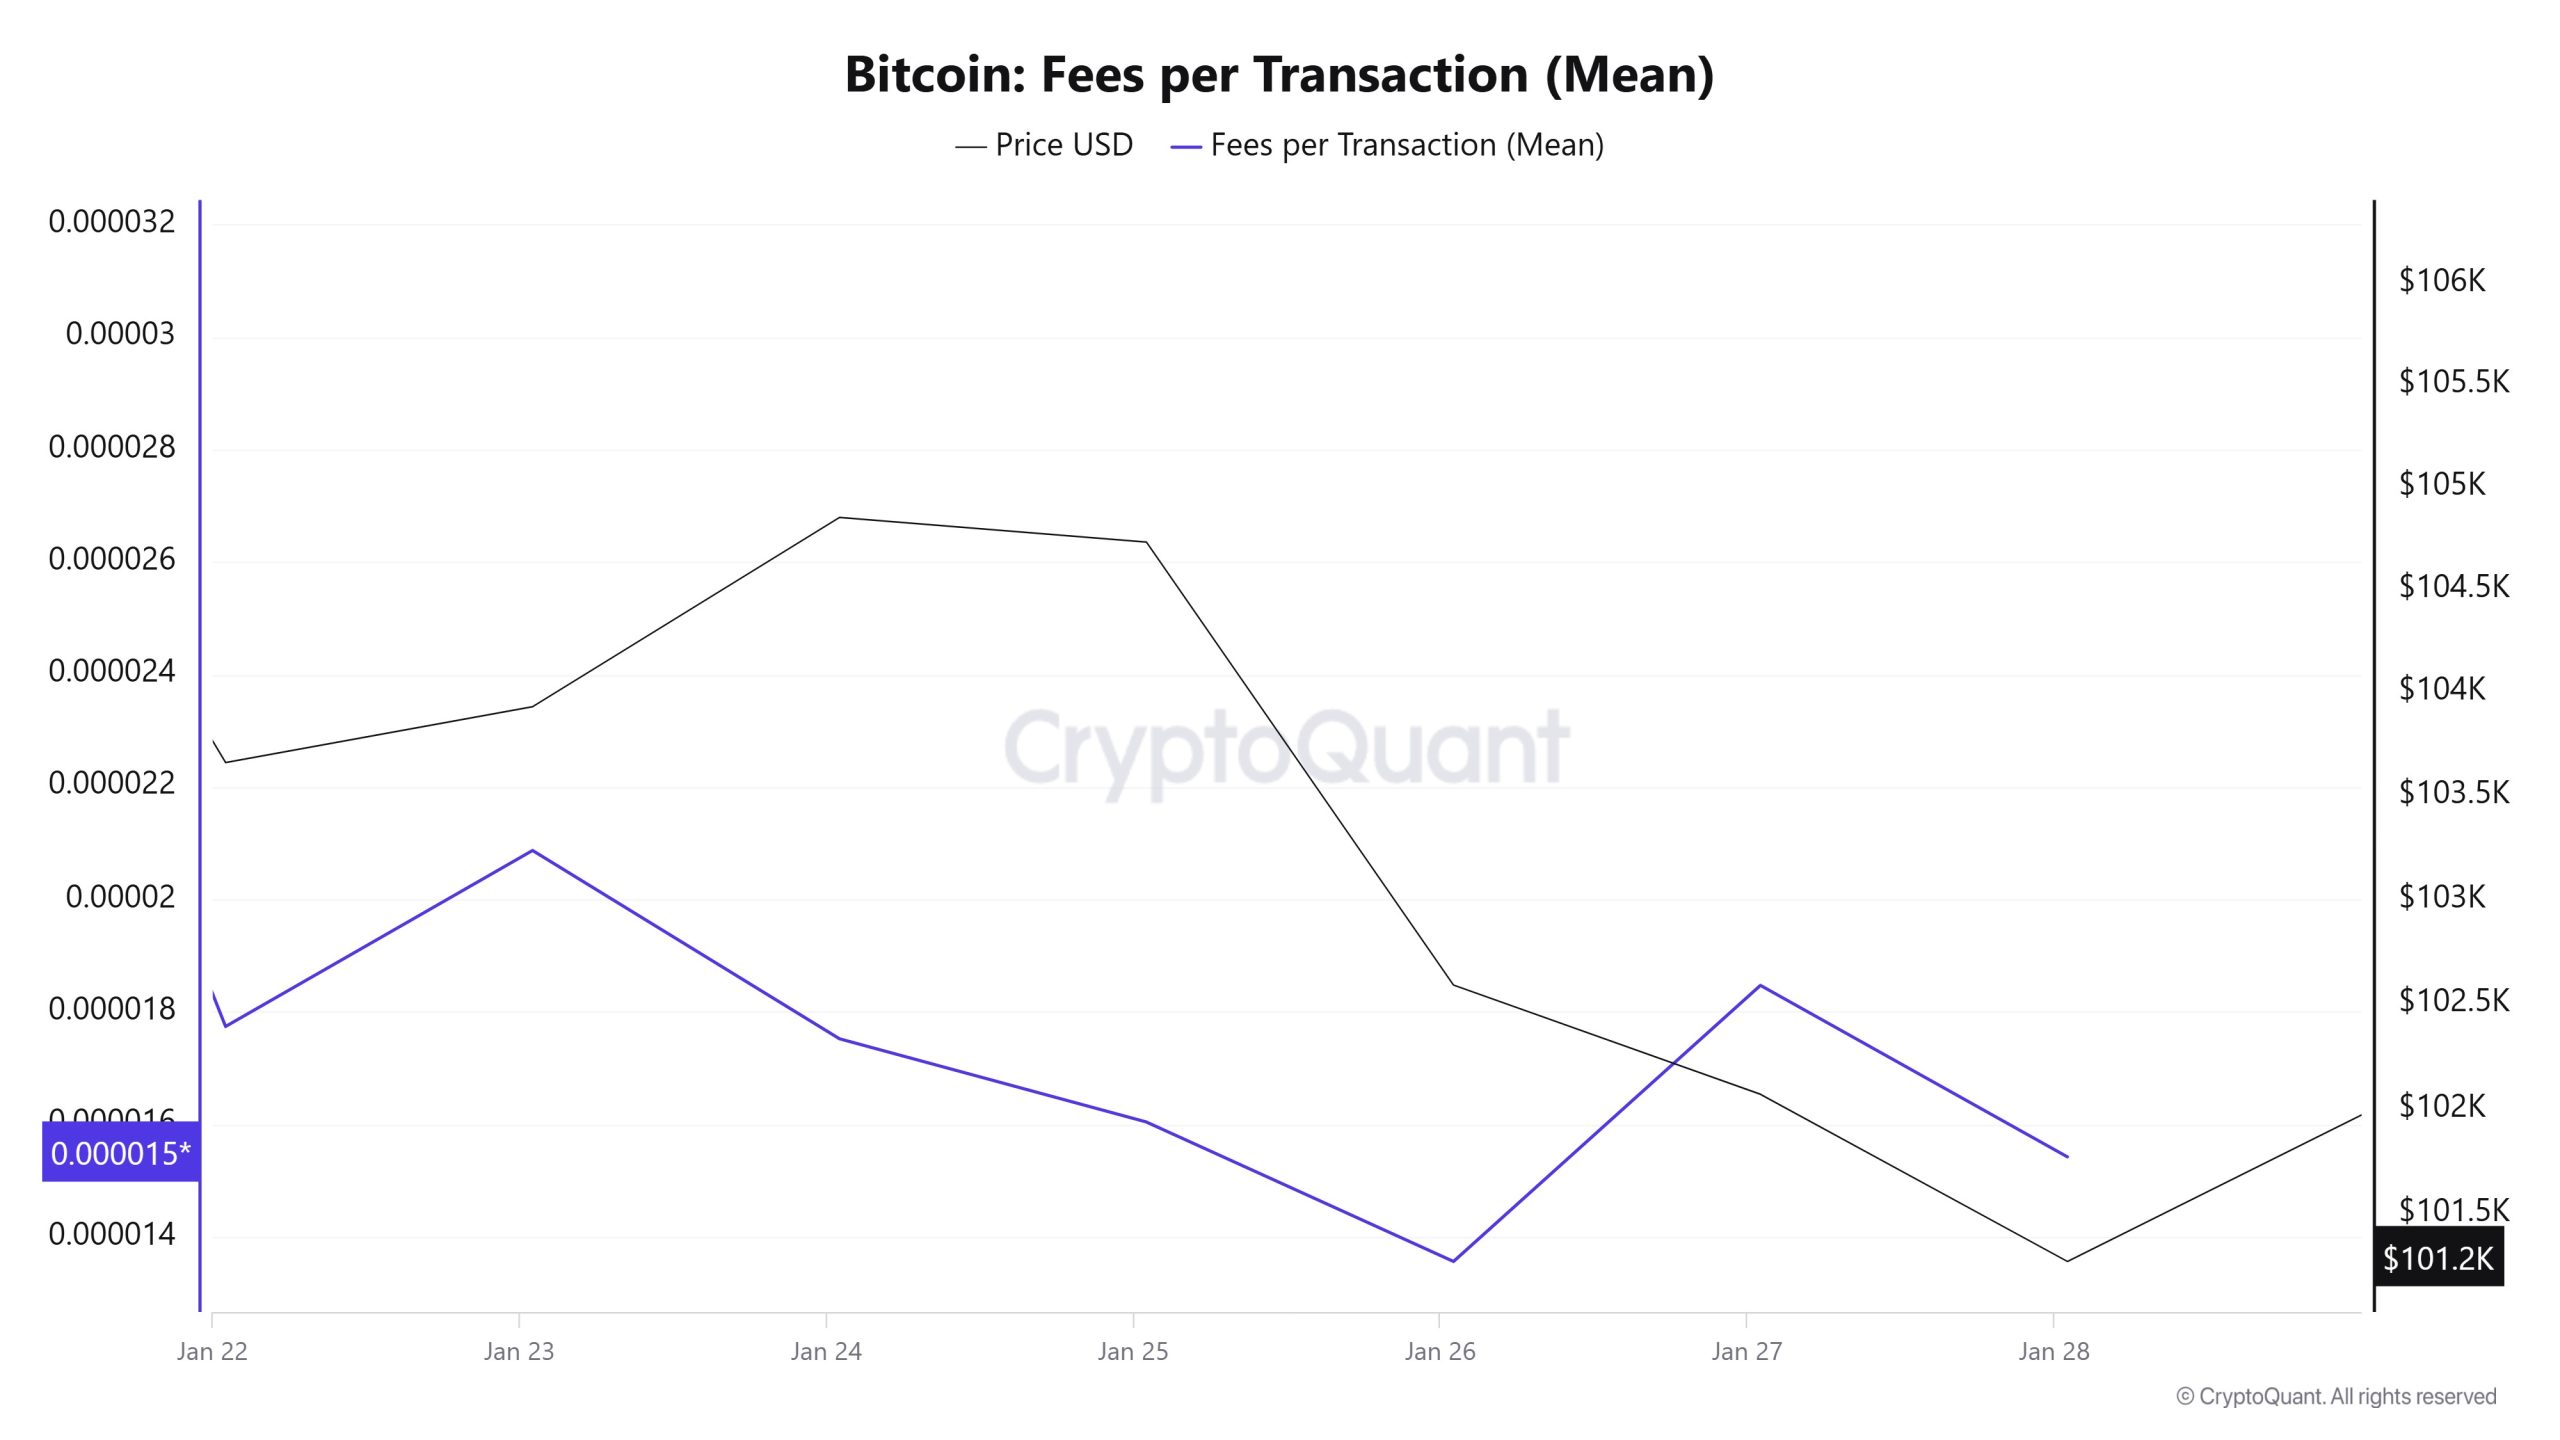
Analysing Bitcoin Fees per Transaction (Mean) data between Janeiro 22-28, it was observed that this value was at 0.00001774 on Janeiro 22, the first day of the week. Until Janeiro 23, Fees per Transaction (Mean) value, which followed a parallel course with Bitcoin price, reached the highest level of the week with 0.00002087 on Janeiro 23.
From this date onwards, a downward trend was observed until Janeiro 26, reaching a low of 0.00001356 on Janeiro 26, reaching the lowest level of the week. In the following days, Fees per Transaction (Mean) also increased with the increasing volatility in Bitcoin price.
Accordingly, on Janeiro 28, the last day of the weekly period, Fees per Transaction (Mean) ended at 0.00001542.
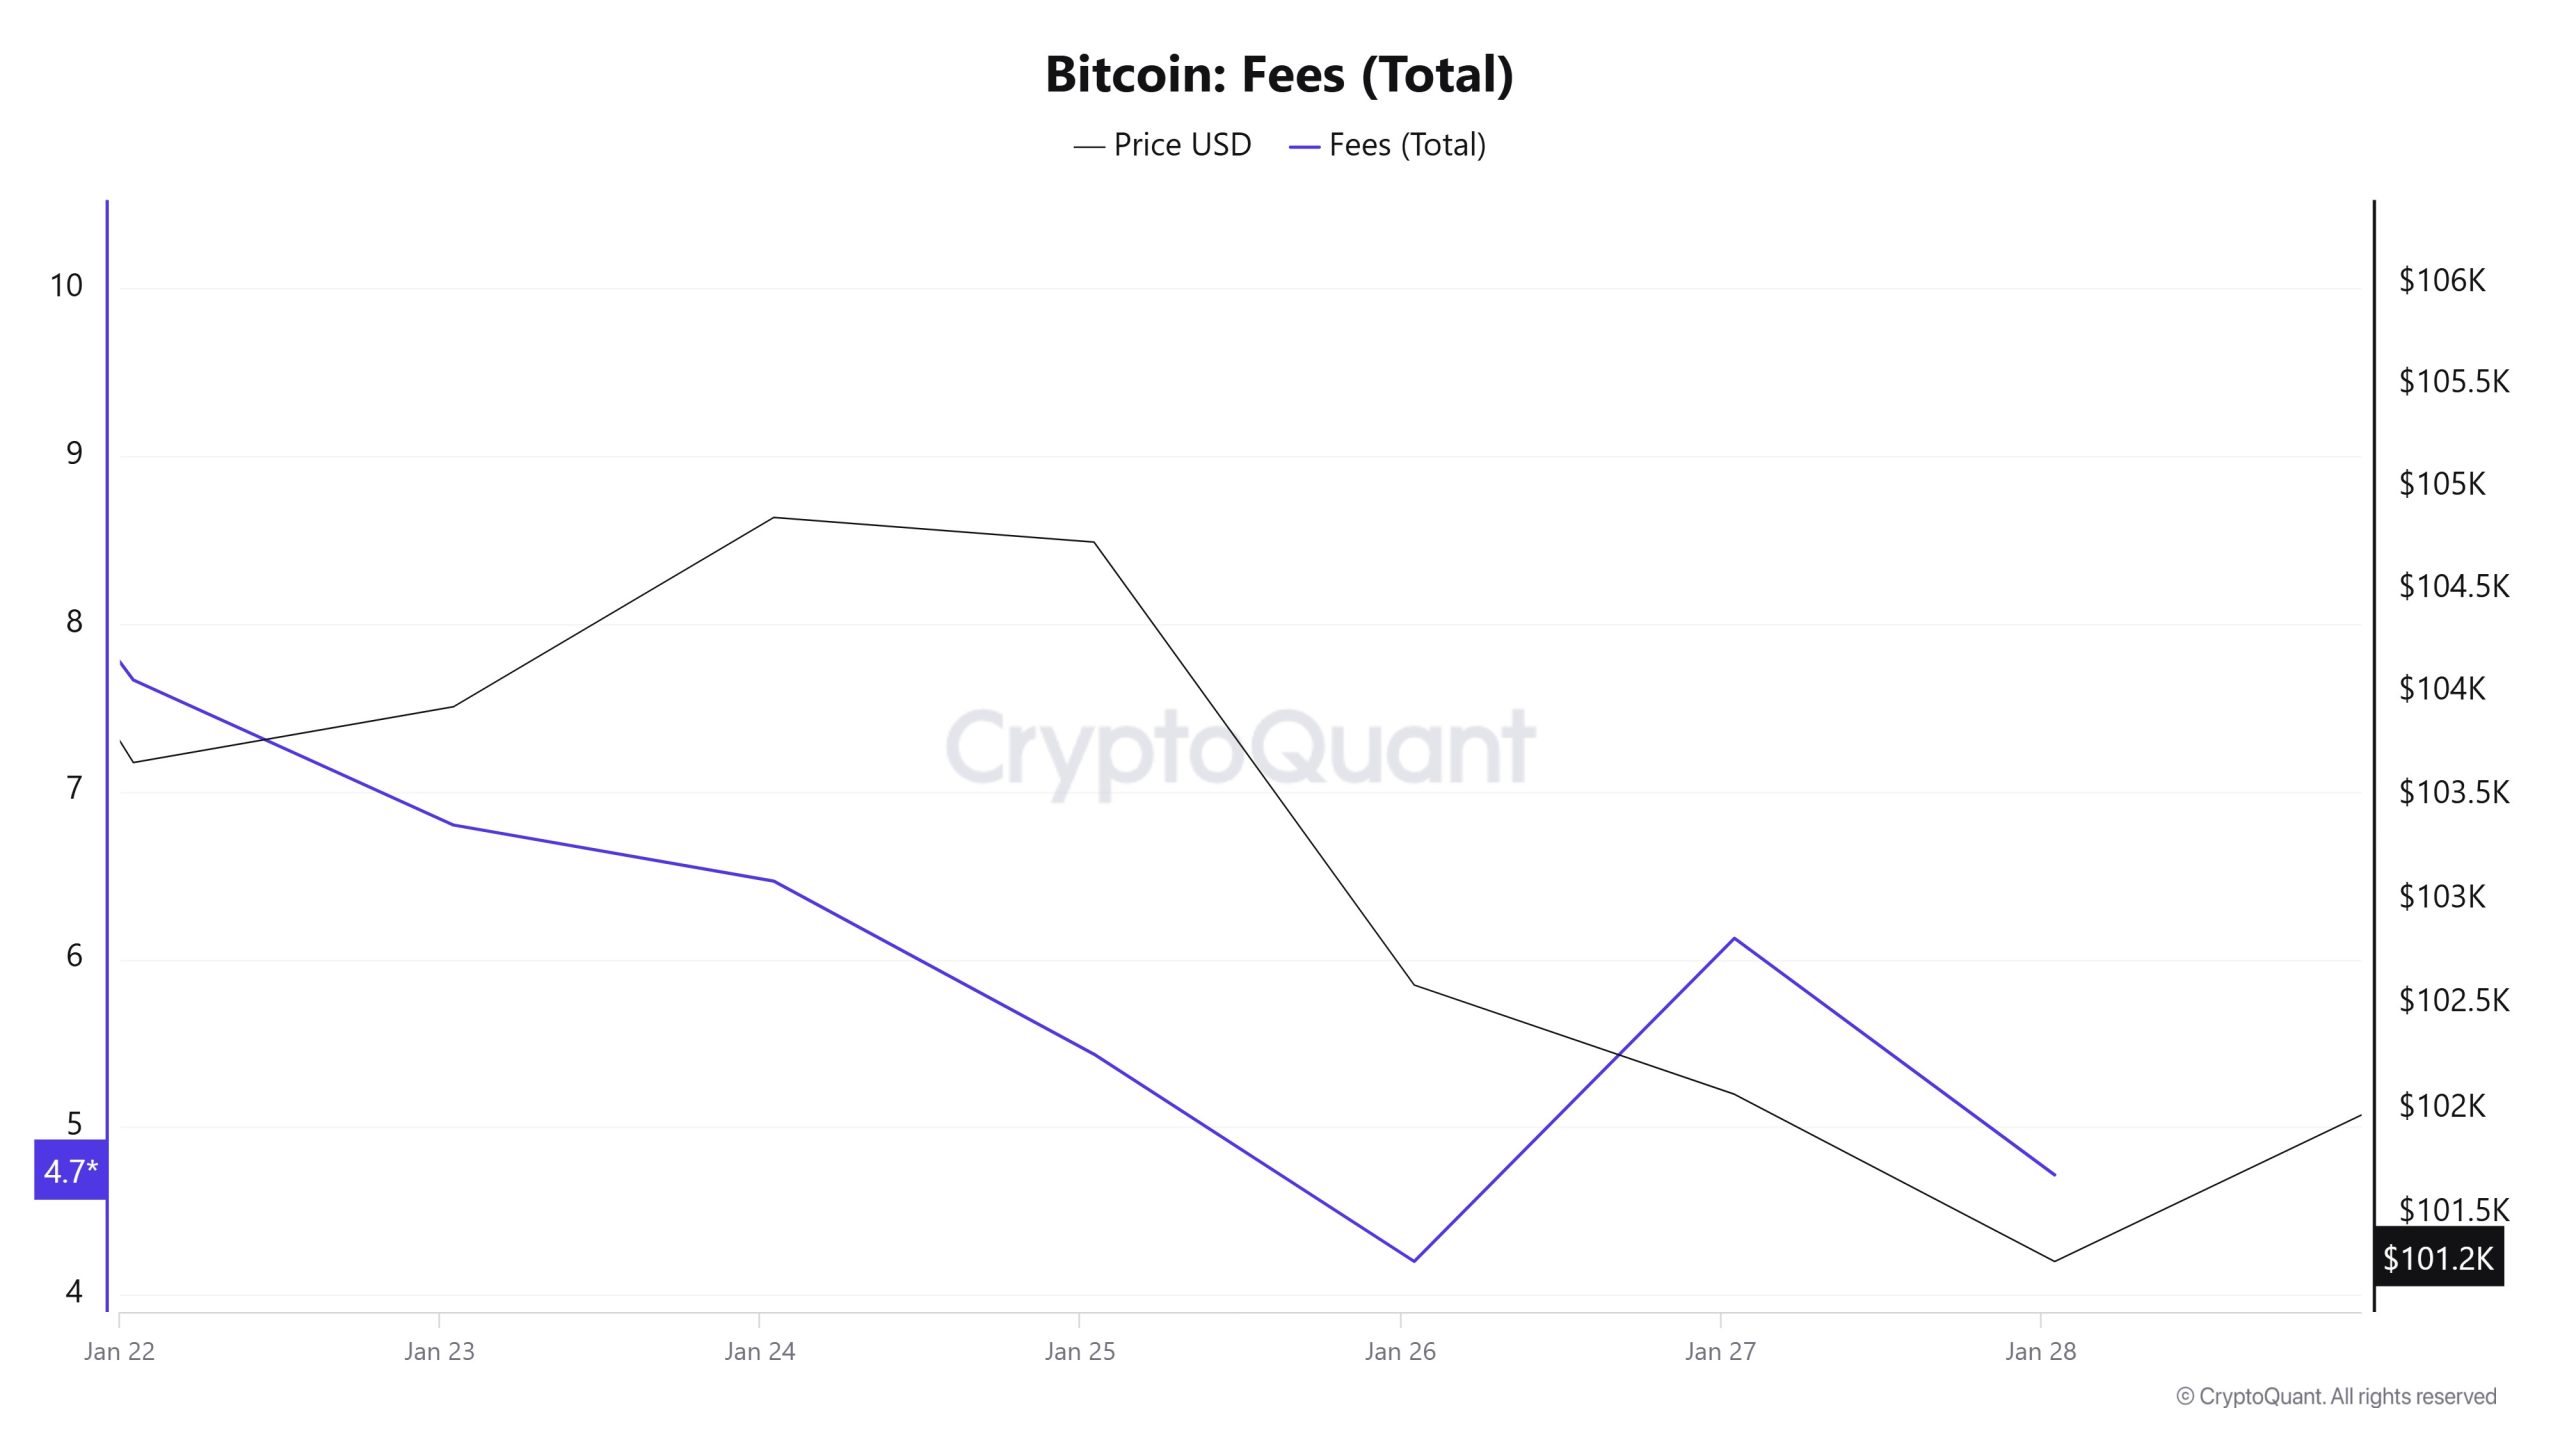
Similarly, when the Bitcoin Fees (Total) data between Janeiro 22-28 are analyzed, it is observed that the Bitcoin Fees (Total) value, which was 7.66591777 on Janeiro 22, the first day of the week, showed a gradual decline until Janeiro 26 and reached the lowest value of the week with 4.19787458.
However, as of Janeiro 26, it was determined that Fees (Total) value also started to rise with the increasing volatility in Bitcoin price. In this context, on Janeiro 28, the last day of the weekly period, Bitcoin Fees (Total) closed at 4.71376804.
Miner Flows
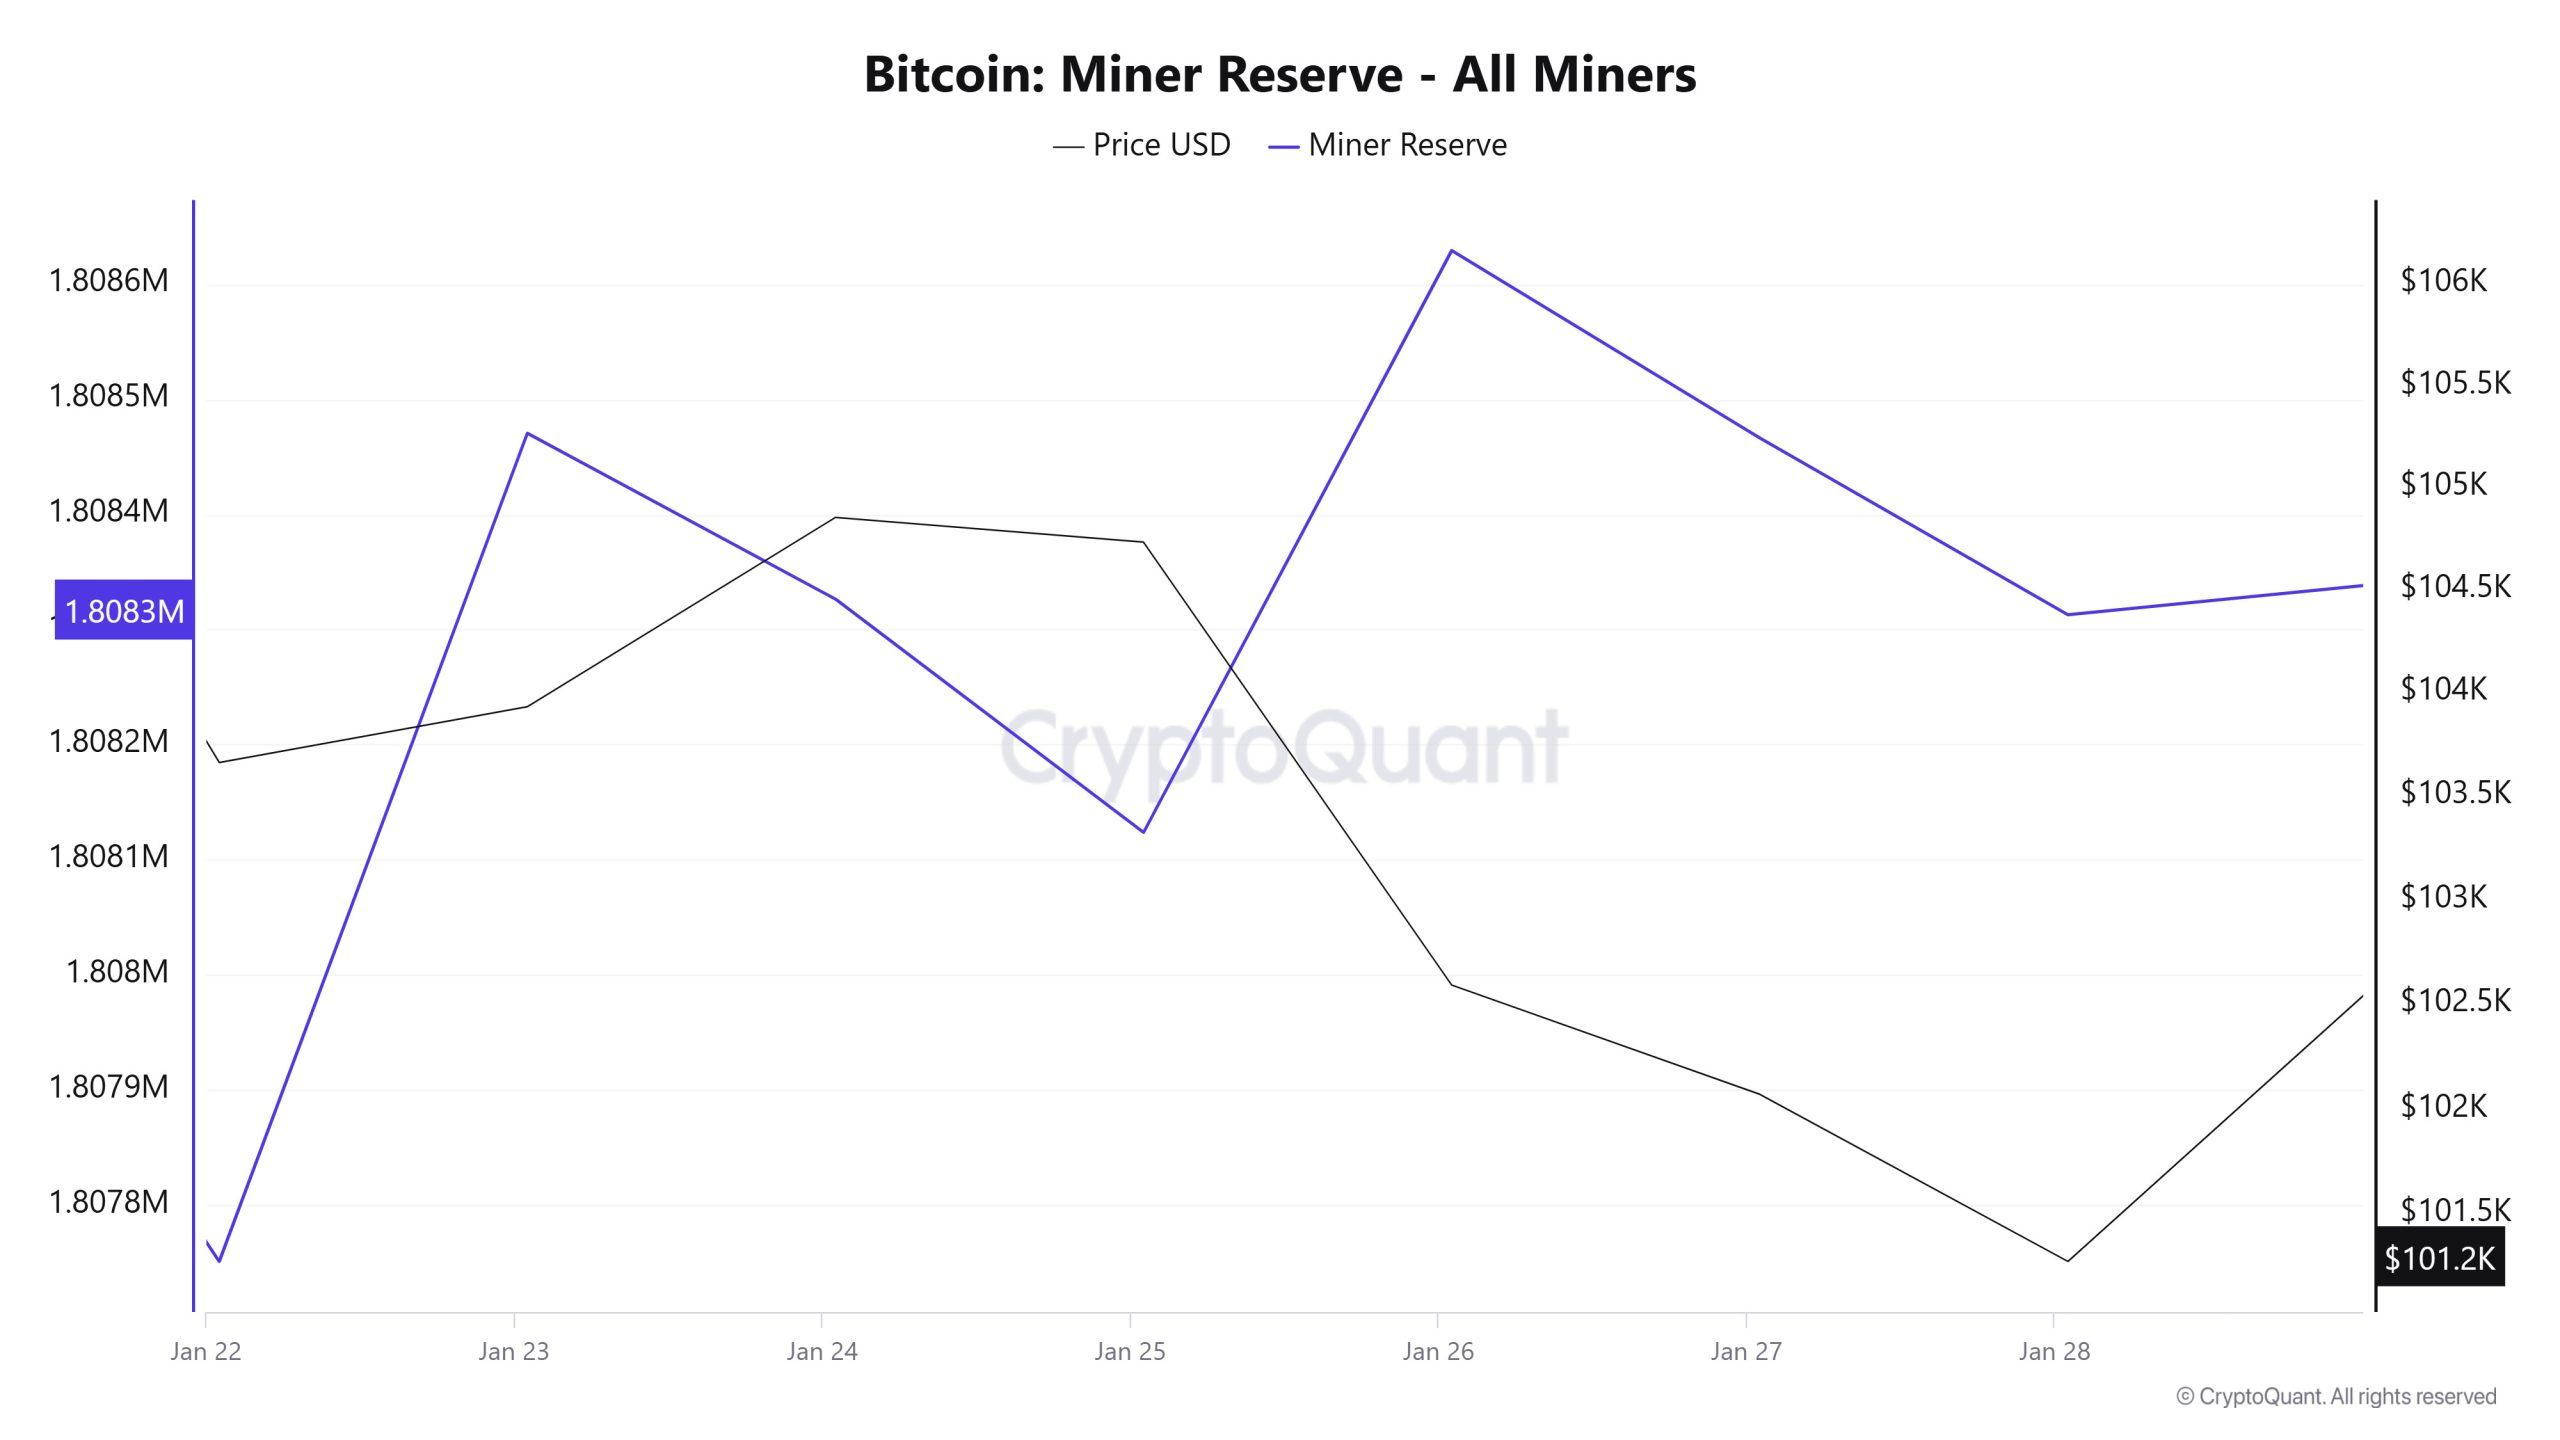
As can be seen in the Miner Reserve table, the number of Bitcoins in miners’ wallets increased this week. Although Miner Reserve and Bitcoin price seem to have turned into a negative correlation from time to time this week, when we look at the week in general, it is seen that Miner Reserve and Bitcoin price are positively correlated.
Miner Inflow, Outflow and NetFlow
Between Janeiro 22 and Janeiro 28, 43,720 Bitcoins were outflowed from miners’ wallets and 43,878 Bitcoins were inflowed into miners’ wallets between the same dates. The Miner NetFlow for this week was 158 Bitcoin. Meanwhile, the Bitcoin price was $103,659 on Janeiro 22 and $101,275 on Janeiro 28.
For the week, the net flow (Miner NetFlow) was positive as Bitcoin inflow into miner wallets (Miner Inflow) was higher than Bitcoin outflow from miner wallets (Miner Outflow).
| Date | 22-Jan | 23-Jan | 24-Jan | 25-Jan | 26-Jan | 27-Jan | 28-Jan |
|---|---|---|---|---|---|---|---|
| Miner Inflow | 6,853.52 | 8,530.16 | 5,388.89 | 4,130.32 | 2,917.05 | 9,873.43 | 6,185.10 |
| Miner Outflow | 7,257.14 | 7,810.69 | 5,532.96 | 4,332.98 | 2,411.62 | 10,036.31 | 6,338.61 |
| Miner Netflow | -403.62 | 719.47 | -144.07 | -202.65 | 505.43 | -162.88 | -153.51 |
Transaction
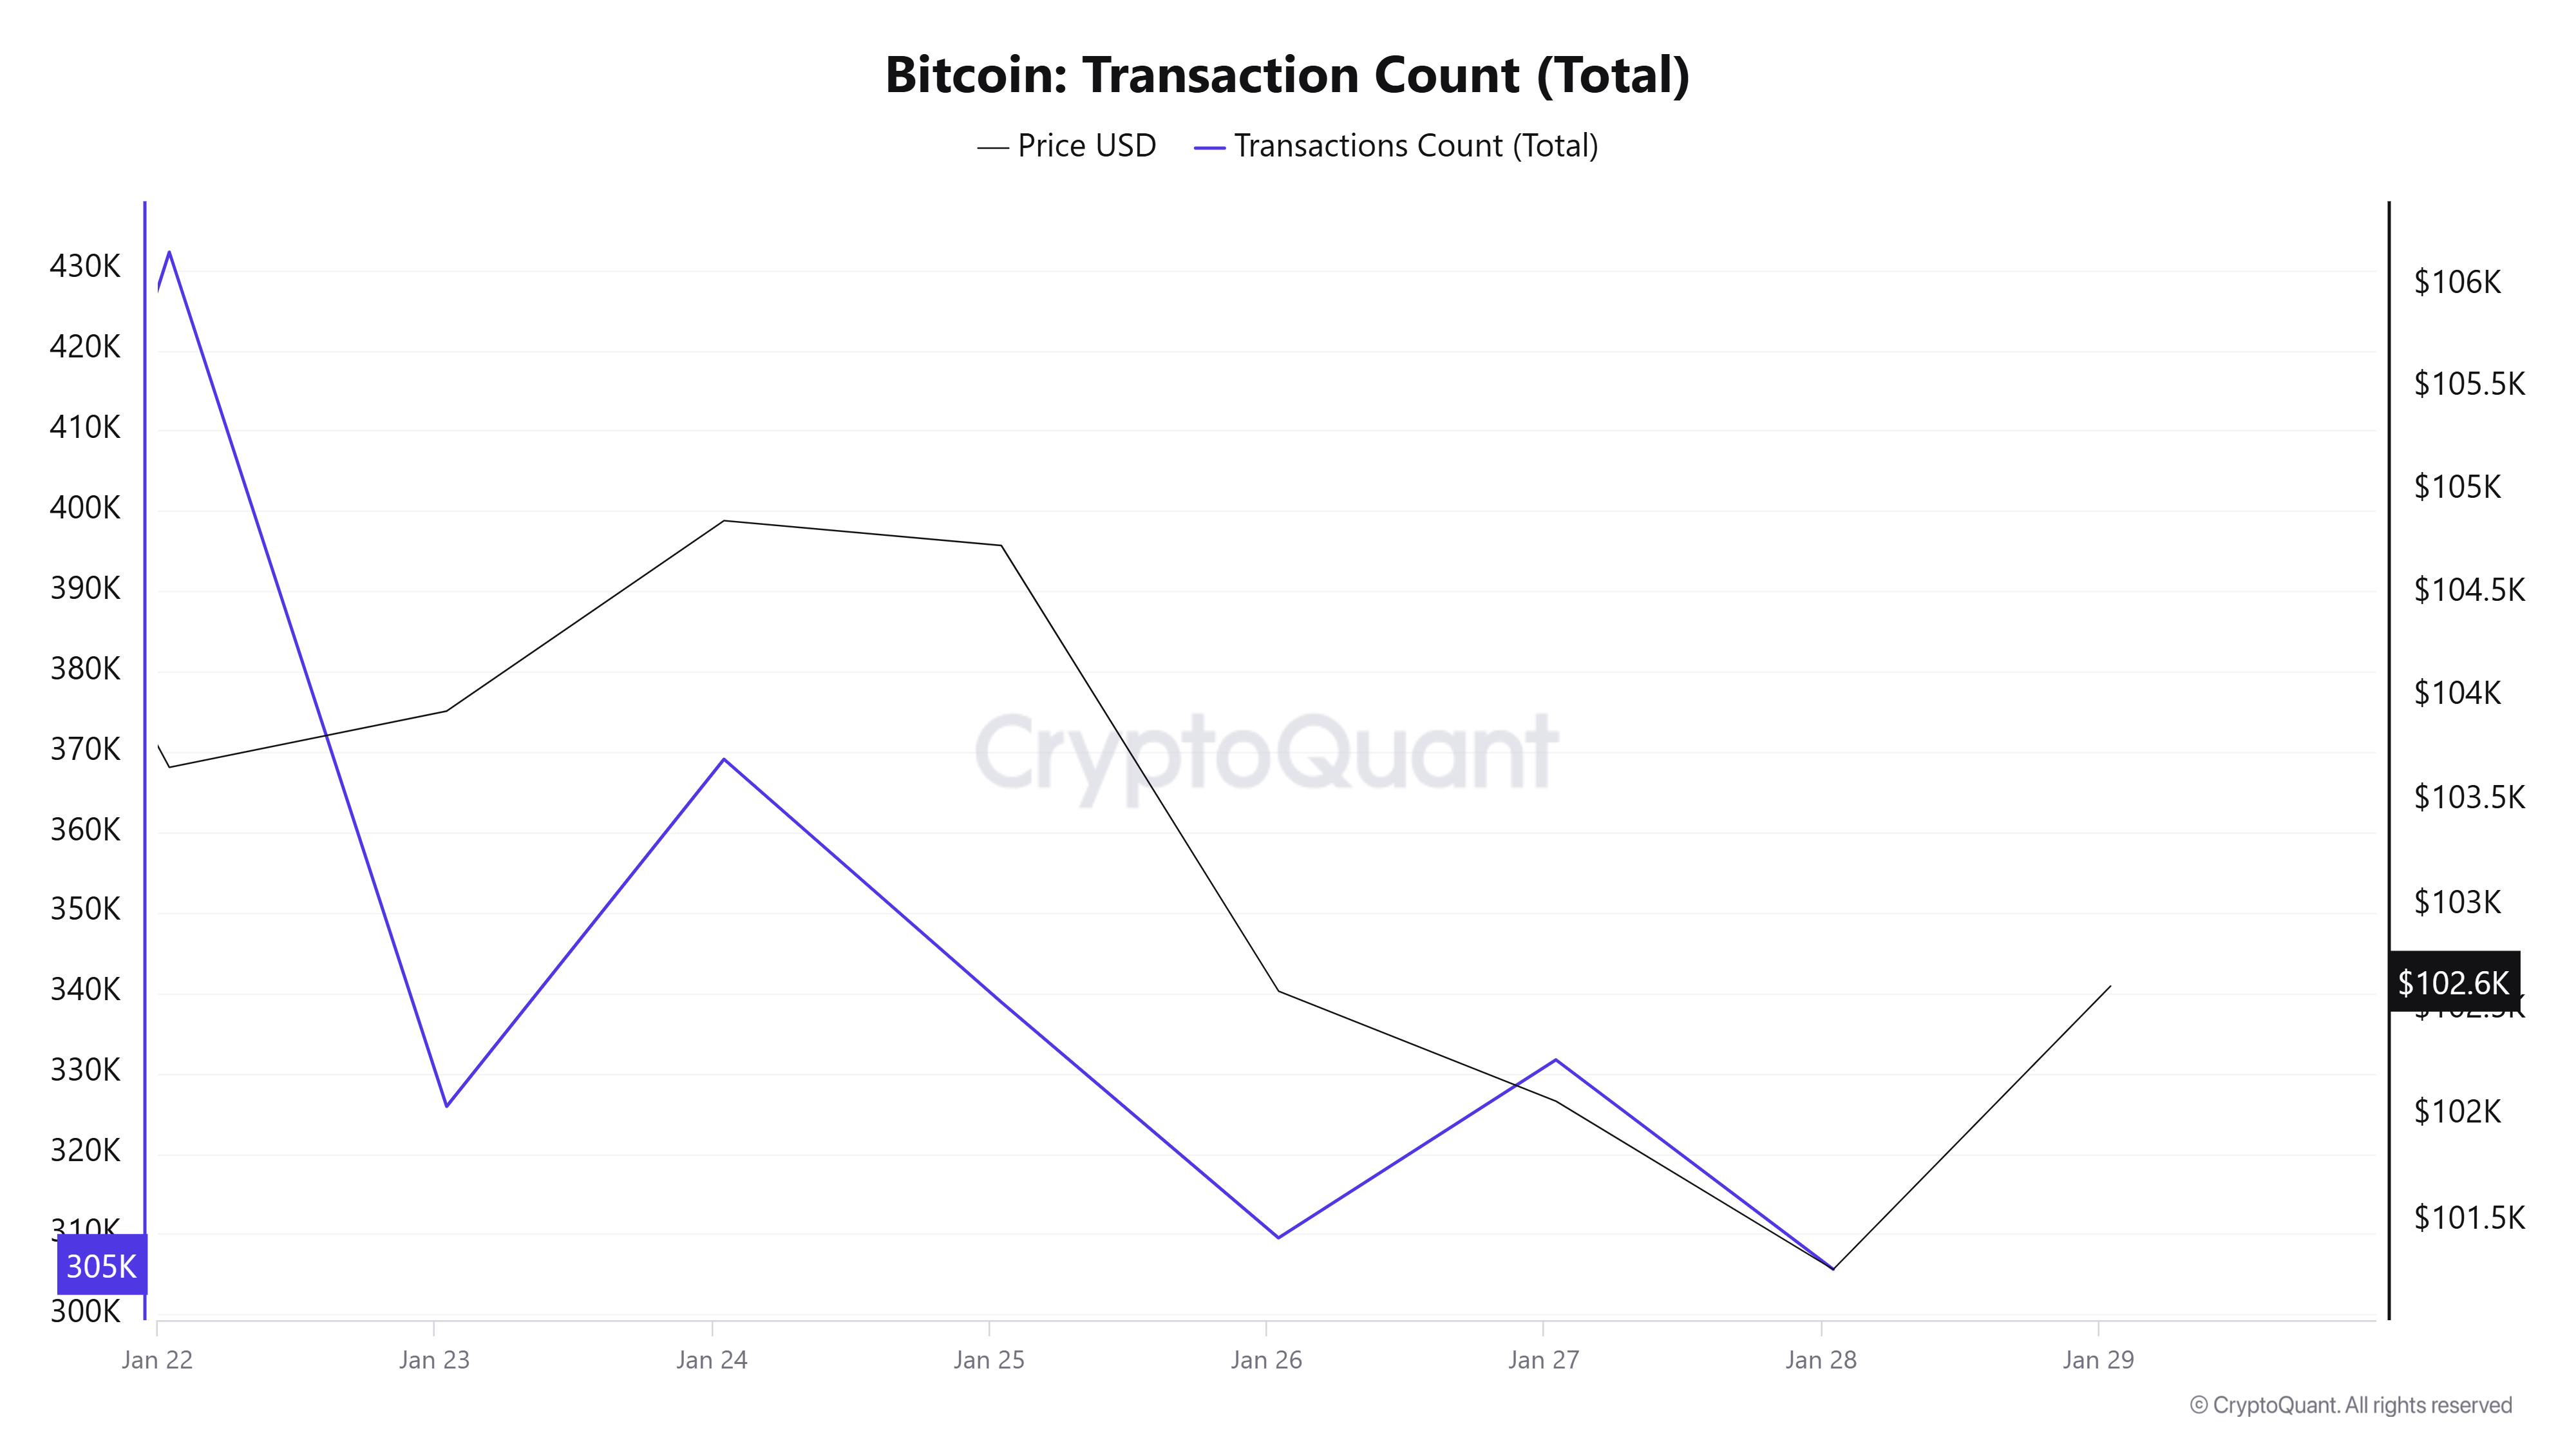
Transaction Count
While a total of 2,578,010 transactions took place between Janeiro 15-21, the number of transactions decreased to 2,412,858 between Janeiro 22-28, a decrease of approximately 6.4% compared to the previous week. It is also noteworthy that the lowest trading volume on the network occurred on Terça-feira, Janeiro 28. This marks a departure from the trading declines that are usually characteristic of weekends. The highest number of transactions for the week was 432,219 on Janeiro 22. Overall, there was a fluctuating decline in the Bitcoin price and the number of transactions between Janeiro 22 and 28.
Tokens Transferred
Between Janeiro 15 and 21, the amount of Bitcoin transferred was 6,005,751, while between Janeiro 22 and 28, it decreased to 4,413,112, a 26.5% decrease compared to the previous period. The lowest levels of Bitcoin transferred were observed on Saturdays and Sundays, as in previous periods. On Janeiro 24 and 27, there was an inverse correlation between the amount of Bitcoin transferred and its price, while on the other days, the transfer amount and Bitcoin price changed in direct proportion.
Whale Activities
The growing influence of new whales in the Bitcoin market has been particularly noteworthy in recent times. The share of new whales in total realized capitalization has now reached 60%. It was reported that new whales entered the active growth phase, especially when the Bitcoin price reached $ 55,000, and their share increased by 43% in this process, reaching 60% of the total realized capitalization. These whales are defined as market participants holding more than 1,000 BTC but with a coin age of less than 155 days. While old whales stick to longer-term strategies, new whales stand out as investors who react faster to market changes and actively trade. According to analyst AxelAdlerJr, large investors, or “whales”, who play an important role in the Bitcoin market, continue to shape both long-term stability and short-term market dynamics. On the other hand, according to the latest data reported by Santiment, the number of wallets holding between 100 and 1,000 BTC reached an all-time high of 15,777. This increase indicates that the confidence of large investors in Bitcoin is rising and their influence on the market is strengthening. In addition, on Janeiro 26, CryptoQuant CEO Ki Young Ju shared a post; “I think we are now in the early stage of distribution because new retail investors are entering the market, Trump’s global promotional effect could revive this bull market. He stated.
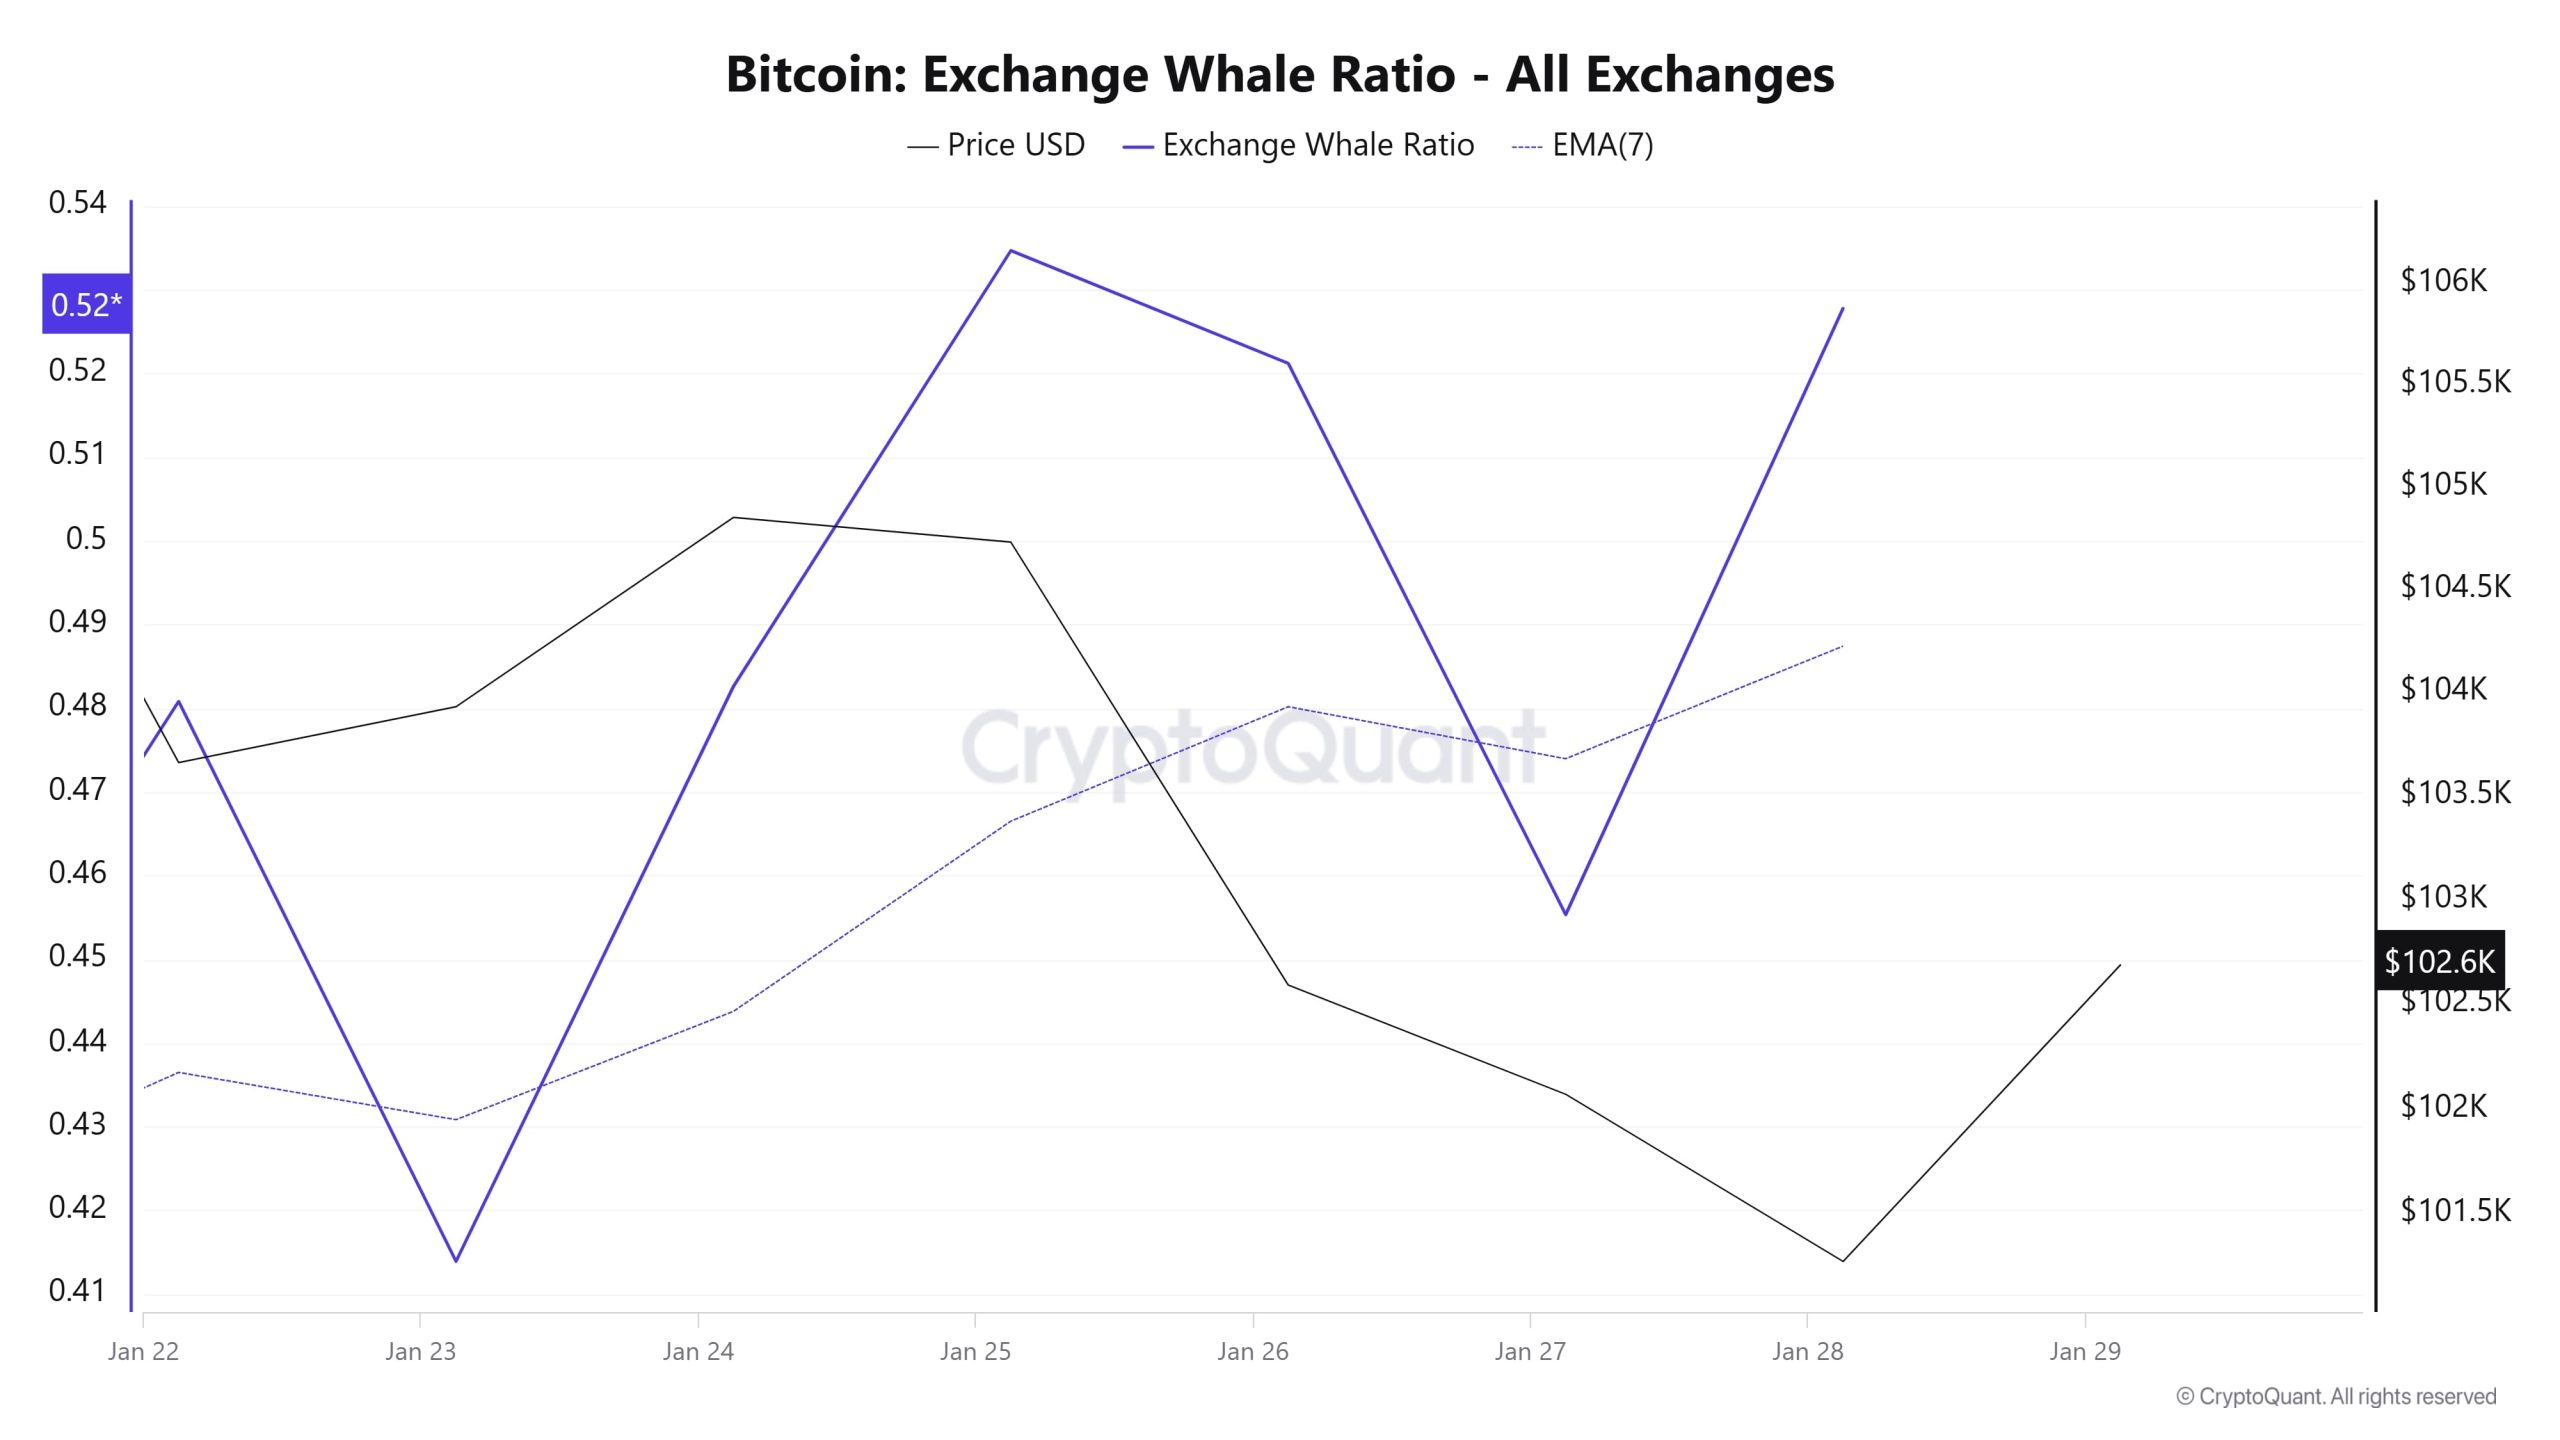
Whales Data
According to the data that attracted attention in the cryptocurrency market in the last 7 days, whale activity on the central exchange has reached high levels. When we look at the last 7 days of whale movements, it shows that central exchanges are being used by whales in an excessive way. When we look at the Exchange Whale Ratio metric, this measurement, which was 0.41 on Janeiro 23rd, is seen as 0.52 at the time of writing. This shows us that whales are currently using centralized exchanges too much. When this ratio is above 0.350, it usually means that whales use centralized exchanges frequently. In the first half of this 7-day period , the use of centralized exchanges, which were underutilized, seems to have increased more towards the end. At the same time, total BTC transfers decreased by 26% compared to last week, with 4,413,112 BTC moving.
AVISO LEGAL
As informações, comentários e recomendações sobre investimentos contidos neste documento não constituem serviços de consultoria de investimentos. Os serviços de consultoria de investimento são prestados por instituições autorizadas em caráter pessoal, levando em conta as preferências de risco e retorno dos indivíduos. Os comentários e recomendações contidos neste documento são de caráter geral. Essas recomendações podem não ser adequadas à sua situação financeira e às suas preferências de risco e retorno. Portanto, tomar uma decisão de investimento com base apenas nas informações contidas neste documento pode não resultar em resultados que estejam de acordo com suas expectativas.
NOTE: All data used in Bitcoin onchain analysis is based on Cryptoqaunt.
