Haftalık Temel Analiz Raporu - 08 Ağustos
Korku ve Açgözlülük Endeksi
Kaynak: Alternatif
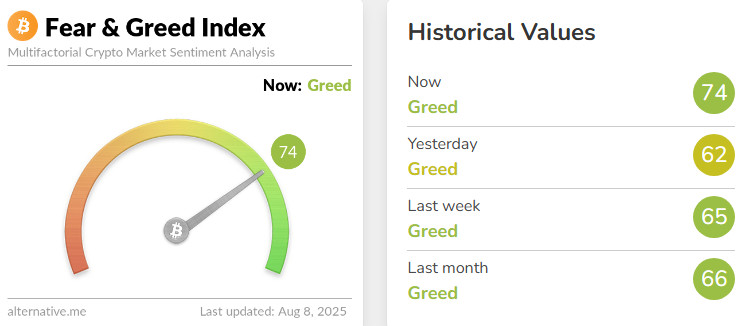
- Korku ve Açgözlülük Değerindeki Değişim: +9
- Geçen Hafta Seviye: 65 (Açgözlülük)
- Bu Haftanın Seviyesi: 74 (Açgözlülük)
Korku ve Açgözlülük Endeksi bu hafta 65'ten 74'e yükselerek yatırımcı duyarlılığında belirgin bir güçlenmeye işaret etti. Haftaya girerken, geçtiğimiz hafta ABD'de açıklanan tarım dışı istihdam verisi beklentilerin altında kalarak Fed'in Eylül ayında faiz indirimine daha yakın olduğu algısını güçlendirdi. Bu zayıf veri ile birlikte Hazine tahvil getirileri düştü ve riskli varlıklara olan talep arttı. Hafta ortasında Fed üyelerinin, özellikle San Francisco Fed Başkanı Daly'nin enflasyonun düşmeye devam ettiğine ve ekonomik aktivitede yavaşlama işaretlerinin arttığına işaret eden açıklamaları piyasalarda faiz indirimi beklentisini daha da güçlendirdi. Öte yandan ABD'nin yeni gümrük tarifeleri uygulaması kısa süreli bir küresel tedirginliğe neden olsa da Apple'ın 100 milyar dolarlık yatırım planı ve Amazon, Tesla gibi şirketlerin beklentileri aşan performansı teknoloji hisselerindeki yükselişi destekledi. Kripto para piyasasında ise ABD'de emeklilik fonlarının Bitcoin'e yatırım yapmasına izin veren yeni kararname kurumsal talebin artabileceği beklentisini tetikledi. Bu gelişmeyle Bitcoin 117.000 dolar seviyesine yaklaşırken, Ethereum ve diğer altcoinler de toparlandı. Sonuç olarak, faiz indirimi beklentileri, güçlü şirket bilançoları ve kripto piyasasına yönelik olumlu adımlar yatırımcı duyarlılığını güçlendirdi ve Korku ve Açgözlülük Endeksi haftayı yukarı yönlü bir notla kapattı.
Fon Akışları
Kaynak CoinShares
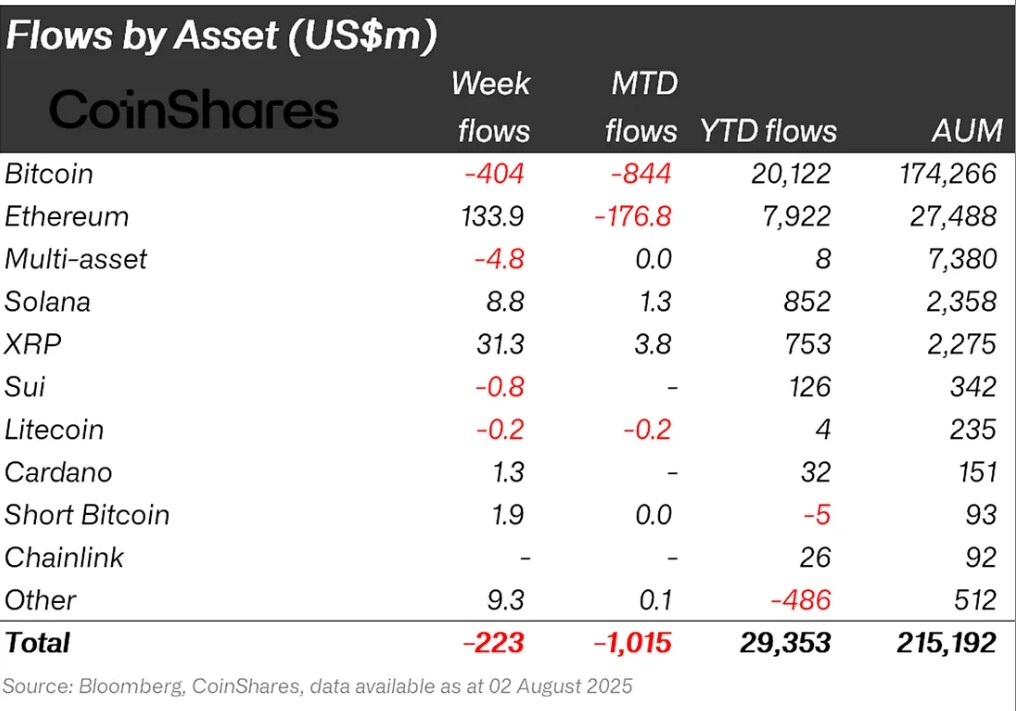
Genel Bakış Kripto piyasası, makroekonomik belirsizliklerin artması, gümrük tarifelerinde istikrar sağlanamaması ve Fed ile yapılan görüşmelerde faiz indirimi beklentilerinin zayıflaması gibi olumsuz gelişmeler nedeniyle gücünün azaldığı bir döneme girdi. Özellikle ABD Başkanı Donald Trump'ın 7 Ağustos'ta özel varlıkların emeklilik fonlarına dahil edilmesini kolaylaştıran bir kararname imzalaması piyasalarda heyecan yarattı.
Ethereum (ETH): Spot ETH, kurumsal ilgi ve fon girişleri sayesinde güçlü performans göstermeye devam etti. Bu hafta Ethereum'a 133,9 milyon dolar giriş oldu.
Ripple (XRP): ProShares Ultra XRP ETF'nin (UXRP) onaylanması ve piyasaya sürülmesi, kurumsal yatırımcıların XRP'ye erişimini sağladı. Bu hafta Xrp'ye fon girişi 31,3 milyon dolar olarak gerçekleşti.
Solana (SOL): Solana'da son ETF haberleri devam etti. Solana 8,8 milyon dolarlık giriş gördü.
Cardano (ADA): Cardano Vakfı kurumsal düzeyde denetlenebilir stratejik çalışmalar yapmaya devam ediyor. Bu hafta Cardano 1,3 milyon dolarlık giriş gördü.
Diğer: Altcoinlerde sektörel ve proje bazlı ralliler görüldü. Bu ataklar fon akışı verilerinde 7,3 milyon dolarlık bir girişe yol açtı.
Kısa Bitcoin: Kısa bitcoin pozisyonlarından çıkışlar toplam 1,9 milyon dolar oldu.
Fon Çıkışları:
Bitcoin (BTC): Bitcoin odaklı fonlardan çıkışlar bu hafta toplam 404 milyon doları buldu.
SUI: Dijital varlık bankası Sygnum, Sui blok zincirinin tokenı SUI'yi entegre ederek platformunda alım trading ve saklama hizmetleri sunmaya başladıSui bu hafta toplam 0,8 milyon dolarlık çıkış gördü.
Litecoin (LTC): LTC coin'deki toplam çıkışlar 1,2 milyon dolara ulaştı.
Çoklu varlık: ETF verilerine rağmen çoklu varlık grubunda çıkışlar gözlenmiştir.
Toplam Piyasa Değeri
Kaynak Tradingview
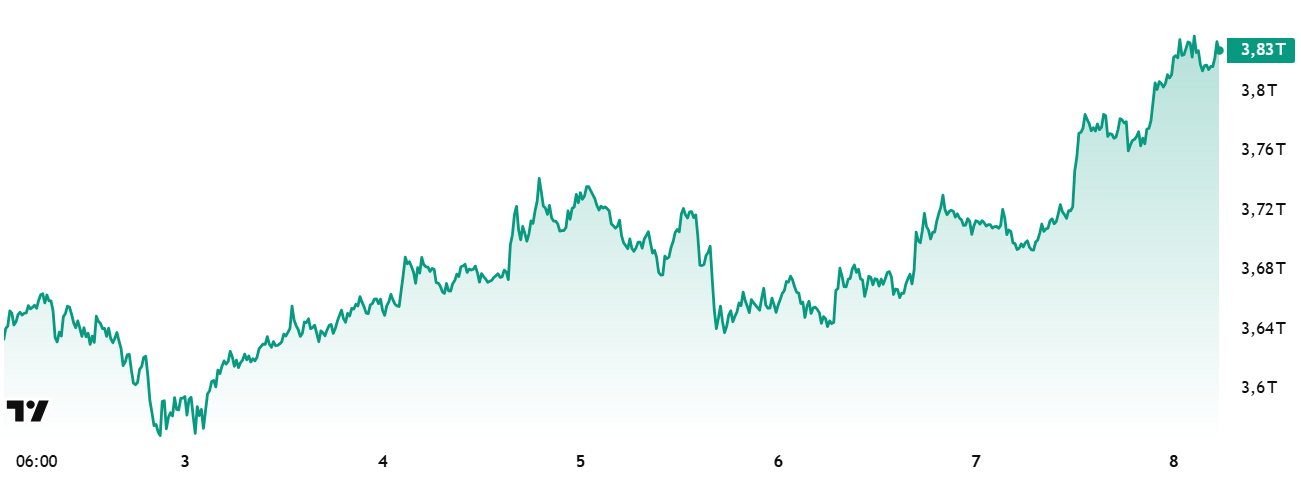
- Geçen Hafta Piyasa Değeri: 66 trilyon Dolar
- Bu Hafta Piyasa Değeri: 83 trilyon Dolar
Kripto para piyasası bu hafta yaklaşık 170 milyar dolarlık sermaye girişiyle toplam piyasa değerinde %4,43'lük bir artış kaydetti. Bu hareketle birlikte toplam piyasa değeri 3,82 trilyon dolara ulaştı. Hafta içinde piyasa değeri 3,85 trilyon dolara yükselerek yeni bir zirveye ulaşmaya çalışmış ancak bu girişim başarısızlıkla sonuçlanmıştı. Bu gelişmeler ışığında geçen haftaki düşüşün kalıcı olmadığını ve piyasanın yukarı yönlü seyrine devam ettiğini görüyoruz.
Toplam 2
Total 2 endeksi haftaya 1,38 trilyon dolar piyasa değeri ile başladı. Hafta içinde yaşanan %8'lik artışla birlikte yaklaşık 110 milyar dolar değer kazanarak değerini 1,5 trilyon dolara yükseltti. Bu durum, yaklaşık %13'lük bir yükselişin gerçekleşmesi halinde toplam 2 piyasasında yeni bir rekor kırılmasının teknik olarak hala mümkün olduğunu gösteriyor.
Toplam 3
Total 3 endeksi haftaya 961 milyar dolar piyasa değeri ile giriş yaptı. Hafta içinde yaklaşık 67 milyar dolar değer kazanarak endeksi %7'lik bir artışla 1,03 trilyon dolar seviyesine çekti. Bu gelişmelerle Total 3 all-time high%13 uzaklıkta bulunuyor.
Tüm endekslerin pozitif seyrettiği bu haftada en güçlü duruşu Ethereum gösterdi. Yükselişler değerlendirildiğinde ve endeksler karşılaştırıldığında altcoin piyasasının toplam piyasa içindeki payının bu hafta genel olarak Ethereum çatısı altında iyi bir açılım yaptığı söylenebilir.
Altcoin Sezon Endeksi
Kaynak Coinmarketcap
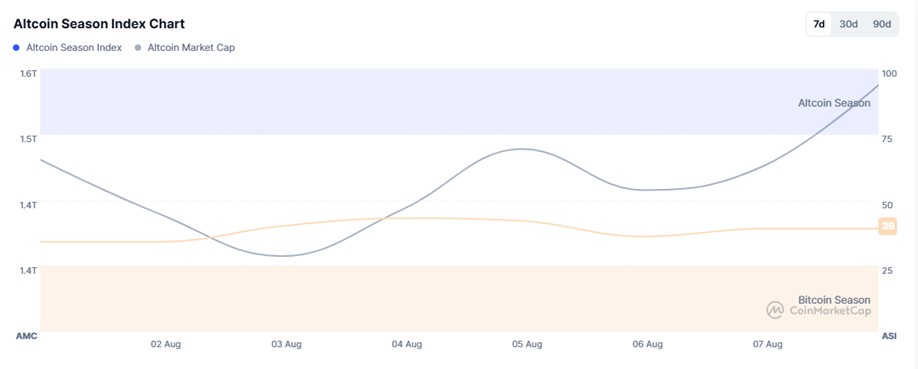
- Geçen Hafta Endeks Değeri: 35/100
- Bu Haftanın Endeks Değeri: 39/100
4 Ağustos ve 8 Ağustos 2025 tarihleri arasında, altcoinlerin piyasa değeri (Altcoin Piyasa Değeri) ile Altcoin Sezon Endeksi arasındaki korelasyon düşüş gösterdi. Grafik, bu hafta endeksin 4 Ağustos ile 8 Ağustos arasında 39'a ulaştığını ve Altcoin Piyasa Değerinin 1,54T'ye ulaştığını gösteriyor. Bu, altcoinlerin piyasa hakimiyetinde geçici bir düşüş olduğunu gösteriyor. Endeks 5 Ağustos'ta 42'ye yükseldi, ancak düşüş trendine girdi ve 39'a geriledi. Bu hareket, altcoin sezonunun kısa bir potansiyel canlanmanın ardından zayıfladığını ve altcoinlerin toplam piyasa değerinin Bitcoin'e kıyasla göreceli bir düşüş yaşadığını gösteriyor.
Bitcoin Hakimiyeti
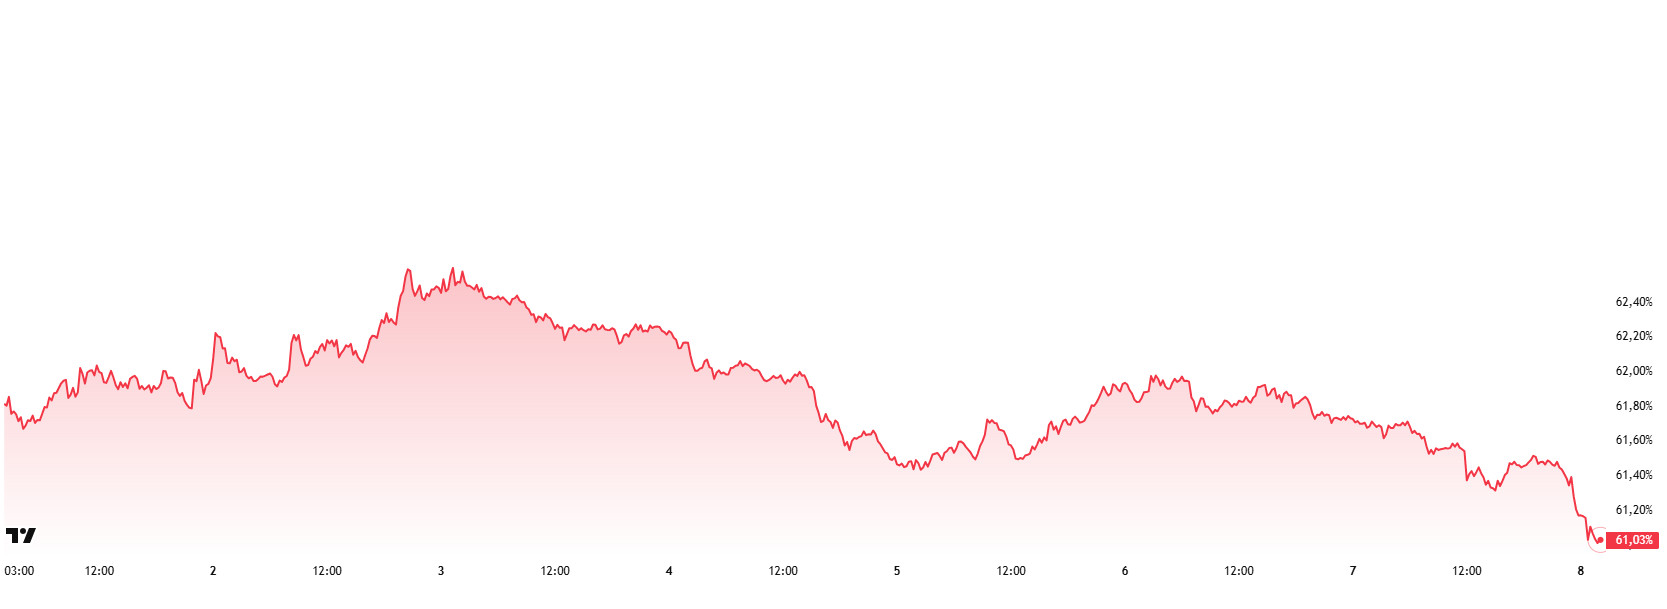
Bitcoin Hakimiyeti
Haftaya %62,15 seviyesinde başlayan Bitcoin baskınlığı hafta boyunca geriledi ve şu anda %61,03 seviyesinde bulunuyor.
Bu hafta Strategy 21.021 Bitcoin, Metaplanet 463 Bitcoin, Smarter Web 225 Bitcoin ve Avrupa'nın ilk Bitcoin hazinesi olan The Blockchain Group 62 Bitcoin satın aldı.
Bitcoin spot ETF'lerine ilişkin veriler, bugüne kadar toplam 157,1 milyon dolarlık net çıkış olduğunu gösteriyor.
Trump, özel varlıkların 401(k) emeklilik fonlarına dahil edilmesini kolaylaştıran ve kripto şirketlerinin bankalarla çalışmasını engelleyen uygulamaları ortadan kaldıran kararnameleri imzaladı. ABD tarafındaki bu olumlu gelişmeler, özellikle perakende yatırımcılar arasında risk iştahının artmasına ve spot ETF'lerde alımların artmasına yol açtı. Ayrıca kurumsal yatırımcı cephesinde de girişler devam etti.
Son gelişmeler sadece Bitcoin'e değil Ethereum ve diğer altcoinlere de sermaye girişinin artmasına neden oldu. Bu hafta Ethereum ve diğer altcoinler Bitcoin'den daha iyi performans göstererek ayrıştı. Bu durum Bitcoin'in piyasa hakimiyetinde düşüş beklentisini daha da güçlendirirken, Bitcoin hakimiyetinin önümüzdeki hafta %59 - %61 bandında konsolide olması bekleniyor.
Ethereum Hakimiyeti
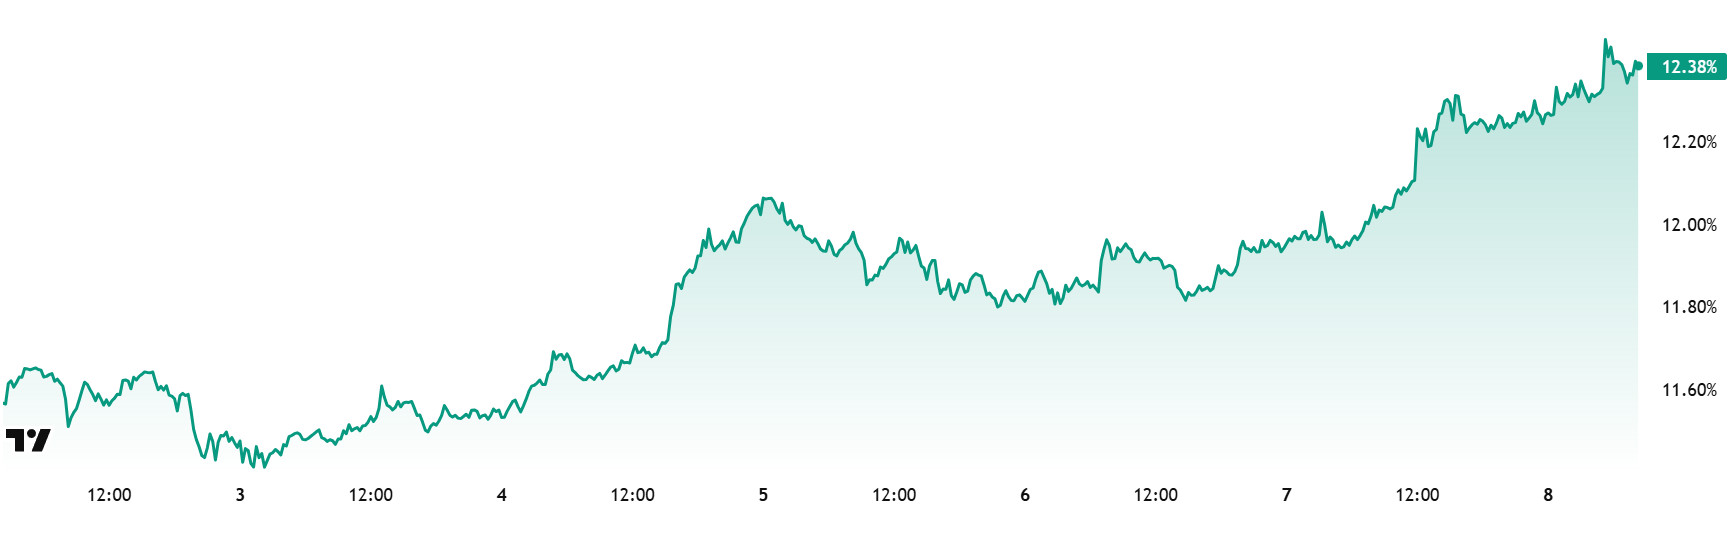
Kaynak: Tradingview
Haftalık Değişim
- Geçen Haftanın Seviyesi: %11,54
- Bu Haftanın Seviyesi: %12,38
Haziran ayının ikinci haftası itibariyle %10'a kadar yükselen Ethereum dominansı, bu kritik eşiği geçemeyerek %8,60'a kadar geriledi. Ancak bu seviyelerde destek bulan baskınlık yeniden pozitif bir ivme kazanarak istikrarlı bir yükseliş eğilimi sergiledi ve %12 seviyesini aştı.
Buna göre, Ethereum hakimiyeti geçen haftayı %11,54 ile kapatırken, güncel veriler itibariyle %12,38 civarında trading görüyor.
Aynı dönemde Bitcoin hakimiyeti ise Ethereum'un aksine negatif bir seyir izleyerek düşüş eğilimi gösterdi.
Ethereum hakimiyetini etkileyen önemli gelişmelere bakıldığında, Ethereum Vakfı L1 ölçeklenebilirliğine yönelik önemli adımlar attı. Buna göre Marius van der Wijden eş lider olarak atandı, gaz limiti 45 milyona çıkarıldı, veri geçmişi silme özelliği hayata geçirildi ve Glamsterdam yükseltmesi için BAL'ların değerlendirilmesine başlandı. Ayrıca, zkEVM teknolojisi üzerinde gerçek zamanlı kanıt çalışmaları hızla ilerlemekte ve performans mühendisliği direktörü pozisyonu için işe alım süreci devam etmektedir. Kurumsal tarafta ise Nasdaq'ta listelenen Cosmos Health, yeni Ethereum hazine stratejisi doğrultusunda 300 milyon dolarlık bir menkul kıymet alım anlaşması imzaladığını duyurdu. Öte yandan, yine Nasdaq'ta listelenen SharpLink (SBET), hisse başına 19,50 $ fiyatla 200 milyon $'lık özel finansman turunu başarıyla tamamladı. Bu fon, şirketin Ethereum kasasını genişletmek için kullanılacak. SharpLink'in stratejisi, ETH biriktirip stake ederek ve hisse başına ETH miktarını artırarak Ethereum'u küresel finansal altyapı haline getirmek.
Kurumsal alım tarafında da kayda değer gelişmeler yaşandı. Geçtiğimiz hafta SharpLink Gaming, 28 Temmuz - 3 Ağustos tarihleri arasında 83.561 ETH satın alarak toplam Ethereum rezervini 521.939 ETH'ye çıkardı. Solid Intel verilerine göre, GameSquare 10 milyon dolar karşılığında 2.717 Ethereum satın alarak toplam ETH varlığını 15.630'a çıkardı. Ether Machine ise ortalama 3.781 $ fiyatla 10.605 adet ETH satın alarak toplam rezervini 345.362 ETH'ye çıkardı. Son olarak, The Data Nerd'e göre, Cumberland Coinbase'den 36.918 ETH (yaklaşık 132,8 milyon $) çekerken, Abraxas Capital Binance borsasından 7.191 ETH (yaklaşık 25,9 milyon $) satın aldı.
Bitcoin Spot ETF
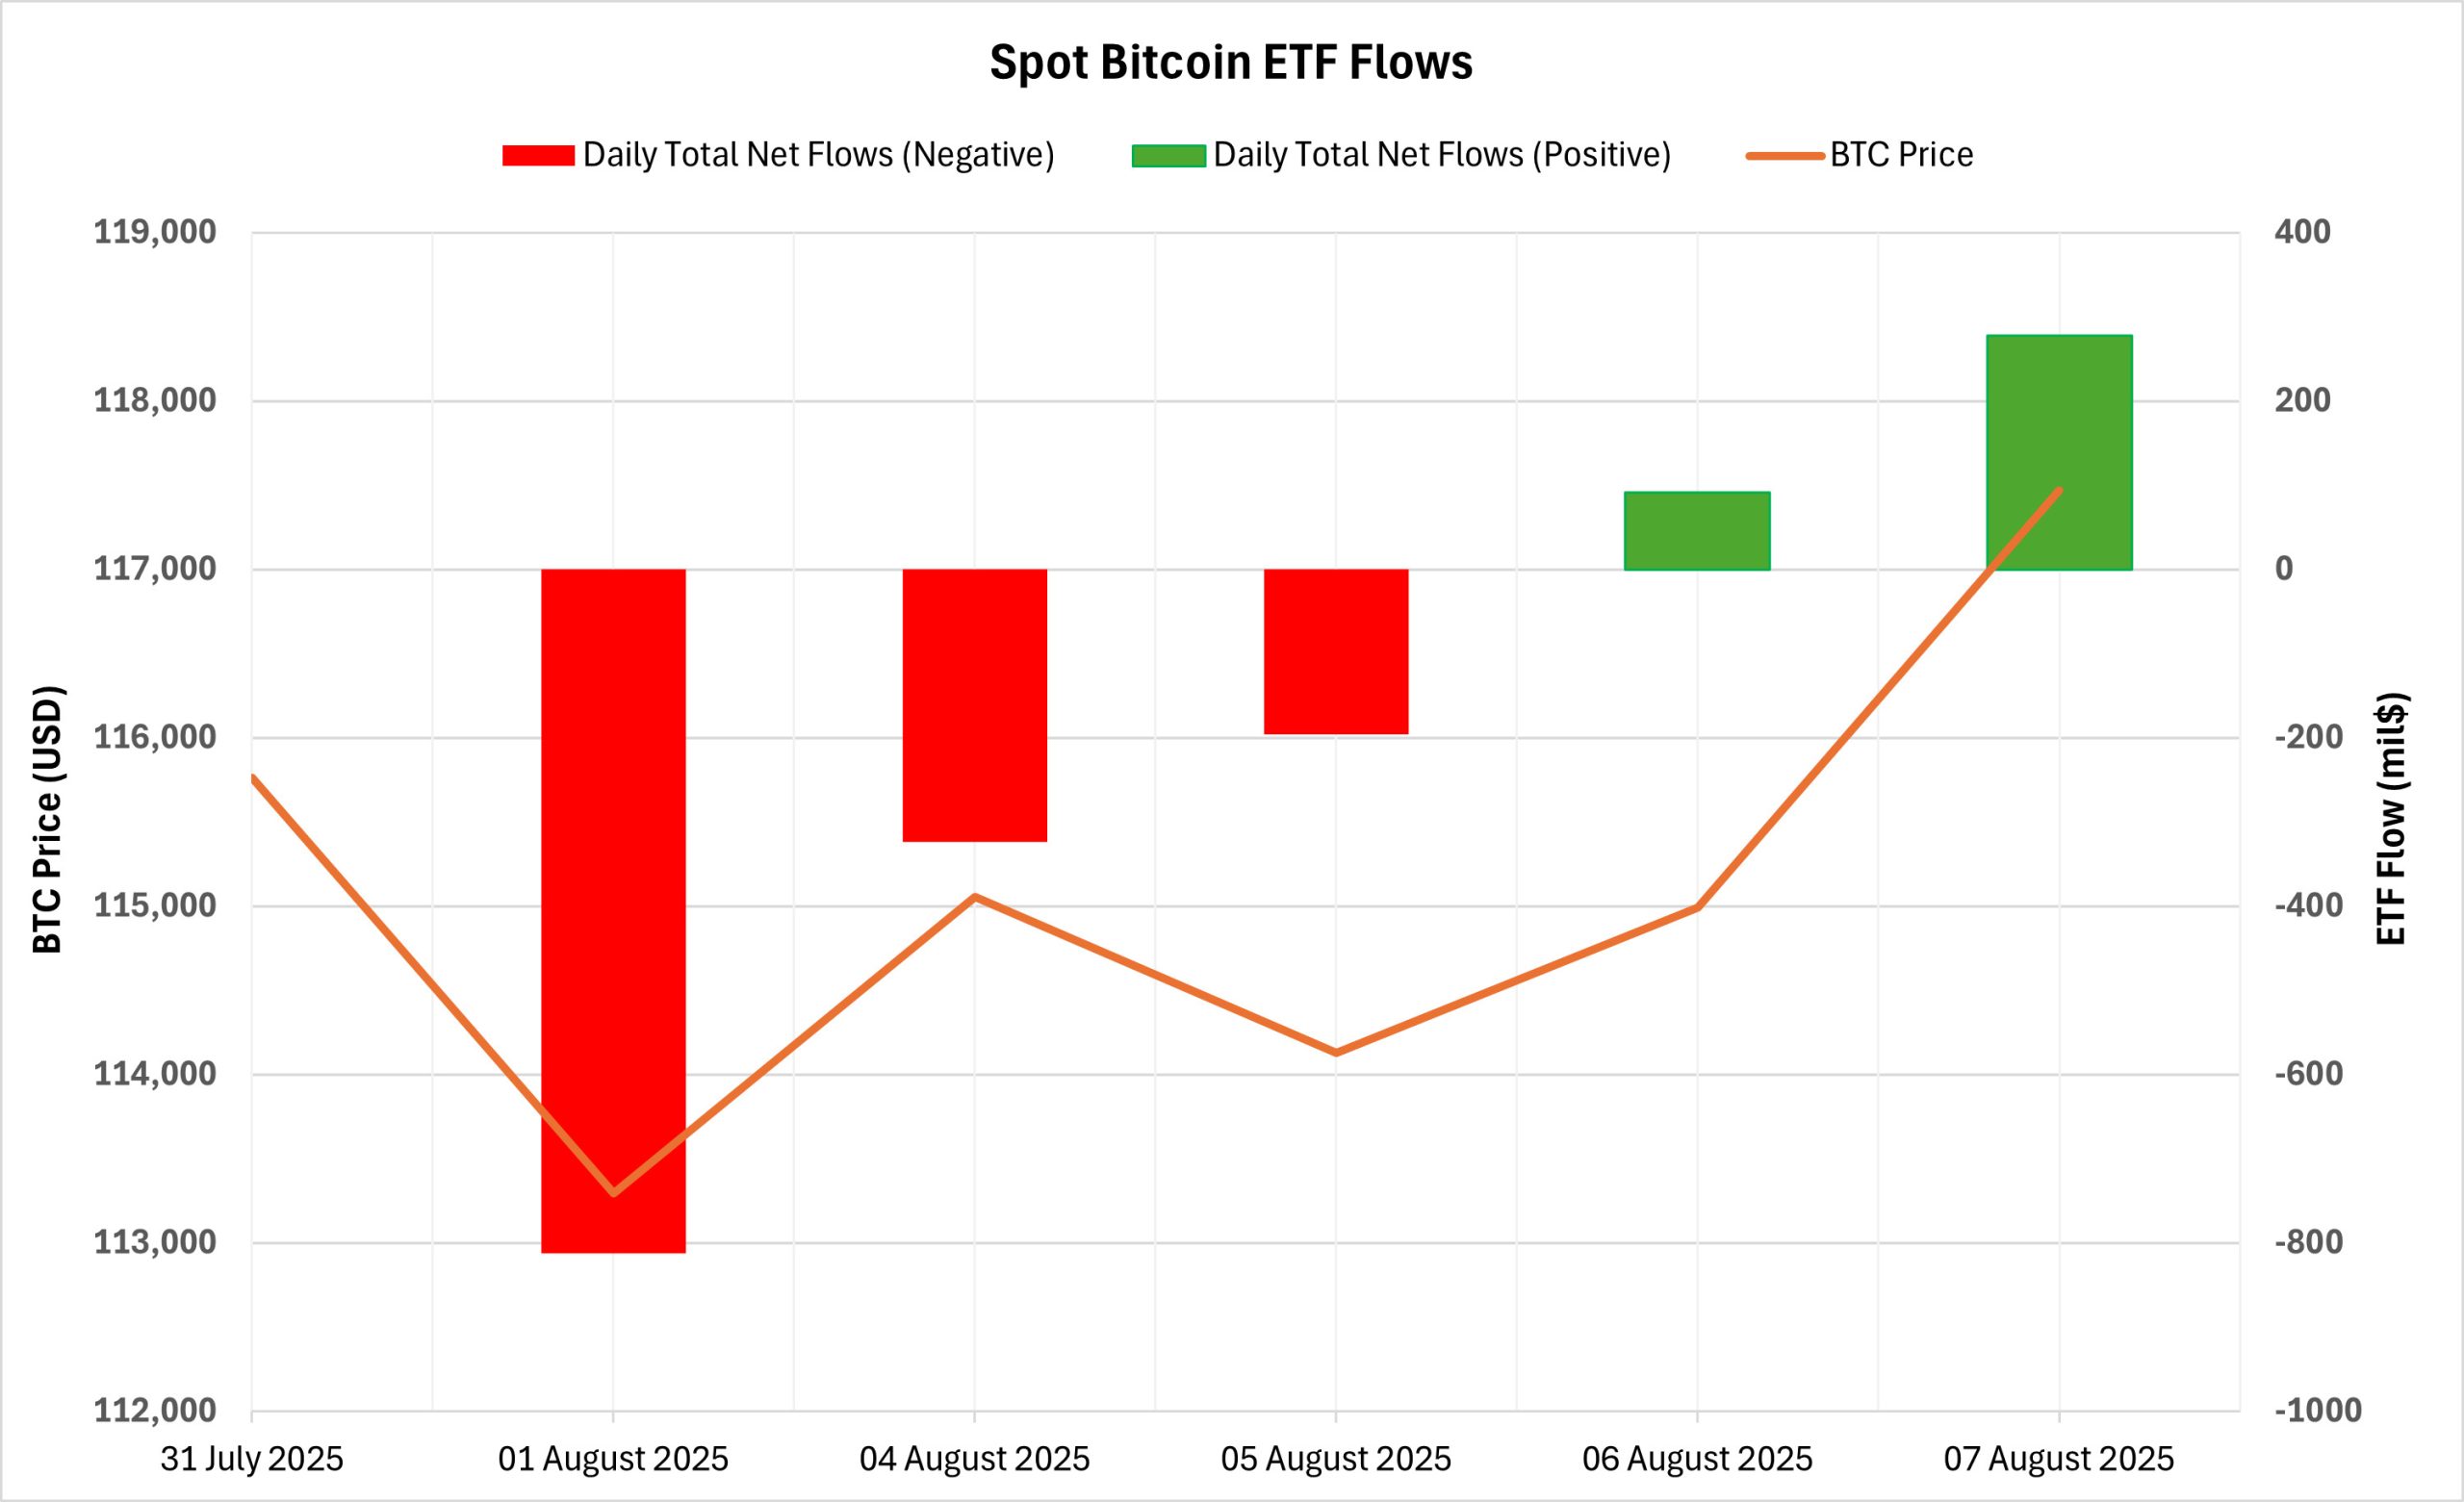
Net Akış Durumu: Spot Bitcoin ETF'lerinde 01-07 Ağustos 2025 tarihleri arasında toplam 963 milyon dolarlık net çıkış görüldü. Haftanın en büyük çıkışı 812,3 milyon dolarla 01 Ağustos'ta kaydedildi. Özellikle, 01 Ağustos 2025 tarihinde Fidelity'nin FBTC ETF'sinden 331,4 milyon $ ve ARK'ın ARKB ETF'sinden 327,9 milyon $, 04 Ağustos 2025 tarihinde ise BlackRock'ın IBIT ETF'sinden 292,2 milyon $ net çıkış gerçekleşti. Bu süreçte yoğun çıkışların yaşandığı 3 trading gününün ardından son 2 trading gününde pozitif net girişler görüldü.
Bitcoin Fiyatı: Ağustos 01'de 115.764 $ seviyesinden başlayan Bitcoin, Ağustos 07'de 117.472 $ seviyesinden kapanış yaptı. Bu süreçte BTC haftalık bazda %1,48 değer kazandı. Özellikle bu dönemde son 2 günde görülen toparlanma ile Bitcoin fiyatı yeniden yukarı yönlü ivme kazandı.
Kümülatif Net Girişler: Spot Bitcoin ETF'lerinin 394. trading günü sonunda toplam kümülatif net girişler 54 milyar dolara geriledi. Özellikle bu dönemin ilk 2 gününde üst üste yaşanan güçlü çıkışlar bu düşüşte belirleyici oldu.
| Tarih | Madeni Para | Açık | Kapat | Değişim % | ETF Akışı (mil$) |
|---|---|---|---|---|---|
| 01-Ağustos-25 | BTC | 115,764 | 113,297 | -2.13% | -812.3 |
| 04-Aug-25 | BTC | 114,208 | 115,055 | 0.74% | -323.5 |
| 05-Ağustos-25 | BTC | 115,055 | 114,129 | -0.80% | -196.2 |
| 06-Aug-25 | BTC | 114,129 | 114,992 | 0.76% | 91.6 |
| 07-Aug-25 | BTC | 114,992 | 117,472 | 2.16% | 277.4 |
| 01 - 07 Ağustos için toplam 25 | 1.48% | -963.0 | |||
Ethereum fiyatı, Ağustos 01, 2025 tarihinde $3,698 seviyesinden açıldı ve Ağustos 07, 2025 tarihinde $3,910 seviyesinden kapandı. Bu süreçte Ethereum fiyatı %5,73 değer kazanmıştır. Bu süreçte görülen sert fiyat düşüşünün ardından yaşanan güçlü toparlanma, yatırımcıların fiyat düşüşünü bir alım fırsatı olarak kullandığını ortaya koyuyor. Fiyatın yeniden 3.900 doların üzerine çıkmış olması, ETF çıkışlarına rağmen piyasada olumlu bir beklentiyi yansıtıyor. Genel olarak Ethereum ETF piyasası bu dönemde net çıkışlarla kısa süreli bir düzeltmeye girdi. Ancak son üç trading gününde net girişlerin yeniden başlaması ve fiyatın yükseliş eğiliminde olması toparlanma sinyallerinin erken geldiğini gösteriyor. Kurumsal talebin yeniden ivme kazanması halinde Ethereum fiyatı önümüzdeki dönemde daha sağlam bir destek zemini oluşturabilir.
Ethereum spot ETF
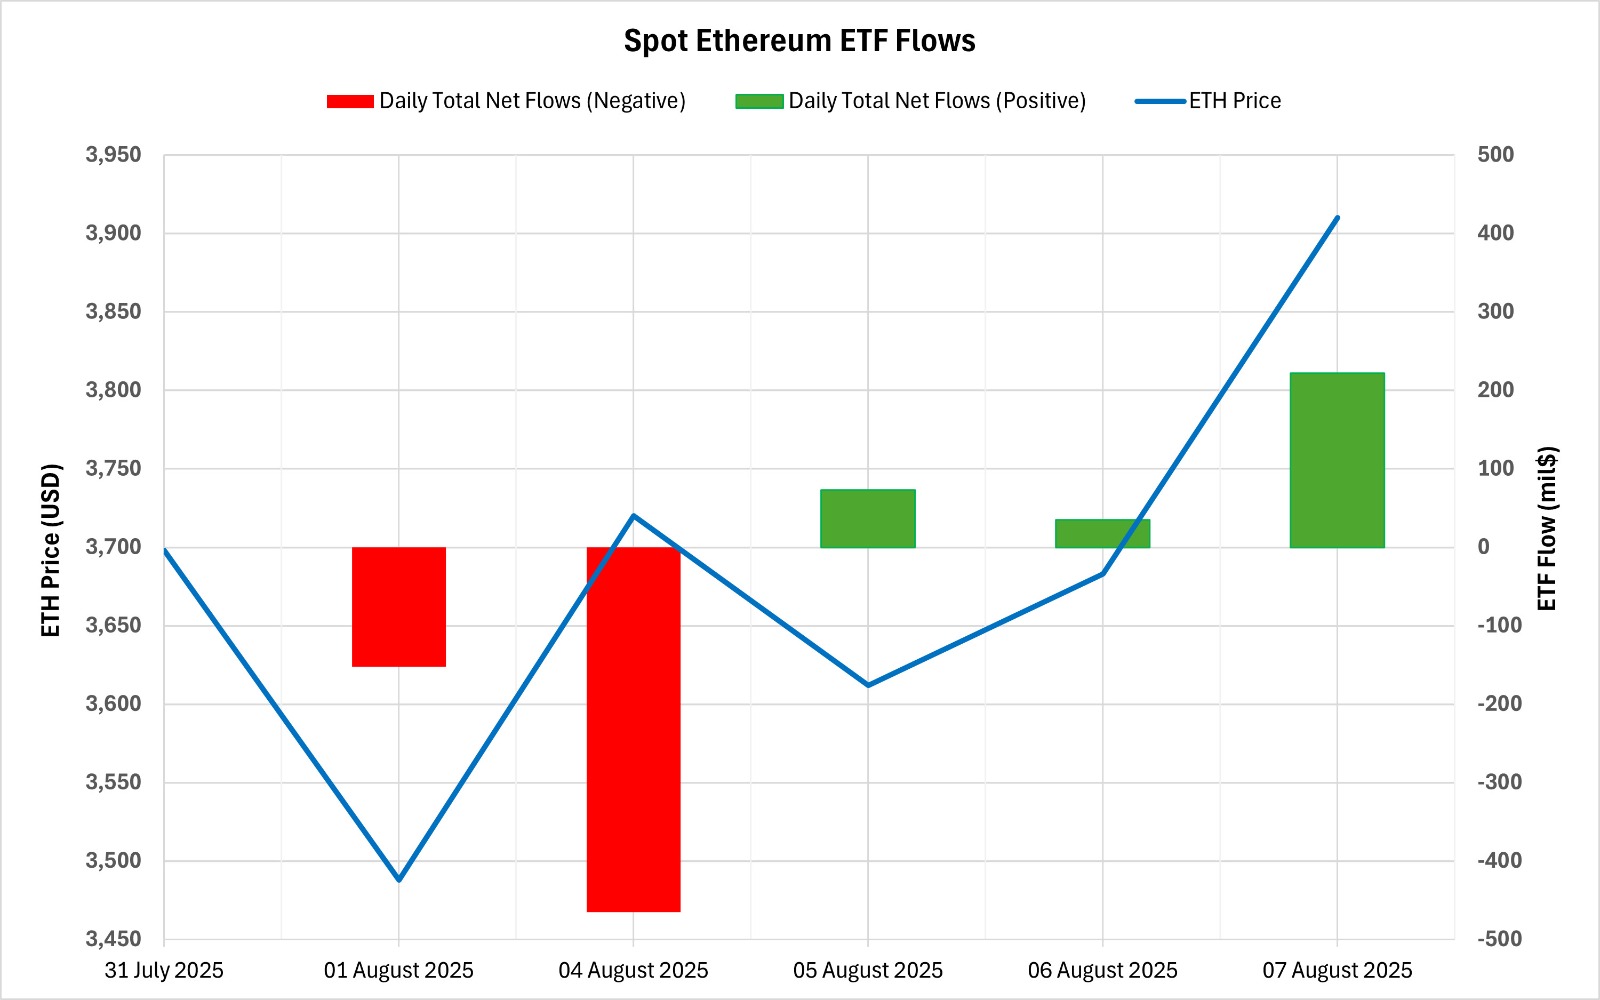
01 Ağustos - 07 Ağustos 2025 tarihleri arasında Spot Ethereum ETF'lerinde toplam 286,7 milyon dolarlık net çıkış görüldü. Günlük bazda en güçlü çıkış 465,1 milyon dolarla 04 Ağustos'ta gerçekleşti. BlackRock'ın ETHA ETF'si 149,3 milyon dolarlık haftalık çıkışla dikkat çekti. 01 Ağustos itibariyle 20 trading günü süren pozitif net akış serisi sona erdi. Bu süreçte ilk iki trading gününde toplam 617,4 milyon dolar giriş yaşandı. Spot Ethereum ETF'lerine 262. trading günü sonunda toplam kümülatif net giriş 9,37 milyar dolara geriledi. Bu durum, kısa vadeli baskıların kurumsal güveni geçici olarak zayıflattığını gösterdi.
| Tarih | Madeni Para | Açık | Kapat | Değişim % | ETF Akışı (mil$) |
|---|---|---|---|---|---|
| 01-Ağustos-25 | ETH | 3,698 | 3,488 | -5.68% | -152.3 |
| 04-Aug-25 | ETH | 3,496 | 3,720 | 6.41% | -465.1 |
| 05-Ağustos-25 | ETH | 3,720 | 3,612 | -2.90% | 73.3 |
| 06-Aug-25 | ETH | 3,612 | 3,683 | 1.97% | 35.1 |
| 07-Aug-25 | ETH | 3,683 | 3,910 | 6.16% | 222.3 |
| 01 - 07 Ağustos için toplam 25 | 5.73% | -286.7 | |||
Ethereum fiyatı, Ağustos 01, 2025 tarihinde $3,698 seviyesinden açıldı ve Ağustos 07, 2025 tarihinde $3,910 seviyesinden kapandı. Bu süreçte Ethereum fiyatı %5,73 değer kazanmıştır. Bu süreçte görülen sert fiyat düşüşünün ardından yaşanan güçlü toparlanma, yatırımcıların fiyat düşüşünü bir alım fırsatı olarak kullandığını ortaya koyuyor. Fiyatın yeniden 3.900 doların üzerine çıkmış olması, ETF çıkışlarına rağmen piyasada olumlu bir beklentiyi yansıtıyor. Genel olarak Ethereum ETF piyasası bu dönemde net çıkışlarla kısa süreli bir düzeltmeye girdi. Ancak son üç trading gününde net girişlerin yeniden başlaması ve fiyatın yükseliş eğiliminde olması toparlanma sinyallerinin erken geldiğini gösteriyor. Kurumsal talebin yeniden ivme kazanması halinde Ethereum fiyatı önümüzdeki dönemde daha sağlam bir destek zemini oluşturabilir.
Bitcoin Opsiyon Dağılımı
Kaynak: Laevitas
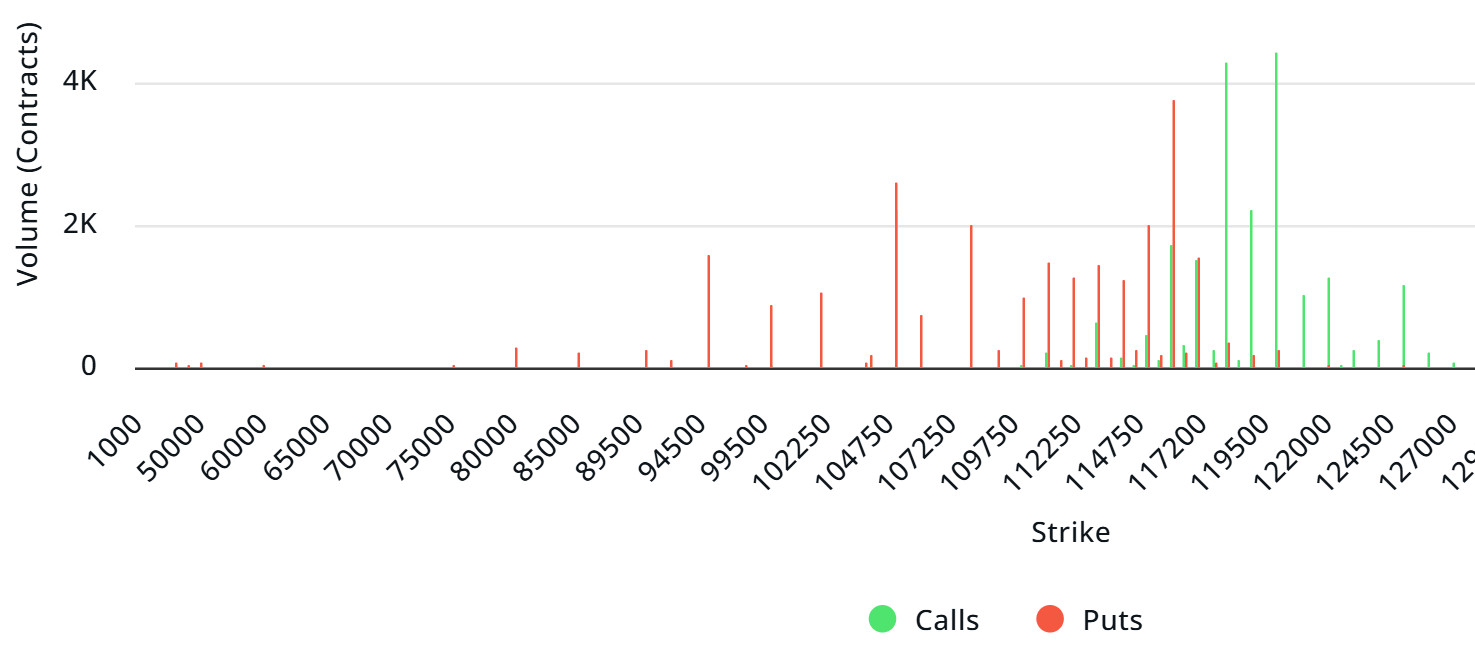
BTC: Nominal: 4,15 Milyar Dolar | Put/Call: 1.38 | Maksimum Ağrı: $115K
Deribit Verileri: Deribit verileri, yaklaşık 4,15 milyar dolarlık nominal değere sahip BTC opsiyon sözleşmelerinin bugün sona erdiğini gösteriyor. Aynı zamanda son 24 saatteki verilere göre önümüzdeki 1 haftalık periyotta risk dönüşümüne bakacak olursak son zamanlarda alım opsiyonlarının tercih edilmeye başlandığı görülüyor, buna rağmen satım opsiyonları alım opsiyonlarına göre hedge etmede daha baskın taraf. Beklenen volatiliteye baktığımızda ise gerçekleşen volatilitenin biraz üzerinde. Bu da satım opsiyonu ücretlerinin ucuz olduğunu gösteriyor. Öte yandan spreadin pozitif olması ve iki volatilitenin birbirine çok yakın olması piyasada çok fazla hareket olacağının işareti olabilir. Skew değerleri bugün ve gelecek hafta için oldukça bearish .
Laevitas Verileri: Grafiği incelediğimizde put opsiyonlarının 105.000 - 116.000 dolar bandında yoğunlaştığını görüyoruz. Alım opsiyonları ise 118.000 - 120.000 dolar aralığında yoğunlaşıyor ve üst seviyelere doğru yoğunlaşma azalıyor. Aynı zamanda yaklaşık 116.000 dolar seviyesi destek, 120.000 dolar seviyesi ise direnç olarak görülüyor. Öte yandan zirvenin yaşandığı 116.000$ seviyesinde 3,76K adet put opsiyonu bulunuyor ve bu seviyeden sonra put hacminde düşüş yaşanıyor. Bununla birlikte 120.000$ seviyesinde 4,42K alım opsiyonu kontratının zirve yaptığı görülüyor. Opsiyon piyasasına baktığımızda günlük ve haftalık bazda put kontratlarının baskın olduğunu görüyoruz.
Opsiyon Vadesi:
Put/Call Oranı ve Maksimum Ağrı Noktası: Laevitas'tan alınan son 7 günlük verilerdeki opsiyonlara bakacak olursak, call opsiyonlarının sayısı geçen haftaya göre yaklaşık %8 azalarak 113,94K olarak gerçekleşti. Buna karşılık, satım opsiyonlarının sayısı geçen haftaya göre %6 artarak 107,69 bin oldu. Opsiyonlar için satım/alım oranı 1,38 olarak belirlendi. Bu durum, yatırımcılar arasında satım opsiyonlarının alım opsiyonlarına kıyasla çok daha fazla talep gördüğünü gösteriyor. Bitcoin'in maksimum acı noktası 115.000 $ olarak görülüyor. BTC'nin 116.600 dolardan fiyatlandığı ve acı noktası olan 115.000 dolar seviyesini aşağı yönlü kırmaması halinde yükselişlerin devam edeceği öngörülebilir.
Ethereum Opsiyon Dağıtımı
Kaynak: Laevitas
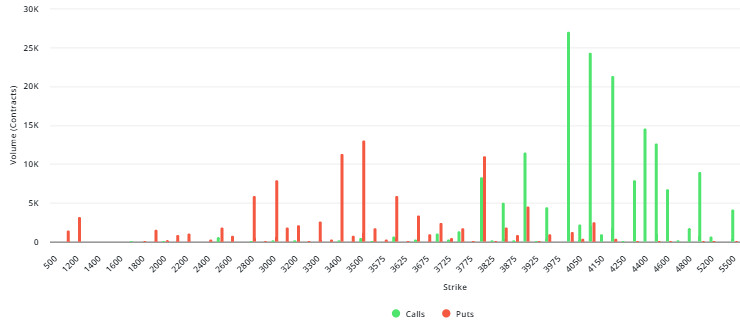
ETH: 792 M $ nominal | Put/Call: 1,06 | Maksimum Acı: 3.600 $
Laevitas Verileri: Grafikteki verilere baktığımızda, satım opsiyonlarının özellikle 3.400 ila 3.800 dolar arasındaki fiyat seviyelerinde yoğunlaştığını görüyoruz. En yüksek satış hacmi yaklaşık 13 bin kontratla 3.500$ seviyesinde ve bu seviye olası bir destek bölgesi olarak düşünülebilir. Öte yandan, alım opsiyonları 4.000$ ile 4.600$ arasında yoğunlaşmış durumda. Özellikle 4.000$ seviyesi yaklaşık 21 bin kontratlık yüksek çağrı hacmiyle öne çıkıyor. Bu seviye piyasada önemli bir direnç bölgesi olarak düşünülebilir.
Deribit Verileri: 9 ve 10 Ağustos Ethereum opsiyon vadeli işlemlerinde piyasa ilgisinde önemli bir artış görüldü. Her iki vadeli işlemdeki toplam açık ilgi sırasıyla yaklaşık 96 milyon $ ve 75 milyon $'a ulaştı. Bu rakamlar, önceki günlere kıyasla %550'nin üzerinde önemli artışları temsil ediyor ve piyasaya yeni ve yüksek hacimli sermaye girişlerine işaret ediyor. Volatilite tarafında ise (özellikle zımni volatilite ya da beklenen volatilite olarak ele alındığında) %25 Risk Reversal (RR) ve %25 Butterfly (BF) gibi göstergelerde olumlu değişimler görülmektedir. Bu artışlar, opsiyon fiyatlamasında oynaklığın arttığına ve dolayısıyla piyasada keskin fiyat dalgalanmalarının beklendiğine işaret etmektedir.
Opsiyon Vade Sonu:
Nominal değeri 792 milyon $ olan Ethereum opsiyonlarının süresi 8 Ağustos'ta doldu. Maksimum Ağrı seviyesi 3.600$ olarak hesaplanırken, satım/alım oranı 1,06'dır.
Yasal Uyarı
Bu dokümanda yer alan yatırım bilgi, yorum ve tavsiyeleri yatırım danışmanlığı hizmeti niteliği taşımamaktadır. Yatırım danışmanlığı hizmeti, yetkili kuruluşlar tarafından kişilerin risk ve getiri tercihleri dikkate alınarak kişiye özel olarak verilir. Bu dokümanda yer alan yorum ve tavsiyeler genel niteliktedir. Bu tavsiyeler mali durumunuz ile risk ve getiri tercihlerinize uygun olmayabilir. Bu nedenle, sadece bu dokümanda yer alan bilgilere dayanarak yatırım kararı vermeniz beklentilerinize uygun sonuçlar doğurmayabilir.